http://www.sciencepublishinggroup.com/j/sjee doi: 10.11648/j.sjee.20190702.12
ISSN: 2376-810X (Print); ISSN: 2376-8126 (Online)
Algorithm for the Performance Evaluation of Three
Selected Wind Energy Conversion Systems (WECS) for
Electricity Generation in Minna, Nigeria
Garba Musa Argungu
1, *, Abubakar Umar Moreh
1, Kabir Ahmed Dabai
1,
Sakina Abdulazeez
1, Samaila Kamba Ahmad
21
Department of Physics, Usmanu Danfodiyo University, Sokoto, Nigeria 2
Department of Mathematics, Usmanu Danfodiyo University, Sokoto, Nigeria
Email address:
*
Corresponding author
To cite this article:
Garba Musa Argungu, Abubakar Umar Moreh, Kabir Ahmed Dabai, Sakina Abdulazeez, Samaila Kamba Ahmad. Algorithm for the Performance Evaluation of Three Selected Wind Energy Conversion Systems (WECS) for Electricity Generation in Minna, Nigeria. Science Journal of Energy Engineering. Vol. 7, No. 2, 2019, pp. 29-34. doi: 10.11648/j.sjee.20190702.12
Received: June 19, 2019; Accepted: July 18, 2019; Published: October 12, 2019
Abstract:
Most of the wind energy conversion systems are failing in many developing countries such as Nigeria due to poor and un-appropriate site selection. Ten years (2001-2010) daily average wind speed data measured at 10m height for Minna (9.6°N, 6.6°E and 251m) were obtained from Nigerian Meteorological Agency (NIMET) and the characteristics of the three small scale wind energy conversion systems with power rating of 1, 1.5 and 3.0 kW obtained from the manufacturers websites were used in this study for the performance evaluation of three selected wind energy conversion system (WECS). The performance of the selected WECS were compared using the capacity factors obtained for the turbines from the algorithms developed, that combine the daily average wind speed and standard deviation for the location with the selected turbines characteristics provided by the manufacturers. The annual energy output for the WECS were found to be 1.37MWh, 1.23MWh and 2.53MWh with corresponding capacity factor of 18.8%, 11.2% and 8.4% respectively from e3001 (1kW), Ge-Power System 1.5SL (1.5kW) and Gv-3kW (3.0 kW). The e30001 (1kW) was observed to performed better with capacity factor of 18.8% as against 11.2% and 8.4% for Ge-Power system 1.5SL (1.5kW) and Gv-3kW (3.0 kW) respectively for Minna location.Keywords:
Algorithm, Wind Speed, Energy, Capacity Factor and Levelised1. Introduction
Energy is one of the fundamental requirement of the world’s economy growth and development, combining energy with all other entities that are vital for economies are basis for any nation to develop. The quest to meet growing energy demand of the global population initiated numerous researches in a wide range of environmental application of renewable energy (RE) [1]. Energy is considered a prime agent in the generation of wealth, asignificant factor in economic development and the driving force of industrialization [2, 3]. Energy is one of the crucial inputs for socio-economic development; it exists in a pure form as electricity whose demand has grown considerably with larger proportion generated using fossil fuels, which causes serious environmental problems such as acid rain, air
pollution and climate changes thereby making current energy trends to be unsustainable thus necessitating a better balance between energy security, economic development, and protection of the environment. At the same time, wind power has become an important option for electricity generation among renewable sources of energies. Being environmentally friendly, it has been gaining more and more ground in recent years and can provide significant quantities of energy to support a country's needs [1, 4-6].
around the world have adopted policies to harness renewable energies such as wind and solar in order to reduce their dependency on non-renewable resources of energies [8]. Wind power is the use of air flow through wind turbines to mechanically power generators for electric power generation. Wind power as an alternative to burning fossil fuels, is plentiful renewable widely distributed, clean, produces no greenhouse gas emissions during operation, consumes no water, and uses little land [9].
Wind energy is currently one of the most economically viable renewable energy apart from hydropower, its usage versatility and ability to use it as a decentralized energy form make its applications possible in rural areas where it is technically and economically feasible in many parts of the globe. The major challenge to using wind as a source of electricity is that wind is intermittent, that is, it does not always blow when electricity is needed. However, wind power is one of the most promising and cost – effective renewable energy source [10]. The net effects on the environment are far less problematic than most other renewable energy sources. Currently, the wind sector stands out as one of the most promising RE source as it is not only inexhaustible but an available resources day and night that can provide significant quantities of energy to support the needs of any country.. Wind energy had over 238GW of installed capacity at the end of 2011 and is expected to play a crucial role in mitigating future greenhouse gas emissions [11].
Wind speed in Nigeria ranges from 1.4 - 3.0m/s in the southern areas and 4.0 - 5.12m/s in the extreme north at height of 10m. Wind speeds are generally weak in the southern part of the country except for the coastal regions and offshore location. Initial study has shown that total exploitable wind energy reserve at 10m height may vary from 8MWh/yr in Yola to 51MWh/yr in the mountainous areas of Jos Plateau and it is as high as 97MWh/yr in Sokoto [12]. In order to improve wind technologies, several studies have been carried out in the recent years. De Risi et al. [13] proposed a new cooling system for wind turbine generator, based on nanofluid as heat transfer fluid and the wind turbine tower as heat exchanger. This system is able to dissipate quickly waste heat from electric generator in the environment, increasing the overall efficiency of wind turbines. This fast development of wind technology, as well as energy market, has large implications on siting of wind farms. Actually, the first critical step towards harnessing wind energy is to estimate the wind resources of a site. In the last years, different authors have studied the wind speed and direction as well as the wind potential in several regions of the world.
Energy supply in Nigeria is a major problem for both large and small scale purposes. Highly centralized generation and distribution units have not been equally distributed thus becomes inadequate in meeting the economic needs of both urban and rural populace in Nigeria. With respect to this problem, solar and wind energy are some of the alternative sources of energy that can be exploited to meet some of the populace needs. It is therefore necessary to evaluate the wind regimes in the country and assess the potential of wind, for
the purpose of installing wind energy conversion system for the generation of electricity. To begin harvesting wind resources for power production involves therefore, the initial effort of resource assessment to ascertain its potential for power generation. Based on this, the northern part of Nigeria has been identified as one of region that possesses great potential for wind energy utilization for power generation because of the prevailing wind situation of the area [14].
Nigeria has a high population growth rate and is heavily dependent on oil and gas as her main source of revenue, which coupled with policy instability to expose the economy to global energy dynamics thereby, rendering the industry as one of the most inefficient in satisfying the needs of the populace [2]. Geographical information of the selected location is as shown in Table 1.
Table 1. Geographical Information of theSelected Location.
Zone Location Latitude Longitude Altitude
North Central Minna 9.6°N 6.6°E 251m
This paper investigate the wind speed patterns of Minna, Nigeria and develop an algorithm for the evaluation of wind energy using the characteristics of different wind energy conversion systems, in selected area.
2. Methodology
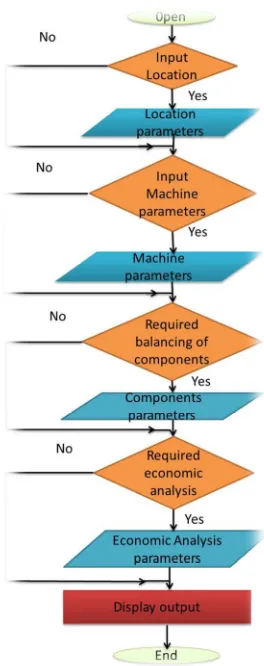
Performance evaluation of Wind Energy Conversion System (WECS) involves many processes such as: determination of meteorological data of the location, determination of probability density function parameters, extrapolation of machine parameters to hub height of the turbine, calculation of average power produced by the turbine, etc. In this work, the analysis was carried out by development of an algorithm using Microsoft Excel. Algorithm is a precise step-by-step plan for a computational procedure that begins with an input value and yields an output value in a finite number of steps. The methodology of this work is as shown in Figure 1 presented on a flowchart. A flowchart is a type of diagram that represents an algorithm, workflow, or process, showing the steps as boxes of various kinds, and their order by connecting them with arrows.
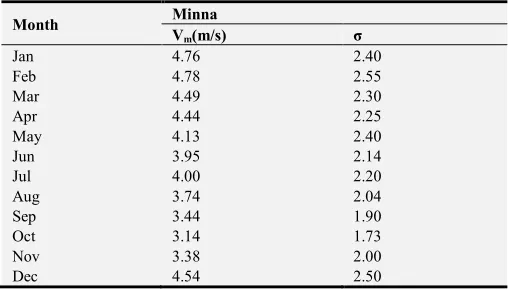
The daily average wind speed data for Minna location was obtained from Nigerian Meteorological Agency (NIMET) for a period of ten years (2001-2010), as presented in table 2.
Table 2. The mean wind speed and standard deviation for Minna.
Month Minna
Vm(m/s) σ
Jan 4.76 2.40
Feb 4.78 2.55
Mar 4.49 2.30
Apr 4.44 2.25
May 4.13 2.40
Jun 3.95 2.14
Jul 4.00 2.20
Aug 3.74 2.04
Sep 3.44 1.90
Oct 3.14 1.73
Nov 3.38 2.00
Dec 4.54 2.50
From the table, it can be seen that the average wind speed is highest in the months of February and least in the month of October with corresponding standard deviation of 2.55 and 1.73 respectively, indicating windier and less wind in the month of February and October respectively.
The required characteristics of the selected wind turbine (Rated power, Cut-in speed, Rated speed, Cut-out speed and hub height) to be evaluated were obtained from their manufacturers’ respective websites. In this work, three different models of small scale turbines were considered. Their characteristics are as shown in Table 3.
Table 3. Performance Parameters of Selected Turbines.
Model No. E3001
1kW
Ge power
System1.5SL (1.5kW)
GV-3kW (3kW)
Power Rating (kW) 1.0 1.5 3.0
Cut-in Speed (m/s) 2.5 3.0 2.0
Rated Speed (m/s) 10.5 11.8 12.0
Cut-out Speed (m/s) 25.0 25.0 25.0
Hub-Height (m) 15.0 10.0 8.0
2.1. Determination of Weibull Parameters
From the literature, there are various probability density functions which can be utilized to fit and describe the wind speed frequency over a period of time. Weibull probability
distribution function was chosen for this study because the Weibull probability distribution function is simple in nature and has an acceptable accuracy level with the measured data [1, 15, 16]. Which can be evaluated using the following equation:
( )
k c v k we
c
v
c
k
v
f
− −
=
1 (1)Where, fw
( )
v ,v
,k
, andc
are the probabilitydistribution function of wind speed, the wind speed, the shape and the scale parameters respectively. The shape parameter is dimensionless while the scale parameter has dimension of velocity. The mean wind speed and standard deviation can equally be express in terms of Weibull distribution function as reported by Mostafaeipour et al.. [16] using:
= = Γ 1 + 1/ (2)
= Γ 1 + 2/ − Γ 1 + 1/ (3)
There are various methods for the evaluations of Weibull parameters k and c ; which included Least Square Method (LSQM), Method of Moments (MOM), Standard Deviation Method (STDM), Maximum Likelihood Estimation Method (MLEM), Power Density Method (PDM) and Equivalent Energy Method (EEM) [17].
The values of shape and scale parameters can be computed using standard deviation method as [16-19]:
= . "# 1 ≤ ≤ 10 (4)
=& ' /( (5)
Based on the method of moment, the shape and scale parameters can be determined as [16], [20]:
= ) .*"+,
-. /
. *"0
(6)
= . ",' ." #5(1.22341.36788 (7)
Where , and Γ 9 are average wind speed, standard deviation and gamma function.
However, for this study the standard deviation method was used and therefore the monthly and annual values of the parameters were computed using equation (4) and (5).
2.2. Extrapolation of Wind Speed and Weibull Parameters to Hub Height
scale parameter :and wind speed : at the desired height ;< are related to the shape parameter = and scale parameter = at measurement height of 10>as [3, 15-16, 21-22]:
: ? 1 0.088 ln ;=⁄10 E 1 0.088 ln ;<⁄ ⁄10 (8)
: ;</;= F (9)
: ;</;= F (10)
Where G is the power law exponent (coefficient) and is defined by:
G 0.37 0.088JK ⁄ 1 0.088 ln ; 10⁄ (11)
2.3. Average Power Output and Capacity Factor
The actual power performance of wind turbine can be described by three speed parameters: cut in speed L; rated (nominal) speed M; and cut out (foil) speed, N. The output power operation pattern of a pitch regulated wind turbine is as shown in Figure 2 [23]:
Figure 2. A Typical Power Curve of a Pitch Regulated Wind Turbine.
As shown in Figure 2, the turbine would not produce any power in region 1, 0 L , in region 2 L M the turbine power output will be expected to increase with increase in wind energy speed, however at region 3
PM NQthe turbine will produce rated power. The power output for the locations based on the machines was determined using.
R=ST RUVWU
X YZZ [ UX Y\Z [ Y\
Z [ YZ
Z
[ ]
Y^ Z
[
_ (12)
Due to wind speed variability, a wind turbine rarely operates at its rated output, therefore the capacity factor (CF)
is commonly used to estimate its average energy production which in turn can be used for the economic appraisal of wind power projects and for the ranking of potential sites. It is given by according to Mathew [23] as;
`N aa^bcde (13)
For a period of one year, the CF can be calculated as [6]:
` <UfgSMUhUiUMjklM=hSLUhmiT:UkUfM n:VfTmij=NT:UTSMomiU n p"+# : (14)
Monthly average energy produced, qfrU< is given by:
qfrU< RfrUp st t uvw xK y;] >tKy; p 24 ;t{|w }]| uv (15) To be cost effective the capacity factor should lie
between0.25 $ `N$ 0.4; capacity factor `N greater than
0.4 indicates strong interaction between the wind turbine and the environment [3].
3. Results and Discussion
3.1. Extrapolated Wind Speed and Weibull Parameters at Turbine Hub Height
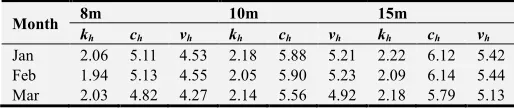
Table 4 depict the values of the extrapolated mean wind speed, Weibull shape and scale parameter at turbine hub heights for the locations.
Table 4. Extrapolated speed, Weibull shape and scale parameter at machine hub height for Minna.
Month 8m 10m 15m
kh ch vh kh ch vh kh ch vh
Jan 2.06 5.11 4.53 2.18 5.88 5.21 2.22 6.12 5.42 Feb 1.94 5.13 4.55 2.05 5.90 5.23 2.09 6.14 5.44 Mar 2.03 4.82 4.27 2.14 5.56 4.92 2.18 5.79 5.13
Month 8m 10m 15m
kh ch vh kh ch vh kh ch vh
Apr 2.05 4.76 4.22 2.17 5.50 4.87 2.21 5.73 5.08 May 1.77 4.41 3.92 1.87 5.11 4.54 1.90 5.33 4.73 Jun 1.91 4.22 3.75 2.02 4.91 4.35 2.05 5.12 4.54 Jul 1.88 4.28 3.80 1.99 4.96 4.40 2.02 5.18 4.59 Aug 1.89 3.99 3.54 2.00 4.65 4.12 2.04 4.86 4.31 Sep 1.87 3.67 3.26 1.98 4.29 3.80 2.01 4.49 3.98 Oct 1.87 3.34 2.97 1.98 3.93 3.48 2.01 4.12 3.65 Nov 1.73 3.59 3.20 1.83 4.21 3.74 1.86 4.40 3.91 Dec 1.87 4.87 4.32 1.98 5.61 4.97 2.02 5.84 5.18
3.2. Annual Power Output
designed to operate at different hub heights. In this study, however, the hub heights for each model were used. The characteristic properties of these wind turbines are given in Table 3. The annual power and energy output were computed using equations (12) and (15) respectively. As expected, the monthly power output follows the same trend as the mean wind speed. It is observed that the annual power and energy output ranges from 0.08kW in October for Ge PS 1.5kW to 0.50 kW in February for Gv-3kW-3kW, while the total energy ranges from 78.17kWh for Ge Ps 1.5SL to 341.70 kW for Gv-3.0kW for same period. Figure 3 below is the monthly power output from the selected turbines, where it can be seen that Gv-3kW by far produced more power than the Ge Ps 1.5 SL and e3001 which can be seen to be inter marching one another. In all the three systems for all the months of the year.
February recorded the highest power output whilethe month of September recorded the least power output which is in accordance with the amount of wind speed available for each month of the year.
It can be observed from figure 3 and figure 4 that the accumulated power and energy output using Gv-3kW 3.0 kW (15m hub height) wind turbine ranges from 0.19 kW in the month of October to 0.50 kW for the month of February. Similar trend was also observed for the other wind turbines in the locations. However, the highest annual energy output was observed to be captured using Gv-3 kW of 350.52 MJh in month of December while the lowest was estimated to be 143.7 MJh with Ge 1,5SL 1.5kW. The annual energy output using e3001 model (with least rated power of 1kW) is higher than that of Ge power system (1.5kW) for the same location.
Figure 3. Monthly Power output from the selected WECS at Minna.
Figure 4. Monthly energy output of the selected WECS for Minna.
3.3. Capacity Factor of the Turbines
Table 5 presents the annual capacity factor for the three selected turbines in percentage (%), the maximum capacity factor is 18.8% with e3001 1kW and the minimum is 11.2% with Ge PS 1.5SL 1.5kW. Regardless of the month of the year, the e3001 1kW turbine has the highest value of capacity factor among all the three WECS considered. The capacity factors for the WECS are as presented below..
Table 5. Annual capacity factor of the selected wind turbines for all the locations.
Location E3001 1kW Ge PS 1.5SL GV-3kW
Minna Capacity factor (%)
18.8 11.2 12.0
4. Conclusion
From this analysis of the performance evaluation of selected WECS the following conclusion can be summarized as follows:
1.None of the WECS is adequate to operate at maximum efficiency at Minna location.
2.The highest monthly power output was obtained with Gv-3kW 3.0 kW in the month of February, while the lowest was using Ge PS 1.5SL 1.5kW in the month of October.
3.Based on capacity factor, e3001 1.0 kW wind turbine with rated power of 1.0 kW and cut-in wind speed of 2.50 m/s or wind turbines with similar designed characteristics will be best suited for Minna locations. 4.18.8% was computed as the highest capacity factor for
e3001 1kw in location while the lowest was calculated as 11.2% for Ge PS 1.5SL 1.5kW.
5.The capacity factors were generally lower than the recommended minimum value of 0.25 for effective performance. However, based on the analysis of the estimated capacity factor e3001 1kW wind turbine model will be the best choice followed by Gv-3kW 3.0kW with Ge PS 1,5SL 1.5kW as the least for Minna location.
References
[1] Ohunakin, O. S. (2011). Assessment of wind energy resources for electricity generation using WECS in North Central region, Nigeria. Renewable Sustainable Energy Rev. 15: 1968-76.
[2] Ohunakin, O. S. (2010). Energy Utilization and Renewable Energy Sources in Nigeria. Journal of Energy Applied Science. 5: 171-7.
[3] Ucar, A. and Balo, F. (2009). Evaluation of wind energy potential and electricity generation at six locations in Turkey. Appl Energy. 86: 1864–72.
[4] Ahmed, A. S. and Hanitsch, R. (2006). Evaluation of wind energy potential and electricity generation on the cost of Mediterranean Sea in Egypt. Renew Energy. 31, 183-202 [5] Keyhani, A., Gbasemi - Varnamkhasti, M., Khanali, M. and
Abbaszadeh R. (2010). An assessment of wind energy potential as a power generation source in the capital of Iran, Tehran. Energy. 35: 188-201.
[6] Ohunakin, O. S. (2011). Wind resources in North East geopolitical Zone, Nigeria: an assessment of the monthly and seasonal characteristics, Renewable sustainable energy rev. 15: 1977-87.
[7] Gokcek, M., Bayulken, A. and Bekdemir, S. (2007). Investigation off wind characteristics and wind energy potential in Kirklareli, Turkey. Renewable Energy. 3: 1739-52. [8] Chaparzadeh, F. R. (1999). Feasibility of applying wind turbine for achieving sustainable development. In: Proceedings of 2nd national conference of energy. Vol 2: Tehran, Iran; March1999. Available from: <http://www.irannec. com /conf8>.
[9] Fthenakis, V. and Kim, H. C. (2009). “Land use and electricity generation: A life-cycle analysis”. Renewable and Sustainable Energy Reviews. 13 (6-7): 1465. http://dx.doi.org/10.1016/j.rser.2008.09.017
[10] Ahmed A., Bello, A. A. and Habou, D. (2014). Analysis of Wind Energy Potentials in North East Nigeria. Journal of Energy and Natural Resources, Vol. 3 No. 4, 2014, pp. 46-40. http://dx.doi.org/10.11646/j.jenr.20140304.11.
[11] Idris, N. A.; Lamin, H. S.; Ladan, M. J. and Yusuf, B. H. (2012). Nigeria’s Wind Energy Potentials: the Path to a Diversified Electricity Generation-Mix. International Journal of Modern Engineering Research (IJMER), 2 (4), 2434-2437. [12] Energy Commission of Nigeria (2005). Renewable Energy
Master Plan (Kaduna: Shukrah Printers, 2005).
[13] De Risi, A., Milanese, M., Colangelo, G. and Laforgia, D. (2014). High efficiency nanofluid cooling system for wind turbines. Therm Sci. 18 (2): 543–54.
[14] Ajayi, O. O. (2009). Assessment of utilization of wind energy resources in Nigeria. Energy Policy. 37: 720–723.
[15] Adaramola, M. S., Paul, S. S. and Oyedepo, S. O. (2011). Assessment of electricity generation and energy cost of wind energy conversion systems in North-Central Nigeria. Energ. Convers. Manage, 52, 3363–3368.
[16] Mostafaeipour, A., Mohsen. J., Kasra, M. and Ahmad, S. (2014). An analysis of wind energy potential and economic evaluation in Zahedan, Iran. Renewable and Sustainable Energy Reviews 30: 641–650.
[17] Ohunakin, O. S., and Akinnawonu, O. O. (2011). Assessment of wind energy potential and the economics of wind power generation in Jos, Plateau State, Nigeria. Energy for Sustainable Development. doi: 10.1016/j.esd.2011.10.004 [18] Adaramola, M. S and Oyewola, O. M. (2011). On wind speed
pattern and energy potential in Nigeria. Energy Policy, 39, 2501–6.
[19] Ohunakin, O. S., M. S. Adaramola, and O. M. Oyewola (2011) Wind energy evaluation for electricity generation using WECS in seven selected locations in Nigeria. Applied Energy 88: 3197–3206.
[20] Gökçek, M. and Genç, M. S. (2009). Evaluation of electricity generation and energy cost of wind energy conversion systems (WECSs) in central Turkey. Applied Energy. 86: 2731-9. [21] Diaf, S. and Notton, G. (2013). Technical and Economic
Analysis of Large-Scale Wind Energy Conversion Systems in Algeria. Renewable and Sustainable Energy Reviews 19: 37– 51.
[22] Park, J. and Law, H. (2015). Layout optimization for maximizing wind farm power production using sequential convex programming. Applied energy. 151: 320-334.
[23] Mathew, S. (2006). Wind Energy: Fundamentals, Resource Analysis and Economics; Springer: Berlin/Heidelberg, Germany. p. 252.