International Journal of
Molecular Sciences
ISSN 1422-0067 www.mdpi.com/journal/ijms ArticleMitochondrial Optic Atrophy (OPA) 1 Processing Is Altered in
Response to Neonatal Hypoxic-Ischemic Brain Injury
Ana A. Baburamani 1,†, Chloe Hurling 1,†, Helen Stolp 1, Kristina Sobotka 2, Pierre Gressens 1,3,4,
Henrik Hagberg 1,2 and Claire Thornton 1,*
1 Centre for the Developing Brain, Division of Imaging Sciences and Biomedical Engineering,
King’s College London, St. Thomas’ Hospital, SE1 7EH London, UK;
E-Mails: [email protected] (A.A.B.); [email protected] (C.H.);
[email protected] (H.S.); [email protected] (P.G.); [email protected] (H.H.)
2 Perinatal Center, Institute for Clinical Sciences and Physiology & Neuroscience,
Sahlgrenska Academy, University of Gothenburg, 41685 Gothenburg, Sweden; E-Mail: [email protected]
3 Inserm, U 1141, 75019 Paris, France
4 University Paris Diderot, Sorbonne Paris Cité, UMRS 1141, 75019 Paris, France
† These authors contributed equally to this work.
* Author to whom correspondence should be addressed; E-Mail: [email protected]; Tel.: +44-020-7188-7118 (ext. 54387); Fax: +44-020-7188-9154.
Academic Editors: Jaime M. Ross and Giuseppe Coppotelli
Received: 25 May 2015 / Accepted: 11 September 2015 / Published: 17 September 2015
Int. J. Mol. Sci. 2015, 16 22510
Keywords: mitochondria; OPA1; Oma1; Yme1L; oxygen-glucose deprivation (OGD); hypoxia-ischaemia; neonatal brain injury
1. Introduction
Moderate to severe hypoxic-ischemic encephalopathy (HIE), caused by a lack of oxygen or blood flow to the brain around the time of birth, affects 1.5 in every 1000 live births in the UK and far more in the developing world [1–3]. The consequences for babies and parents affected by HIE are devastating; 15%–20% of infants will die in the postnatal period and a further 25% will develop severe and long-lasting neurological impairments [4].
In infants and in animal models of hypoxic-ischemic injury (HI) there is an initial depletion of ATP, phosphocreatine and glucose within the brain followed by a transient recovery to almost physiological levels [5]. However, a second, rapid energy failure facilitates the majority of cell death [6–8]. We and others have shown that HI triggers multiple signaling events such as NMDA/AMPA receptor activation, release of reactive oxygen species and increase in intracellular calcium [9–12]. In addition, cell death after neonatal brain injury is characterized morphologically by a mixed necrotic–necroptotic–apoptotic phenotype depending on time post injury and brain region [10,13,14]. However, data from our lab and others strongly suggest that the common thread linking these diverse mechanisms is mitochondrial dysfunction [15,16].
It is well established that in animal models of neonatal HI, mitochondrial respiration and calcium homeostasis are impaired [17–19]. More recently, it was determined that mitochondrial outer membrane permeabilization (MOMP) mediated mitochondrial dysfunction in rodent neonatal HI models [20]. In response to HI, the Bcl-2 family member Bax is activated and translocates to the mitochondria where it complexes and forms a pore with Bak allowing passage of cytochrome c and apoptosis inducing factor (AIF) into the cytosol. Once released AIF and cytochrome c initiate a cascade resulting in activation of caspases, degradation of DNA and ultimately cell death [21]. As such, genetic and pharmacological inhibition of Bax is protective from HI in immature brain [20,22,23]. In addition to Bax-mediated MOMP, mitochondrial ultrastructure is also altered in response to neonatal HI insult [10] and a wide range of mitochondrial morphologies are observed [13]. We therefore hypothesize that such environmental stress may alter mitochondrial dynamics, particularly in the proteins which regulate fission and fusion. Optic Atrophy 1 (OPA1), a dynamin-related guanosine triphosphatase protein, plays a pivotal role in conducting inner-membrane mitochondrial fusion and therefore regulates both mitochondrial cristae junction formation and fusion of distinct mitochondria [24–26]. Here we present data analyzing the effect of in vitro oxygen-glucose deprivation (OGD) and in vivo HI on the processing of OPA1.
2. Results
2.1. OGD in C17.2 Cells Alters Mitochondrial Function and Morphology
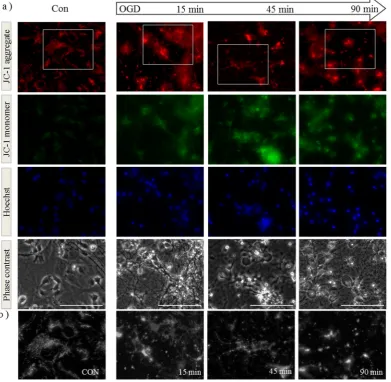
membrane potential in live cells throughout the insult using JC-1 dye. Aggregates of JC-1 accumulate in mitochondria in which the membrane potential is maintained, exhibiting red fluorescence, whereas the appearance of diffuse green JC-1 monomers throughout the cell indicates dissipation of membrane potential. Neurons were preloaded with JC-1 before exposure to OGD. Mitochondria were clearly visible in the processes of control cells and generally of uniform size (Figure 1a,b, Con). However after 90 min OGD, we observed an increase in green monomeric JC-1 suggesting impaired membrane potential and altered morphology with both mitochondrial aggregates and rounded puncta (Figure 1a,b, OGD). Similar findings were observed in a recent study of rat cortical neurons exposed to OGD [27], where control mitochondria were found to be tubular and OGD-exposed mitochondria rounded or poorly labelled. In order to quantify these changes, we performed time-lapse imaging on isolated neurons and calculated the changes in mitochondrial length over time. We found a significant decrease in the average mitochondrial length after 30 min of OGD (Figure 1c). After 90 min OGD we returned the cultures to growth medium and analyzed them at subsequent time points for the effect of the insult on mitochondrial health. We found that 24 h post insult, citrate synthase activity was significantly reduced indicating impaired TCA cycle function (Figure 1d). This suggests that neurons which survive the initial insult may subsequently exhibit impaired mitochondrial function.
Int. J. Mol. Sci. 2015, 16 22512
Figure 1. Oxygen-glucose deprivation (OGD) alters mitochondrial membrane potential, morphology and function in primary cortical neurons. (a) Primary mouse cortical neurons were loaded with JC-1 dye and Hoechst before exposure to OGD. Cells were imaged live before (Con) and at 15, 45 and 90 min during OGD. Both mitochondrial morphology (as observed in red, top row) and membrane potential (increased green signal, second row) are altered during exposure to OGD. Scale bar represents 100 µm; Figures are representative of three individual experiments: (b) Enlargement (3×) of regions defined by white boxes in (a). As the experiment progresses, mitochondria morphology appears to alter from tubular structures to round punctate or larger aggregations; (c) Primary neurons loaded with JC-1 were imaged every minute during OGD followed by analyses of mitochondrial length. Data shown are an average of 360 mitochondria per time point, and mitochondria from the first and last time points analyzed by student’s t-test in the panel below, *** p < 0.001; (d) Primary neurons were subjected to 90 min of OGD followed by up to 24 h incubation in normal growth medium. Lysates were assayed for citrate synthase activity at time points shown following the insult. Data is shown ± SD, n = 4–6 independent litters, determined by two-way ANOVA followed by a Bonferroni post-hoc test, ** p < 0.01 for interaction and treatment.
2.2. OPA1 Processing Is Altered after OGD
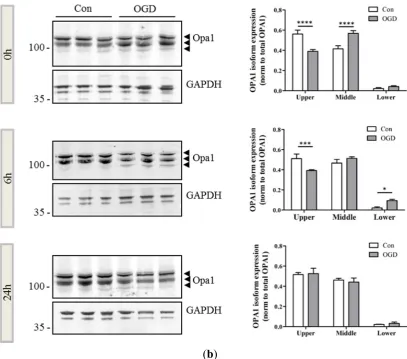
and 24 h post insult. There was a small decrease in the expression of OPA1 apparent at the 6 h timepoint (Figure 2b). Interestingly, OGD appeared to induce the generation of a smaller band and alter the distribution of remaining OPA1 immunoreactivity. There was a proportional shift towards expression of smaller OPA1 moieties most pronounced at 6 h after OGD, compared with control OPA1 expression. (Figure 2b, arrowheads).
(a)
Int. J. Mol. Sci. 2015, 16 22514
(b)
2.3. OGD Reduces Yme1L Protein Expression in Primary Neurons
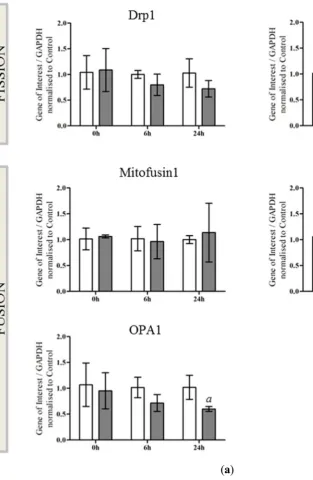
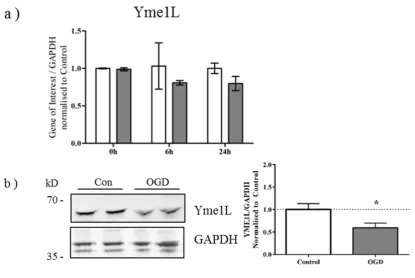
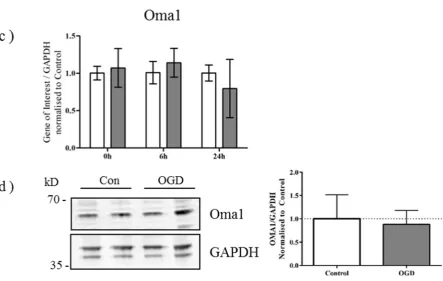
Alternative splicing of OPA1 generates eight isoforms which depending on variant, will contain S1 and S2 cleavage sites, or an S1 site alone [28]. Previous studies have demonstrated that cleavage at S2 by the intermembrane space AAA-protease Yme1L produces a balance of long and short OPA1 products, optimal for OPA1 function [24,29]. When mitochondrial membrane potential is lost, Oma1, a zinc-metalloprotease which resides on the inner membrane, cleaves OPA1 at the S1 site [30,31]. We therefore examined the expression of Yme1L and Oma1 in primary neurons exposed to OGD. Although gene expression of Yme1L was not altered significantly in response to OGD (Yme1L p = 0.0506; Figure 3a), there was a discernible decrease in Yme1L protein expression at the end of OGD (Figure 3b). Conversely, no changes were apparent for either the gene (Figure 3c) or protein expression (Figure 3d) of Oma1.
Int. J. Mol. Sci. 2015, 16 22516
Figure 3. Yme1L protein expression is reduced after OGD (a) mRNA generated from control and OGD-treated primary neurons was analyzed by qRT-PCR for changes in expression of Yme1L. Data shown ± SD, n = 3–4 independent litters; (b) Protein lysates were generated from primary neurons immediately following OGD and analyzed by western blot for expression of Yme1L. Equal protein loading was determined by GAPDH expression which was used for the quantification (right hand panel). Figure is representative of three individual litters, * p < 0.05 determined by students t-test; (c) Oma1 gene expression or (d) Oma1 protein expression was determined as above with GAPDH for equal loading. Data was analyzed as above. Figure is representative of three individual litters.
2.4. Alterations in OPA1 Processing Are Apparent in Vivo after HI
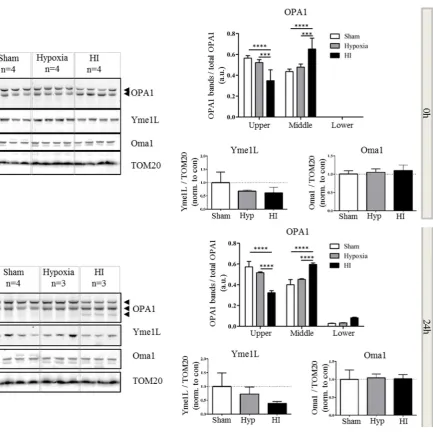
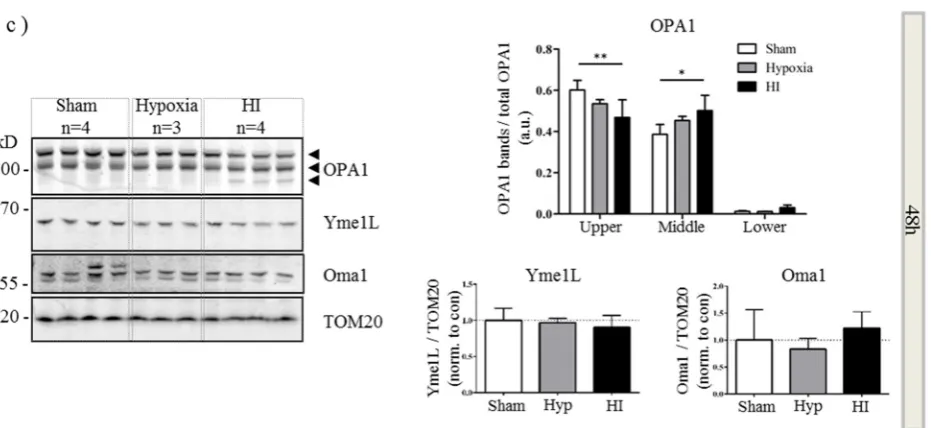
expression of the lower form (Figure 4b). In addition to changes in OPA1, there was a distinct trend towards a decrease in Yme1L expression at 0 (Figure 4a) and 24 h (Figure 4b) which appeared to be resolved by 48 h. Throughout the time course of the experiment, Oma1 expression did not appear to vary (Figure 4a–c). In summary, our data suggest that OGD in vitro and HI injury in vivo result in cleavage of OPA1 to lower molecular weight forms. This observation correlates with an OGD- or HI-mediated decrease in Yme1L expression.
Int. J. Mol. Sci. 2015, 16 22518
Figure 4. Aberrant processing of OPA1 in vivo. Mitochondrial fractions were generated from hypoxic-ischemic (HI), hypoxia alone or sham control mice. Proteins were resolved by SDS-PAGE and analyzed by western blot for OPA1, Yme1L and Oma1 at 0 (a), 24 (b) and 48 h (c) following HI. Tom20 was used as a loading control for mitochondria (bottom panel). Total OPA1 expression was determined by densitometry and OPA1 isoforms or cleavage products expressed as a proportion of that total. Arrowheads indicate alternate forms of OPA1. Mean data shown ± SD. OPA1 significance was determined by two-way ANOVA for band size and treatment followed by a Bonferroni post-hoc test * p < 0.05, ** p < 0.01, *** p < 0.001, **** p < 0.0001. YME1L and Oma1 data were analyzed with a one-way ANOVA.
3. Discussion
Dysregulation of energy metabolism is a common feature in a number of human diseases including diabetes, cardiovascular and neurodegenerative disorders [34–36]. It is therefore unsurprising the mitochondria are center stage in the development of neonatal brain injury, due to additional high energy demands of the immature brain as it develops [15], and protecting mitochondrial function represents a valid target for future therapeutic intervention. Here we present data suggesting that the homeostasis of inner mitochondrial membrane proteins is disrupted in response to OGD in vitro and HI in vivo and that alterations in protein function are due largely to post-translational modification.
Although we only identified small changes in OPA1 gene expression, our major finding is that OPA1 is rapidly cleaved to shorter forms in response to hypoxia-ischemia. Shortened forms of OPA1 are reported to occur as a result of environmental stress, resulting in fragmented mitochondria [37,38]. Furthermore, actively altering the balance of long (L-OPA1) and short (S-OPA1) forms may favor mitochondrial fission [39], agreeing with the appearance of small punctate mitochondria apparent during the OGD insult in primary neurons (Figure 1).
cleavage at OPA1 S1 site by Oma1 and generation of fusion-incompetent mitochondria [31]. Our results (Figure 1) and those of others [27,40] suggest that exposure of primary neurons to OGD induces a decrease in mitochondrial membrane potential coupled with changes in mitochondrial morphology (Figure 1, Con vs. OGD).
Concomitantly, post insult, we observed a decrease in Yme1L protein expression in vitro (Figure 3) and in vivo (Figure 4). It is well established that in animal models of HI and in vitro, the insult induces a rapid depletion of cellular ATP [8,33,41]. Yme1L activity is ATP-dependent and more recently, its expression was found to be reduced following oxidative stress [42]. These authors also identified Oma1 as an ATP-independent protease which regulated Yme1L expression; resistance to Oma1-mediated Yme1L degradation was conferred by ATP binding. Both our in vitro and our in vivo results are in line with these findings suggesting that loss of Yme1L may sensitize cells to oxidative stress through dysfunctional mitochondrial dynamics [43]. However, further work is required to determine whether disrupting the balance of Yme1L and Oma1 is critical in neonatal hypoxic-ischemic brain injury.
In the development of neonatal brain injury in response to HI insult, we and others have documented the induction of apoptosis resulting in cytochrome c release from permeabilized mitochondria [13,44–46]. However, the majority of cytochrome c is held within the cristae, relying on cristae reconfiguration to allow it access to move into the intermembrane space once apoptosis is induced. In addition to its role in fusion, OPA1 controls the integrity of the cristae [25] and inhibition of OPA1 leads to cristae disorganization [26]. Our data suggest the possibility that OPA1 processing may be an early but key step in the propagation of neuronal cell death induced by neonatal hypoxic-ischemic injury. Interestingly, during revision of our manuscript, Sanderson and colleagues identified release of cytochrome c and appearance of degraded OPA1 in the cytosol in response to OGD/reperfusion in primary neurons [47] providing further evidence for our hypothesis. Our future studies will therefore center on the roles of Yme1L and Oma1 in the regulation of OPA1 in order to highlight whether prevention of such cleavage is neuroprotective in neonatal hypoxic-ischemic injury.
4. Experimental Section
4.1. Research Ethics Statement
All animal use was in accordance with local rules (King’s College London, Animal Welfare and Ethical Review Board, London, UK) and with the regulations and guidance issued under the Animals (Scientific Procedures) Act (1986) covered by Home Office personal and project licenses.
4.2. Primary Cortical Neuron Preparation
C57/Bl6 pregnant mice (Charles Rivers, Margate, UK) at embryonic day 13.5–15.5 were killed by schedule 1 methods. Embryonic cerebral cortices were dissected and tissue from the same litter pooled. Primary cortical neurons were prepared as described previously [48], plated at a density of 2 × 10⁶ cells/6 cm plate and maintained in neurobasal medium (Life Technologies, Paisley, UK)
containing B27® (Life Technologies), L-Glutamine (Sigma, Gillingham, UK) and Streptomycin/
Int. J. Mol. Sci. 2015, 16 22520
4.3. Neonatal Hypoxia-Ischemia
C57/Bl6 mice (Charles River) at postnatal day 9 (P9) were subjected to unilateral hypoxia-ischemia, essentially according to the Rice–Vannucci model that results in a focal ischemic injury allowing for comparison between an HI (ipsilateral) and hypoxia alone (contralateral) hemisphere [32,33]. Briefly, mice were anesthetized with isoflurane (4.5% for induction and 2% for maintenance) in a mixture of nitrous oxide and oxygen (1:1), with the duration of anesthesia being <5 min per pup. The left common carotid artery was isolated and ligated. Pups recovered for 1–2 h in the parent cage. Litters were placed in a chamber with a humidified hypoxic gas mixture (10% oxygen in nitrogen, 36 °C) for 75 min. Sham control mice were not subjected to surgery or hypoxic chamber. After hypoxic exposure, pups were returned to their biological dams until the conclusion of the experiment. Both females and males pups were used and treatment groups contained pups from at least 3 independent litters.
4.4. Oxygen-Glucose Deprivation (OGD) of Primary Neurons
Primary neurons were cultured for a minimum of 6 days (DIV6) prior to treatment then loaded with JC-1 (5 µM; Life Technologies) and Hoechst (10 µg/mL; Sigma) for 30 min, 37 °C, 5% CO2. Growth
medium was replaced with de-gassed, glucose-free, Neurobasal-A medium (Life Technologies) and culture plates mounted on the EVOS/Chamlide microscope (Life Technologies) where they were maintained at 37 °C in a 95% N2/5% CO2 environment for the duration of the OGD. Following OGD,
medium was replaced with standard Neurobasal medium (containing additions described above) and cultures returned to 5% CO2 incubation. For control plates, medium was replaced with standard
Neurobasal media at the start of the OGD plates and replaced again with media after 90 min. Cells were collected at 0, 6 or 24 h following treatment.
4.5. MTT Assay
Primary cortical neurons were assayed for mitochondrial reductase activity using the MTT (3-(4,5-Dimethylthiazol-2-yl-)-2,5-diphenyl-2H-tetrazolium bromide; Sigma) assay as described previously [49].
4.6. Citrate Synthase Assay
4.7. qRT-PCR
RNA was harvested using the Direct-zol RNA MiniPrep kit (Zymo Research, through Cambridge Biosciences, Cambridge UK) as per manufacturer’s instructions. Total RNA (100 ng) was analysed using Taqman gene expression assays and RNA-to-CT kit (Life Technologies) on a StepOneplus Cycler (Life Technologies). Data were normalized to the expression of GAPDH and to controls for each time point using the 2−ΔΔCt method [50]. The following primer pairs were used: GAPDH (Mm99999915),
DRP1 (Dmn1; Mm01342903), Fis1 (Mm00481580), Mitofusin1 (Mm00612599), Mitofusin2 (Mm00500120), OPA1 (Mm01349707), Oma1 (Mm01260328) and Yme1L (Mm00496843) from Life Technologies.
4.8. Subcellular Fractionation
For preparation of mitochondrial fractions, mice were sacrificed at 0, 24 and 48 h post HI and brains rapidly dissected into ice-cold subcellular fractionation buffer (250 mM sucrose, 20 mM HEPES pH 7.4, 10 mM KCL, 1.5 mM MgCl2, 1 mM EDTA, 1 mM EGTA, 1 mM DTT, 1× protease inhibitor cocktail).
Samples were homogenized in a 2 mL dounce homogenizer on ice, passed through a 27 G needle and incubated on ice for 20 min. The suspension was centrifuged (720× g, 5 min) to remove the nuclear fraction and any unbroken cells. The resulting supernatant was centrifuged (15,000× g, 15 min) to obtain a mitochondrial pellet and a cytosolic supernatant.
4.9. Western Blot
For protein analysis primary neurons were lysed in HEPES buffer A (50 mM HEPES (pH 7.5), 50 mM sodium fluoride, 5 mM sodium pyrophosphate, 1 mM EDTA, +1× protease inhibitors (Sigma)) containing 1% (v/v) Triton X-100 (Sigma). Protein from cell lysates (50 µg) and mitochondrial fractions from brain lysates (30 µg) were resolved on 4%–12% gel (w/v) NuPAGE BisTris gels in MOPs buffer (ThermoFisher Scientific, Hemel Hempstead, UK) and transferred to polyvinylidene fluoride membrane (PVDF, Millipore, Beeston, UK) in NuPAGE transfer buffer (Life Technologies). Membranes were blocked in 5% skim-milk in Tris-buffered saline with 0.1% Tween 20 (TBS-T) and incubated overnight with the following antibodies: anti-mouse OPA1 (1:1000, Cat# 612606, BD Biosciences, Oxford, UK), anti-rabbit YME1 (1:1000, Cat# 11510-1-AP, ProteinTech, Manchester, UK), anti-rabbit OMA1 (for primary neurons; 1:1000, Cat# NBP1-56970, Novusbio, UK and for mitochondrial fractions from brain lysates; 1:750, Cat# 17116-1-AP, ProteinTech), anti-mouse GAPDH (1:2000, Cat# G8795 Sigma) and for mitochondrial fractions Tom20 (1:750, Cat# sc-11415, Santa Cruz Biotechnology, Wembley, UK). Secondary antibodies: Li-cor IRDye Goat anti-rabbit 800 or Goat anti-mouse 680 secondary antibodies were used at 1:10,000 and incubated for 2 h at room temperature. Membranes were imaged on a Li-Cor Odyssey Infrared Imaging System (Li-Cor Imaging Biotechnology UK Ltd., Cambridge, UK) using the manufacturer’s Image Studio software for band quantification.
4.10. Data Analysis
Int. J. Mol. Sci. 2015, 16 22522
(segmentation and quantification of subcellular shapes) software, part of the Mosaic toolkit in Image J [51]. All statistical analyses were performed using GraphPad Prism 6 Software (GraphPad Software, San Diego, CA, USA). All data were assessed for normality. Data was assessed either by a Student’s t-test or for multiple conditions, with a two-way ANOVA. If significant, a Bonferroni post-hoc analysis was conducted. Analyses used are detailed in table and figure captions. * p < 0.05, ** p < 0.01, *** p < 0.001, **** p < 0.0001.
5. Conclusions
We have determined that in primary neurons, mitochondrial membrane potential, morphology and function are impaired in response to OGD. Furthermore, we present the first data suggesting that in a mouse model of neonatal HI, the expression of mitochondrial shaping proteins, such as OPA1 and Yme1L, are altered; in vitro and in vivo, OPA1 is cleaved to shorter forms and Yme1L expression is reduced. Further studies are required to determine the molecular pathways regulating these events. Acknowledgments
We gratefully acknowledge the support of the Department of Perinatal Imaging and Health and financial support from Wellcome Trust (WT094823), the Medical Research Council, Action Medical Research, Swedish Medical Research Council (VR 2012-3500), Brain Foundation (HH), Ahlen Foundation (HH), ALF-GBG (426401), ERA-net (EU;VR 529-2014-7551) and the Leducq Foundation (DSRRP34404) to enable this study to be completed. CH was supported by the King’s Bioscience Institute and the Guy’s and St Thomas’ Charity Prize PhD Programme in Biomedical and Translational Science. In addition, the authors acknowledge financial support from the Department of Health via the National Institute for Health Research (NIHR) comprehensive Biomedical Research Centre Award to Guy’s & St Thomas’ NHS Foundation Trust in partnership with King’s College London and King’s College Hospital NHS Foundation Trust.
Author Contributions
Claire Thornton conceived and designed the experiments; Ana A. Baburamani, Chloe Hurling and Claire Thornton performed the experiments; Ana A. Baburamani, Chloe Hurling, Helen Stolp, Kristina Sobotka, Pierre Gressens and Henrik Hagberg analyzed the data; Helen Stolp contributed reagents/materials/analysis tools; Ana A. Baburamani, Chloe Hurling, Helen Stolp, Kristina Sobotka, Pierre Gressens and Henrik Hagbergcontributed to the preparation of the manuscript.
Conflicts of Interest
The authors declare no conflict of interest. References
2. Smith, J.; Wells, L.; Dodd, K. The continuing fall in incidence of hypoxic-ischaemic encephalopathy in term infants. BJOG 2000, 107, 461–466.
3. Lawn, J.E.; Bahl, R.; Bergstrom, S.; Bhutta, Z.A.; Darmstadt, G.L.; Ellis, M.; English, M.; Kurinczuk, J.J.; Lee, A.C.; Merialdi, M.; et al. Setting research priorities to reduce almost one million deaths from birth asphyxia by 2015. PLoS Med. 2011, 8, e1000389.
4. Vannucci, R.C.; Perlman, J.M. Interventions for perinatal hypoxic-ischemic encephalopathy. Pediatrics 1997, 100, 1004–1014.
5. Azzopardi, D.; Wyatt, J.S.; Cady, E.B.; Delpy, D.T.; Baudin, J.; Stewart, A.L.; Hope, P.L.; Hamilton, P.A.; Reynolds, E.O. Prognosis of newborn infants with hypoxic-ischemic brain injury assessed by phosphorus magnetic resonance spectroscopy. Pediatr. Res. 1989, 25, 445–451. 6. Blumberg, R.M.; Cady, E.B.; Wigglesworth, J.S.; McKenzie, J.E.; Edwards, A.D. Relation between
delayed impairment of cerebral energy metabolism and infarction following transient focal hypoxia-ischaemia in the developing brain. Exp. Brain Res. 1997, 113, 130–137.
7. Gilland, E.; Bona, E.; Hagberg, H. Temporal changes of regional glucose use, blood flow, and microtubule-associated protein 2 immunostaining after hypoxia-ischemia in the immature rat brain. J. Cereb. Blood Flow Metab. 1998, 18, 222–228.
8. Lorek, A.; Takei, Y.; Cady, E.B.; Wyatt, J.S.; Penrice, J.; Edwards, A.D.; Peebles, D.; Wylezinska, M.; Owen-Reece, H.; Kirkbride, V.; et al. Delayed (“secondary”) cerebral energy failure after acute hypoxia-ischemia in the newborn piglet: Continuous 48-hour studies by phosphorus magnetic resonance spectroscopy. Pediatr. Res. 1994, 36, 699–706.
9. Hagberg, H.; Thornberg, E.; Blennow, M.; Kjellmer, I.; Lagercrantz, H.; Thiringer, K.; Hamberger, A.; Sandberg, M. Excitatory amino acids in the cerebrospinal fluid of asphyxiated infants: Relationship to hypoxic-ischemic encephalopathy. Acta Paediatr. 1993, 82, 925–929.
10. Puka-Sundvall, M.; Gajkowska, B.; Cholewinski, M.; Blomgren, K.; Lazarewicz, J.W.; Hagberg, H. Subcellular distribution of calcium and ultrastructural changes after cerebral hypoxia-ischemia in immature rats. Brain Res. Dev. Brain Res. 2000, 125, 31–41.
11. Van den Tweel, E.R.; Nijboer, C.; Kavelaars, A.; Heijnen, C.J.; Groenendaal, F.; van Bel, F. Expression of nitric oxide synthase isoforms and nitrotyrosine formation after hypoxia-ischemia in the neonatal rat brain. J. Neuroimmunol. 2005, 167, 64–71.
12. Wallin, C.; Puka-Sundvall, M.; Hagberg, H.; Weber, S.G.; Sandberg, M. Alterations in glutathione and amino acid concentrations after hypoxia-ischemia in the immature rat brain. Brain Res. Dev. Brain Res. 2000, 125, 51–60.
13. Northington, F.J.; Zelaya, M.E.; O’Riordan, D.P.; Blomgren, K.; Flock, D.L.; Hagberg, H.; Ferriero, D.M.; Martin, L.J. Failure to complete apoptosis following neonatal hypoxia-ischemia manifests as “continuum” phenotype of cell death and occurs with multiple manifestations of mitochondrial dysfunction in rodent forebrain. Neuroscience 2007, 149, 822–833.
14. Portera-Cailliau, C.; Price, D.L.; Martin, L.J. Excitotoxic neuronal death in the immature brain is an apoptosis-necrosis morphological continuum. J. Comp. Neurol. 1997, 378, 70–87.
Int. J. Mol. Sci. 2015, 16 22524
16. Thornton, C.; Rousset, C.I.; Kichev, A.; Miyakuni, Y.; Vontell, R.; Baburamani, A.A.; Fleiss, B.; Gressens, P.; Hagberg, H. Molecular mechanisms of neonatal brain injury. Neurol. Res. Int. 2012, 2012, doi:10.1155/2012/506320.
17. Gilland, E.; Puka-Sundvall, M.; Hillered, L.; Hagberg, H. Mitochondrial function and energy metabolism after hypoxia-ischemia in the immature rat brain: Involvement of NMDA-receptors. J. Cereb. Blood Flow Metab. 1998, 18, 297–304.
18. Puka-Sundvall, M.; Wallin, C.; Gilland, E.; Hallin, U.; Wang, X.; Sandberg, M.; Karlsson, J.; Blomgren, K.; Hagberg, H. Impairment of mitochondrial respiration after cerebral hypoxia-ischemia in immature rats: Relationship to activation of caspase-3 and neuronal injury. Brain Res. Dev. Brain Res. 2000, 125, 43–50.
19. Rosenberg, A.A.; Parks, J.K.; Murdaugh, E.; Parker, W.D., Jr. Mitochondrial function after asphyxia in newborn lambs. Stroke 1989, 20, 674–679.
20. Wang, X.; Carlsson, Y.; Basso, E.; Zhu, C.; Rousset, C.I.; Rasola, A.; Johansson, B.R.; Blomgren, K.; Mallard, C.; Bernardi, P.; et al. Developmental shift of cyclophilin D contribution to hypoxic-ischemic brain injury. J. Neurosci. 2009, 29, 2588–2596.
21. Zhu, C.; Wang, X.; Huang, Z.; Qiu, L.; Xu, F.; Vahsen, N.; Nilsson, M.; Eriksson, P.S.; Hagberg, H.; Culmsee, C.; et al. Apoptosis-inducing factor is a major contributor to neuronal loss induced by neonatal cerebral hypoxia-ischemia. Cell Death Differ. 2007, 14, 775–784.
22. Gibson, M.E.; Han, B.H.; Choi, J.; Knudson, C.M.; Korsmeyer, S.J.; Parsadanian, M.; Holtzman, D.M. BAX contributes to apoptotic-like death following neonatal hypoxia-ischemia: Evidence for distinct apoptosis pathways. Mol. Med. 2001, 7, 644–655.
23. Wang, X.; Han, W.; Du, X.; Zhu, C.; Carlsson, Y.; Mallard, C.; Jacotot, E.; Hagberg, H. Neuroprotective effect of Bax-inhibiting peptide on neonatal brain injury. Stroke 2010, 41, 2050–2055.
24. Song, Z.; Chen, H.; Fiket, M.; Alexander, C.; Chan, D.C. OPA1 processing controls mitochondrial fusion and is regulated by mRNA splicing, membrane potential, and Yme1L. J. Cell Biol. 2007, 178, 749–755.
25. Frezza, C.; Cipolat, S.; Martins de Brito, O.; Micaroni, M.; Beznoussenko, G.V.; Rudka, T.; Bartoli, D.; Polishuck, R.S.; Danial, N.N.; De Strooper, B.; et al. OPA1 controls apoptotic cristae remodeling independently from mitochondrial fusion. Cell 2006, 126, 177–189.
26. Olichon, A.; Baricault, L.; Gas, N.; Guillou, E.; Valette, A.; Belenguer, P.; Lenaers, G. Loss of OPA1 perturbates the mitochondrial inner membrane structure and integrity, leading to cytochrome c release and apoptosis. J. Biol. Chem. 2003, 278, 7743–7746.
27. Wappler, E.A.; Institoris, A.; Dutta, S.; Katakam, P.V.; Busija, D.W. Mitochondrial dynamics associated with oxygen-glucose deprivation in rat primary neuronal cultures. PLoS ONE 2013, 8, e63206.
28. Delettre, C.; Griffoin, J.M.; Kaplan, J.; Dollfus, H.; Lorenz, B.; Faivre, L.; Lenaers, G.; Belenguer, P.; Hamel, C.P. Mutation spectrum and splicing variants in the OPA1 gene. Hum. Genet. 2001, 109, 584–591.
30. Ehses, S.; Raschke, I.; Mancuso, G.; Bernacchia, A.; Geimer, S.; Tondera, D.; Martinou, J.C.; Westermann, B.; Rugarli, E.I.; Langer, T. Regulation of OPA1 processing and mitochondrial fusion by m-AAA protease isoenzymes and OMA1. J. Cell Biol. 2009, 187, 1023–1036.
31. Head, B.; Griparic, L.; Amiri, M.; Gandre-Babbe, S.; van der Bliek, A.M. Inducible proteolytic inactivation of OPA1 mediated by the OMA1 protease in mammalian cells. J. Cell Biol. 2009, 187, 959–966.
32. Rice, J.E., 3rd; Vannucci, R.C.; Brierley, J.B. The influence of immaturity on hypoxic-ischemic brain damage in the rat. Ann. Neurol. 1981, 9, 131–141.
33. Vannucci, R.C.; Vannucci, S.J. A model of perinatal hypoxic-ischemic brain damage. Ann. N. Y. Acad. Sci. 1997, 835, 234–249.
34. Biala, A.K.; Dhingra, R.; Kirshenbaum, L.A. Mitochondrial dynamics: Orchestrating the journey to advanced age. J. Mol. Cell. Cardiol. 2015, 83, 37–43.
35. Lin, M.T.; Beal, M.F. Mitochondrial dysfunction and oxidative stress in neurodegenerative diseases. Nature 2006, 443, 787–795.
36. Supale, S.; Li, N.; Brun, T.; Maechler, P. Mitochondrial dysfunction in pancreatic β cells. Trends Endocrinol. Metab. 2012, 23, 477–487.
37. Duvezin-Caubet, S.; Jagasia, R.; Wagener, J.; Hofmann, S.; Trifunovic, A.; Hansson, A.; Chomyn, A.; Bauer, M.F.; Attardi, G.; Larsson, N.G.; et al. Proteolytic processing of OPA1 links mitochondrial dysfunction to alterations in mitochondrial morphology. J. Biol. Chem. 2006, 281, 37972–37979. 38. Ishihara, N.; Fujita, Y.; Oka, T.; Mihara, K. Regulation of mitochondrial morphology through
proteolytic cleavage of OPA1. EMBO J. 2006, 25, 2966–2977.
39. Anand, R.; Wai, T.; Baker, M.J.; Kladt, N.; Schauss, A.C.; Rugarli, E.; Langer, T. The i-AAA protease YME1L and OMA1 cleave OPA1 to balance mitochondrial fusion and fission. J. Cell Biol. 2014, 204, 919–929.
40. Iijima, T. Mitochondrial membrane potential and ischemic neuronal death. Neurosci. Res. 2006, 55, 234–243.
41. Azzopardi, D.; Wyatt, J.S.; Hamilton, P.A.; Cady, E.B.; Delpy, D.T.; Hope, P.L.; Reynolds, E.O. Phosphorus metabolites and intracellular pH in the brains of normal and small for gestational age infants investigated by magnetic resonance spectroscopy. Pediatr. Res. 1989, 25, 440–444.
42. Rainbolt, T.K.; Saunders, J.M.; Wiseman, R.L. YME1L degradation reduces mitochondrial proteolytic capacity during oxidative stress. EMBO Rep. 2015, 16, 97–106.
43. Stiburek, L.; Cesnekova, J.; Kostkova, O.; Fornuskova, D.; Vinsova, K.; Wenchich, L.; Houstek, J.; Zeman, J. YME1L controls the accumulation of respiratory chain subunits and is required for apoptotic resistance, cristae morphogenesis, and cell proliferation. Mol. Biol. Cell 2012, 23, 1010–1023.
44. Nijboer, C.H.; Heijnen, C.J.; van der Kooij, M.A.; Zijlstra, J.; van Velthoven, C.T.; Culmsee, C.; van Bel, F.; Hagberg, H.; Kavelaars, A. Targeting the p53 pathway to protect the neonatal ischemic brain. Ann. Neurol. 2011, 70, 255–264.
Int. J. Mol. Sci. 2015, 16 22526
46. Zhu, C.; Xu, F.; Fukuda, A.; Wang, X.; Fukuda, H.; Korhonen, L.; Hagberg, H.; Lannering, B.; Nilsson, M.; Eriksson, P.S.; et al. X chromosome-linked inhibitor of apoptosis protein reduces oxidative stress after cerebral irradiation or hypoxia-ischemia through up-regulation of mitochondrial antioxidants. Eur. J. Neurosci. 2007, 26, 3402–3410.
47. Sanderson, T.H.; Raghunayakula, S.; Kumar, R. Neuronal hypoxia disrupts mitochondrial fusion. Neuroscience 2015, 301, 71–78.
48. Thornton, C.; Bright, N.J.; Sastre, M.; Muckett, P.J.; Carling, D. AMP-activated protein kinase (AMPK) is a tau kinase, activated in response to amyloid beta-peptide exposure. Biochem. J. 2011, 434, 503–512.
49. Fleiss, B.; Chhor, V.; Rajudin, N.; Lebon, S.; Hagberg, H.; Gressens, P.; Thornton, C. The anti-inflammatory effects of the small molecule Pifithrin-μ on BV2 microglia. Dev. Neurosci. 2015, 37, 363–375.
50. Livak, K.J.; Schmittgen, T.D. Analysis of relative gene expression data using real-time quantitative PCR and the 2−ΔΔCt method. Methods 2001, 25, 402–408.
51. Rizk, A.; Paul, G.; Incardona, P.; Bugarski, M.; Mansouri, M.; Niemann, A.; Ziegler, U.; Berger, P.; Sbalzarini, I.F. Segmentation and quantification of subcellular structures in fluorescence microscopy images using Squassh. Nat. Protoc. 2014, 9, 586–596.