Communication
Comparison
of the properties of activated carbons
produced in a one-stage and a two-stage process
Davide Bergna1,2, Toni Varila 1,2, Henrik Romar 1 and Ulla Lassi 1,2
1 University of Oulu, Research Unit of Sustainable Chemistry, P.O. Box 3000, FI-90014 University of Oulu,
Finland
2 Kokkola University Consortium Chydenius, University of Jyvaskyla, Unit of Applied Chemistry,
Talonpojankatu 2B, FI-67100 Kokkola, Finland
Email: [email protected], [email protected], [email protected], [email protected] Correspondence: [email protected]; Tel.: +358-50-358-2939
Received: date; Accepted: date; Published: date
Abstract: Activated carbons (ACs) can be produced from biomass in a thermal process either
in a direct carbonization-activation process or first by carbonizing the biomass and later on activating the biochars into activated carbons. The properties of the ACs are dependent on the type of process used for production. In this study, the properties of activated carbons produced in a one-stage and a two-stage process are considered. Activated carbons were produced by physical activation of two types of starting materials, biochars produced from spruce and birch chips in a commercial carbonization plant and from the corresponding raw chips. The activated carbons produced were characterized regarding specific surfaces, pore volumes and pore size distributions. The unactivated biochars had some degree of surface area and some porosity. According to the results obtained, two slightly different types of activated carbons are produced depending if a one-stage or a two-stage carbonization and activation process is used. The ACs produced in the one-stage process had higher specific surface areas compared to the ones produced in a two-stage process.In addition, total pore volumes were higher in one-stage process but development of micropores is greater compared to two-stage process. There was no significant difference in total carbon content between one-stage and two-stage process.
Keywords: biomass; biochar; activation; activated carbon; thermal treatment, physical activation; porosity, specific surface areas
1. Introduction
Activated carbons are produced by thermal treatment or a combination of chemical and thermal treatment of carbon-rich sources like lignite or in the case of bio-mass based carbon from lignocellulosic materials. Typical bio-based raw materials used in the production are coconut shells, peat and wood chips or saw dust [1]. Most of the raw materials used in the production can be considered as waste fractions from industrial or agricultural production.
In the production process, the organic material is first carbonized at temperatures of 673 - 973 K, in this process most of the volatile components are released as pyrolysis
gases in combination with the breakdown products from cellulose, hemicellulose and lignin, as pyrolytic oil [2]. The product from the carbonization stage is a solid with high carbon content, typically in the range of 25-50% calculated on a mass basis, depending on the starting material and the process parameters used. The production and activation processes used for the production of biochars are described in the review paper of Thompson et al. and in the paper by Wang et al. [3,4].
In the second stage with physical activation, the carbons are activated to activated carbons using temperatures in the range of 973 - 1173 K in combination with activating agents, in the physical activation gases like water (steam) or carbon dioxide (CO2) are used as activators. Steam activation has an effect on the specific surface areas, pore volumes and pore size distributions and might increase the O-content [4]. An alternative activating method it is to impregnate the starting materials with activating agents like phosphoric acid, sodium or potassium hydroxide and zinc chloride. In the case of chemical activation temperatures around 773 - 873 K are used [5].
The carbonization and the activation stages can be performed in two different ways, in a two-stage process where the carbonization and activation stages are separated in time or in a one-stage process where carbonization and activation is performed sequentially in the same reactor. In the two-stage process the starting material is carbonized and the carbon formed is later on activated into activated carbons while the one-stage-process produces activated carbons as the only solid [6].
Characteristic properties for the activated carbons are high carbon content, high specific surface areas and a high level of porosity. The porous structures is divided according to the diameters of the pores into micro pores with a diameter < 2 nm, meso pores with diameters in the size of 2-50 nm and macro pores with diameters > 50 nm. The distribution of these pores, in combination with the specific surface area is dependent on the starting materials and the process parameters used [6-8]. According to our (so far unpublished) results the specific surface areas and the pore size distribution is highly dependent on the process used for the production.
The present study was performed in order to investigate the effects of different processes on the properties of the carbons. Two types of processes are used in the production of activated carbons. As starting materials in both cases are wooden chips from spruce and birch. In one process the chips are carbonized and carbons formed are later on activated by steam activation, in the other process the same chips are carbonized and activated in a one-stage sequence. The activated carbons prepared are characterized with respect to total yields, carbon contents, specific surface areas and pore size distributions.
2. Materials and Methods
Biomass used
mm and finally steam activated for 2 and 4 hours. Wooden chips of spruce and birch were dried, milled and sieved to particle sizes less than 2 mm. The sieved woods were carbonized and steam activated in a one-stage process using activation times of 2 and 4 hours.
About 10 grams of each sample were placed into a fixed-bed steel reactor inserted into a tubular oven. The samples inside the reactor were supported on both sides by quartz wool. For the carbon samples the temperature of the oven was raised from room-temperature to 1023 K in a 30 minute period followed by a slow ramp of 6 K/min to 1073 K. For the wood samples a 120 minutes ramp from room temperature to 1073 K was applied. At 1073 K the samples were steam activated by feeding water into the reactor at a speed of 30 cm3/hour for 2 or 4 hours. The reactor was flushed
with an inert gas, nitrogen, during the whole process in order to avoid oxidation of the samples. The carbons produced were characterized by a number of methods including yield, total carbon content (TC), specific surface areas and pore size distributions. The samples were named according to Table 1.
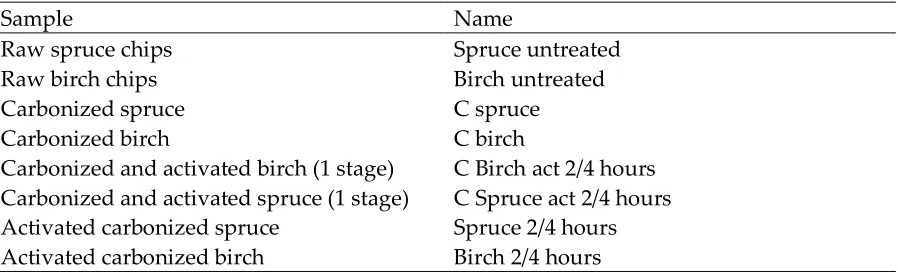
Table 1 Naming of the samples used (2/4 indicates activation times used, 2 or 4 hours)
Sample Name
Raw spruce chips Spruce untreated
Raw birch chips Birch untreated
Carbonized spruce C spruce
Carbonized birch C birch
Carbonized and activated birch (1 stage) C Birch act 2/4 hours Carbonized and activated spruce (1 stage) C Spruce act 2/4 hours
Activated carbonized spruce Spruce 2/4 hours
Activated carbonized birch Birch 2/4 hours
Calculation of yields
The yield for each sample was calculated as:
Yield = mass of carbon/mass of feed *100
For the pre-carbonized samples the total yield was calculated
Total yield = yield from activation * yield from carbonization process.
According to the producer of the carbons the yield from carbonization is 30% calculated on a dry mass basis.
The percentage of total carbon present in each sample, was measured using Skalar Primacs MCS instrument. Dried samples were weighted in quartz crucibles, combusted at 1373 K in a pure oxygen atmosphere and the formed CO2 was analyzed
by an IR analyzer. Carbon content values were obtained by reading the signal of IR analyzer from a calibration curve derived from known masses of a standard substance, citric acid. The total mass of carbon in each sample was calculated as a percent of the mass initially weighted.
Surface areas and pore size distributions
Specific surface area and pore distributions were determined from the adsorption-desorption isotherms using nitrogen as adsorbate. Determinations were performed with Micromeritics ASAP 2020 instrument. Portions of each sample (100-200 mg) were degassed at low pressure (2 µm Hg) and at temperature of 413 K for two hours in order to clean the surfaces and remove any gas adsorbed. Adsorption isotherms were obtained by immersing sample tubes in liquid nitrogen (77.15 K) to achieve constant temperature conditions. Gaseous nitrogen was added to the samples in small doses and the resulting isotherms were obtained. Specific surface areas and total pore volumes were calculated from adsorption isotherms according to the BET method [9] while the pore size distribution was calculated using the DFT (Density Functional Theory) [10] algorithm assuming slit-formed pores [11]. Total pore volumes were in the BET calculated at a p0/p ratio of 0.985 and in the case of the DTF
calulation as the total volumes of pores. The % distribution of pore volumes was calculated from the indivual volumes of µpores, mesopores and macropores. With the instrumental setup used, micropores down to 1.5 nm in diameter could be measured even if there might be some contribution from smaller pores. µpore areas and volumes were calculated by the t-plot algoritm and the surafe areas at low p0/p
rations were calculated as Langmuir surface areas.
3. Results and discussion
Yields from the activation and carbonization-activation processes
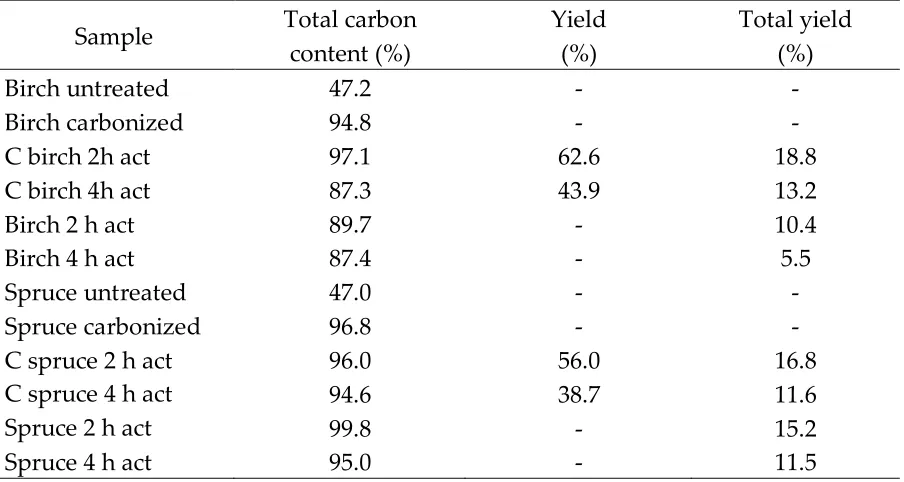
with steam reduces the total carbon content in both cases. Approximately 5-10% lower values were obtained for the spruce based sample depending on the length of the activation time. In the case of birch based samples, only 1-2 % lower carbon contents were obtained. Lower carbon values can be explained with the use of steam in the activation process. Steam partially oxidizes the carbon, creating the porous structure during the activation resulting in a higher ash content but a lower carbon content.
Table 2 Yields for the activation process. Total yield includes pre-carbonization and activation and are calculated using a 30 % yield in the industrial carbonization stage. Total carbon content for raw materials, carbonized and activated spruce and birch samples.
Sample
Total carbon
content (%)
Yield
(%)
Total yield
(%)
Birch untreated
47.2
-
-
Birch carbonized
94.8
-
-
C birch 2h act
97.1
62.6
18.8
C birch 4h act
87.3
43.9
13.2
Birch 2 h act
89.7
-
10.4
Birch 4 h act
87.4
-
5.5
Spruce untreated
47.0
-
-
Spruce carbonized
96.8
-
-
C spruce 2 h act
96.0
56.0
16.8
C spruce 4 h act
94.6
38.7
11.6
Spruce 2 h act
99.8
-
15.2
Spruce 4 h act
95.0
-
11.5
Specific surface areas pore volumes and pore size distributions
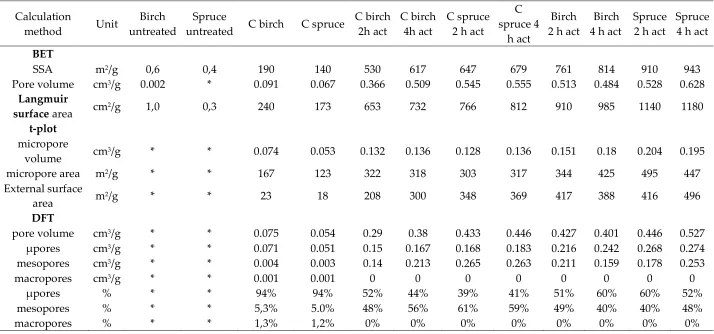
The two first columns in Table 3 represent the dried, milled and sieved chips of spruce and birch. Results show a very low specific surface areas and the corresponding pore volumes are close to or lower than measuring limit of the method. For the raw materials no porosity could be observed. The un-activated biochars proved to have some porosity and a specific surface area of 140 (spruce) and 180 m2/g
(birch). The morphology of the pores indicated mainly µpores.
According to the results presented in Table 3 there are differences regarding the specific surface areas for the ACs produced in a one-stage process and the ones produced in a two-stage process. All ACs produced in the two-stage process are lower in specific surface areas compared to the ones produced in a one-stage process, the difference is independent on the activation times used even if longer activation times in general produces higher specific surface-areas.
a two stage process compared to surface areas of 900-1200 m2/g for the ACs produced
in the one stage process.
Apparently there is no significant difference in the pore volumes of the ACs calculated from BET while the pore volumes calculated according to DFT are slightly higher for the ACs from the one-stage process. Pore volumes of micropores calculated using the t-plot algoritm are lower for the ACs produced in a one-stage process compared to the ones prepared in a two-stage process.
The external surface areas (t-plot calculations) are higher for the ACs produced in the one stage process. For samples, made in two-stage process, the external surface areas are in the range of 200-370 m2/g and for samples, made in one-stage process, the
external surface areas are in the range of 380-500 m2/g. This can indicate a higer
Table 3 Specific surface areas and pore-size distributions for the starting materials, carbonized biochars and the activated carbons.
Calculation
method Unit
Birch untreated
Spruce
untreated C birch C spruce
C birch 2h act
C birch 4h act
C spruce 2 h act
C spruce 4
h act
Birch 2 h act
Birch 4 h act
Spruce 2 h act
Spruce 4 h act
BET
SSA m2/g 0,6 0,4 190 140 530 617 647 679 761 814 910 943
Pore volume cm3/g 0.002 * 0.091 0.067 0.366 0.509 0.545 0.555 0.513 0.484 0.528 0.628
Langmuir
surface area cm2/g 1,0 0,3 240 173 653 732 766 812 910 985 1140 1180 t-plot
micropore
volume cm
3/g * * 0.074 0.053 0.132 0.136 0.128 0.136 0.151 0.18 0.204 0.195
micropore area m2/g * * 167 123 322 318 303 317 344 425 495 447
External surface
area m
2/g * * 23 18 208 300 348 369 417 388 416 496
DFT
pore volume cm3/g * * 0.075 0.054 0.29 0.38 0.433 0.446 0.427 0.401 0.446 0.527
µpores cm3/g * * 0.071 0.051 0.15 0.167 0.168 0.183 0.216 0.242 0.268 0.274
mesopores cm3/g * * 0.004 0.003 0.14 0.213 0.265 0.263 0.211 0.159 0.178 0.253
macropores cm3/g * * 0.001 0.001 0 0 0 0 0 0 0 0
µpores % * * 94% 94% 52% 44% 39% 41% 51% 60% 60% 52%
mesopores % * * 5,3% 5.0% 48% 56% 61% 59% 49% 40% 40% 48%
macropores % * * 1,3% 1,2% 0% 0% 0% 0% 0% 0% 0% 0%
4. Discussion
The results from the present study confirms our, so far unpublished, observations regarding activation of biochars and wood chips (saw dust) into ACs. According to the results, activated carbons produced in a one-stage and a two-stage process have different properties regarding specific surface areas, pore volumes and pore size distributions. The reasons for the differences is so far speculations only but can possibly be found in the carbonization reactions and the breakdown of the structures building up the wood.
Additionally, contact with air might change the properties of the surface of the biochars making them less sensitive to the activating agent. In the industrial production of the biochars a continuous process is used while the laboratory tests were performed in a fixed bed reactor in batch mode; the process parameters used might affect the properties of the ACs produced. Similar, so far unpublished, results have previously been obtained using biochars produced in batch mode indicating that there are structural effects in the biochars rather than the production process itself that makes the differences.
Further tests using chemical activation with different activating agents could be performed to find out if the differences are related to the properties of the precursors used, to the activating process itself or to the activating agent.
5. Conclusions
In this study a comparison between one-stage and two-stage process for activating carbon has been performed. According to the results there are some differences in the ACs produced in respective process. Regarding the total carbon content in the ACs produced there is no significant difference between the processes. The yield seems to be higher in the two-stage process. ACs with higher surface areas are produced in the one-stage carbon activation process. The total pore volume of one-stage process results to be in general slightly higher while the pore distribution does not present any particular difference.
Acknowledgments
The study was supported of and performed within the projects RENEPRO (H.R.) and Bioraff Botnia (T.V.). Financial support from the Central Ostrobothnian Culture Foundation (D.B.) is also acknowledged.
Author Contributions
leader of this research project (and research group), supervisor of PhD theses of Bergna and Varila and one contributor to the manuscript.
Conflicts of Interest: The authors declare no conflict of interest.
References
[1] M. Ahmedna, W.E. Marshall, R.M. Rao, Bioresour. Technol. 71 (2000) 113-123.
[2] M.J. Antal, M. Gronli, Ind. Eng. Chem. Res. 42 (2003) 1619-1640.
[3] K.T. Thompson, K.K. Shimabuku, J.P. Kearns, D.R.U. Knappe, R.S. Summers,
S.M. Cook, Environ. Sci. Technol. 50 (2016) 11253-11262.
[4] B. Wang, B. Gaob, J. Fang, Critical Reviews in Environmental Science and
Technology. (2018) 1-50.
[5] A. Mohammad-Khah, R. Ansari, International Journal of ChemTech Research. 1
(2009) 859-864.
[6] Ö Şahin, C. Saka, Bioresour. Technol. 136 (2013) 163-168.
[7] K. Yang, J. Peng, H. Xia, L. Zhang, C. Srinivasakannan, S. Guo, Journal of the
Taiwan Institute of Chemical Engineers. 41 (2010) 367-372.
[8] A.A. Ceyhan, Ö. Şahin, O. Baytar, C. Saka, J. Anal. Appl. Pyrolysis. 104 (2013)
378-383.
[9] S. Brunauer, P.H. Emmett, E. Teller, Journal of the American Chemical Society.
Volume 60 (1938) 309.
[10] W. Seaton, A. Quirke, Carbon. 27(6) (1989) 876-861.