Estimating the prevalence of chronic medical co-morbidities in the serious mentally ill in primary care.
A modelling framework
REETOODHWAJ BANARSEE
A thesis submitted in partial fulfilment of the requirements for the degree of
Doctor of Philosophy
University of West London
Abstract
An increasing body of evidence suggests that, in comparison to the general population, patients with severe mental illnesses such as schizophrenia or bipolar disorder have worse physical health and a far shorter life expectancy, due primarily to co-morbid chronic diseases.
The standardised mortality ratio for all forms of mental disorder is at least 1.5 and varies with the type and severity of the disorder. Whilst data on the prevalence of chronic diseases in primary care is available nationally, there is a lack of health intelligence on medical co-morbidities associated with chronic mental illnesses.
The aim of this PhD was to develop and validate epidemiological models for predicting expected prevalence of two major chronic medical conditions namely, coronary heart disease (CHD) and chronic obstructive pulmonary disease (COPD), on general practice data for people with concurrent serious mental illness (SMI) group.
Methods
The national model used multinomial regression to arrive at odds ratios based on a basket of variables including age, sex, ethnicity, rurality and smoking status. This study examines the possibility of using a similar multi-nomial logistic regression model in conjunction with other locally sensitive data to map the expected risk at very small area level (GP practice level) in order to derive the expected prevalence of the two medical conditions at local levels.
The model takes into account local variations with adjustments made to obtain a more accurate estimation. These were applied to the local SMI datasets (QOF data) to establish co-morbidity levels. Validation was carried out using external data, including population-based epidemiological data and case-finding initiatives. The co-morbidity estimation of SMI with each and both conditions was derived using Bayesian methodology.
Results
Medical co-morbidity prevalence associated with SMI was 2.5 fold greater than the general population. Case findings showed strong evidence of difference between expected and actual prevalence of the two diseases in the localities (p < 0.001).
Conclusion
The physical health of patients with severe mental illnesses is too often neglected, thus contributing to a compounded health disparity. The reintegration of psychiatry and medicine, with the ultimate goal of providing optimal services to this vulnerable patient population, represents the most important challenge for psychiatry today, requiring urgent and comprehensive action from health care commissioners.
The model predicts more accurately individual local cases in a given area, which a national model cannot because of the low size of population. By aggregating the local units of GP practices within an area and expressing the result as the relative probability of predicting number of cases is very practical for local commissioning as it enables better planning.
case-finding at practice level and improving and regulating the quality of primary health care. Comparisons with external data, in particular prevalence of disease detected by general practices, suggest that model predictions may be useful tools to help Health Commissioners.
i
TABLES OF CONTENTS
List of Tables iii
List of figures v
Abbreviations vi
Acknowledgements viii
Declarations ix 1 Introduction
1.1 Background 1
1.2 Aims and objectives 4
1.3 Outputs/Benefits 6
1.4 Study framework 7
2 Review of the literature
2.1 Serious mentally ill and co-morbidity 10 2.2 Commissioning for patients with SMI 30
2.3 Prevalence modelling 34
2.4 How does the model work? 36
2.5 Validation and confidence intervals 39 2.6 Projections and forecasting using models 43
2.7 Using prevalence models 44
2.8 Issues with Small Area Estimates (SAE) 45
2.9 Summary 49
3 Mental Health Needs Assessment
3.1 Background 50
3.2 Aims 52
3.3 Methodology of the needs assessment 53
3.4 Profile of Brent 59
3.5 Disease profile 66
3.6 Selective profile 67
3.7 Mental health profile 70
3.8 QOF Information 71
3.9 Ethnicity and mental health 77
3.10 Factors influencing need 81
3.11 Service provision in community services 82
3.12 Commissioning model 85
3.13 Limitation of the needs assessment 88
3.14 Conclusion 90
ii
5 Disease prevalence model development
5.1 Introduction 101
5.2 Coronary heart disease model 101
5.3 Estimating prevalence of co-morbidities 127
5.4 Summary 132
6 COPD
6.1 Introduction 134
6.2 Regional prevalence model 136
6.3 Developing the local model 148
6.4 Applying the model 150
6.5 Prevalence estimate of SMI with COPD 152
6.6 Multiple co-morbidity 158
7 Discussion
7.1 Validity of prevalence estimation 163 7.2 What is the best methodology ? 169 7.3 How useful are prevalence models? 171
7.4 Impact 173
7.5 What the study adds 174
7.6 Limitations 177
7.7 Personal account 180
7.8 Conclusion 182
References 187
Annex 1 225
Annex 2 226
Annex 3 228
Annex 4 229
iii
List of Tables
Table 1 Misclassification table of modelled results 41 Table 2 Percentage of community using mental
health services in Brent
78 Table 3 Percentage prevalence of IHD, by survey
year, age and gender
105 Table 4 Index of multiple deprivation banding 110 Table 5 Variables included in merged dataset 118 Table 6 Odds Ratios for LOCAL, model with only
locally available variables
120 Table 7 Respondents reporting doctor diagnosed
CHD by age band
119
Table 8 CHD prevalence by BMI category 120
Table 9 Odds ratios for CHD model 12
Table 10 CHD prevalence estimation – Kilburn location
125 Table 11 Prevalence estimates for CHD cases for all
the localities
125 Table 12 Chi-square tests to demonstrate the
association between the various localities
126 Table 13 SMI with CHD co-morbidity – Kilburn
locality (Actual vs Expected)
131 Table 14 Summary of the other 4 localities showing
SMI and CHD co-morbidity
132 Table 15 T-test for the mean difference of SMI with
CHD co –morbidity in the expected vs observed data
132
Table 16 Number and proportion of people estimated to have COPD by age group and gender in England (estimates from 2009)
139
Table 17 Risk factors for COPD and selection of variables for COPD model
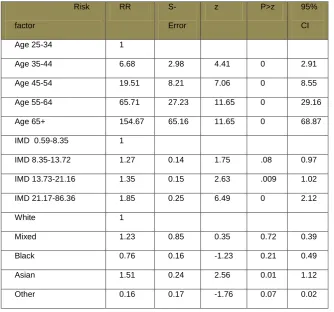
140 Table 18: Risk factor COPD – Age and locality 140
Table 19 Adjusted COPDS prevalence 151
Table 20 Adjusted prevalence for all localities 151 Table 21 SMI with COPD – Expected vs Registered) 155 Table 22 T-test for SMI and COPD (Kilburn) 156 Table 23 COPD predicted prevalence against
observed cases within the localities
157 Table 24 t-tests for difference within localities 157 Table 25 Estimated prevalence probability (and
numbers) for SMI with CHD and COPD for Kilburn locality
iv
Table 26 Estimation of SMI with CHD and COPD in all localities
161
List of Figures
Figure 1: London Borough of Brent and its localities 59
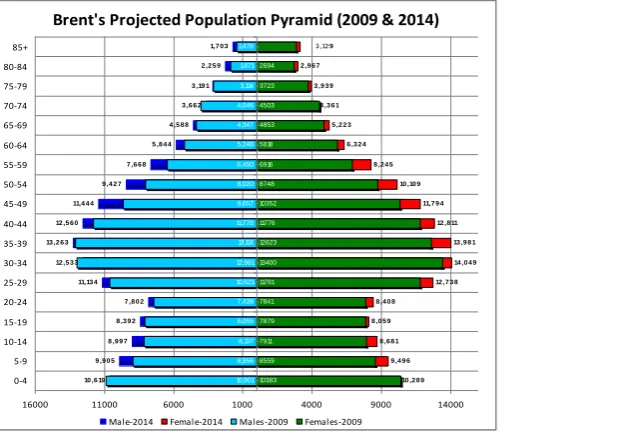
Figure 2: Brent projected population 60
Figure 3: Deprivation scores (IMD) by localities 63
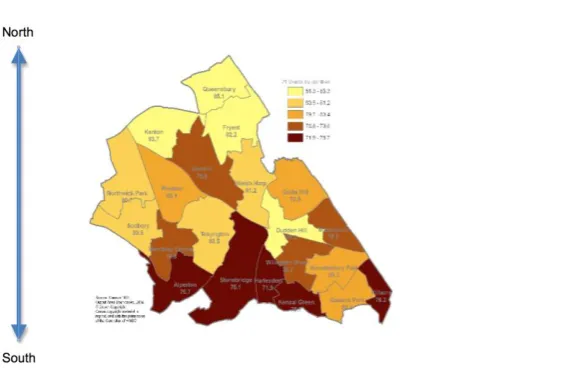
Figure 4: Life expectancy in the Borough. 64
Figure 5: Summary of the Borough’s health profile 65
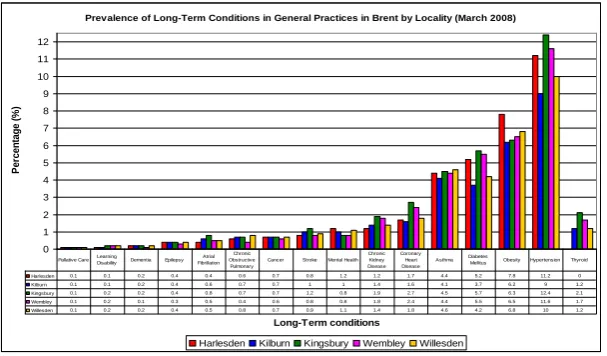
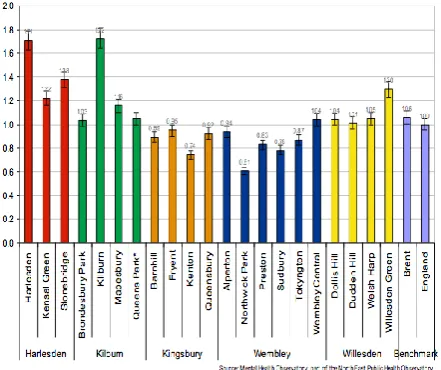
Figure 6: Reported prevalence of disease 69
Figure 7: An overview of SMI across localities 72
Figure 8: Mental health raw prevalence 73
Figure 9: QOF performance 74
Figure 10: QOF care plans 75
Figure 11: Use of services 76
Figure 12: Schematic diagram showing decision flow 86
Figure 13: Schema for service delivery 87
Figure14: Schematic diagram for algorithm 99
Figure 15: Prevalence of smoking in the UK 112
Figure 16: Auroc curve 123
Figure 17: Figure 18: Figure 19: Figure 20: Figure 21: Figure 22: Figure 23 Figure 24
Funnel chart for CHD
Schema showing prevalence SMI and CHD
SMI and COPD – Kilburn Density location
Funnel plot – COPD under reported cases
COPD predicted prevalence
A schema to illustrate the relationship between COPD and SMI
v
Table of abbreviations
ADQ/STA R
Average Daily Quantity of statins per standardised population
AF Atrial Fibrillation
AIC Akaike Information Criterion
APHO Association of Public Health Observatories AUROC/
AUC
Area Under Receiver Operating Characteristics curve
BMI Body Mass Index
BRFSS Behavioural Risk Factor Surveillance Survey BRHS British Regional Heart Study
BTS British Thoracic Society
CCC Concordance Correlation Coefficient CfH Connecting for Health
CHD Coronary Heart Disease CI confidence interval CKD Chronic kidney Disease
COPD chronic Obstructive pulmonary disease CQC Care Quality Commission
CVD Cardiovascular Disease DH Department of Health DsPH Directors of Public Health
ECG Electrocardiogram, Electrocardiographic FCE Finished Consultant Episode
FEV1 Forced expiratory Volume in 1 second FPG Fasting Plasma Glucose
FVC Forced Vital Capacity
GHQ General Health Questionnaire GP General Practitioner
GPES GP Extraction Service
GPRD General Practice Research Database HDL High Density Lipoprotein
HES Hospital Episode Statistics HRG Healthcare Resource Group HSfE Health Survey for England HUM High impact User Model
IC Information Centre for health and social care ICD International Classification of Disease ICER Incremental Cost Effectiveness Ratio IGT Impaired Glucose Tolerance
IHME Institute for Health Metrics and Evaluation IMD Index of Multiple Deprivation
IRR Incidence Rate Ratio JBS Joint British Societies
JSNA Joint Strategic Needs Assessment
LA Local Authority
vi LSOA Lower Super Output Area
MI Mental illness
MI Myocardial Infarction
MLM Multiple logistic regression modelling
MONICA Multinational MONItoring of trends and determinants in disease CArdiovascular
MSOA Medium Super Output Area
NatCen National Centre for Social Research
NHANES US National Health and Nutrition Examination Survey NHS National Health Service
NICE National Institute for Clinical Excellence NS-SeC National Statistics Socioeconomic Class NSTS National Strategic Tracing Service OLS Ordinary Least Squares
ONS Office for National Statistics
OR Odds Ratio
PAR Population Attributable Risk PARR Patients At Risk of Readmission
PCPH Department of Primary Care & Public Health PCSCs Primary care Sensitive Conditions
PCT Primary Care Trust
QOF Quality and Outcomes Framework RMSE Root Mean Squared Error
ROC Receiver 0perating Characteristics SBP/DBP Systolic/Diastolic Blood Pressure SE Synthetic Estimate(s), Estimation SVM Support Vector Machine
UK United Kingdom
UNAIDS Joint United Nations Programme on HIV/AIDS VIF Variance Inflation Factor
vii
Acknowledgements
In carrying out this research I have had a great deal of help and support from a number of colleagues.
Firstly, I acknowledge the support of the NHS Brent which supported me during the PhD programme. In particular I acknowledge the help Mike Sievewright who was closely involved in providing the local data which enabled GP practice level prevalence estimates to be produced and in making the data available.
I also acknowledge the financial support provided by the Applied Research Unit and WeLReN CIC which supported me in doing this study. The funding was used to process the local data and construct the practice level maps which are in this thesis. I also acknowledge the useful input of the NHS Brent that also provided the practice level population and demographics estimates which have been used in later research.
viii
her wise and unfailingly prompt advice over the last 4 years despite her extremely busy schedule.
Finally I also thank my wife Margaret for her support and understanding and my children, Anil and Ashwin for humouring me.
Declarations
The work presented in this thesis is my own and where any material could be construed as the work of others, it is fully cited and referenced and/or full acknowledgement is given.
1
1. Introduction
1.1 Background
The health needs of a population are derived from knowledge gained from the prevalence of diseases, i.e. the numbers of people suffering from different types of illnesses. However, looking only at the numbers of patients currently being treated for a disease does not show the true prevalence and its impact on the population’s health. At any given time there are many people who have
a disease but are unaware because they have not yet been diagnosed.
A robust and well-designed disease prevalence model can help health commissioners to assess the true needs of their community, calculate the level of services needed and invest in the appropriate level of resources for prevention, early detection, treatment and care. Prevalence models provide estimates of underlying prevalence derived from population statistics and scientific research on the risk factors for specific disease.
2
This issue is highlighted in Securing Good Health for the Whole Population, Wanless (2008), which noted that…” the information collected nationally is
often poor and there is no regular mechanism by which a PCT or LA can gather reliable information on its own population”. It proposes that in order to “improve understanding of prevalence of disease and to enable proactive
management of personal risk factors, much greater use needs to be made of primary care data systems”. Assessing the potential population benefit of a health intervention requires consideration of many elements including disease prevalence and population characteristics, effectiveness and cost (Department of Health 2007).
The challenge is already being taken up by “Informing Healthier Choices”, the Department of Health’s (DH) public health information and intelligence
strategy, (Department of Health 2007), which states that prevalence models will need to be generated for the common health problems which commissioners need to address. These will allow the current situation in an area or population group to be evaluated against an expected level of need.
3
health promotion and disease prevention. Relating health status, behaviour and disease
prevalence statistics for small areas like counties to these demographic and socioeconomic predictors provides a direct calibration of the indicators to the outcomes of interest. SAE methods are applied to cases where the number of area-specific sample observations is not large enough to produce reliable direct estimates (Druss 2001).
4
This study covers the research needed to address two main issues at the heart which face the commissioning process. The first is the need for an approach that enables a more sensitive prevalence estimation of chronic disease within small areas. The second is to develop a framework to estimate the presence of these illnesses within the serious mentally ill (SMI). The two problems are intrinsically linked. It is anticipated that this approach will enable local primary care commissioners to improve their local health intelligence, through better data management, which will enable more accurate local estimations.
The study focuses on two medical conditions, namely chronic obstructive disorders (COPD) and coronary heart disease (CHD) to make this case.
1.2 Aims and Objectives
Aims
There have been many studies that have researched the various epidemiological aspects of common conditions such as diabetes, HIV, CVD and others. To date no prevalence models have been developed for medical morbidities that co-occur with mental illnesses in small areas such as locality-based services.
Population prevalence is a method used to estimate and forecast the number of people in the population with a particular condition and monitor how that might change over time. This approach to population estimates allow us to:
5
Estimate the number and pattern of undiagnosed cases,
Plan and deliver services in a rational way,
Monitor performance.
The effectiveness of a prevalence model lies within its validity to provide robustness, reliability over time and fitness of purpose. The initial proposal contained the two broad aims of developing methods for prevalence estimation, of both disease and risk factors and their concurrent association with chronic mental illnesses. The research aim therefore proposed to gather and assess the fitness of general practice (GP) data, for the purpose of the prevalence estimation and to develop new methodologies, to adjust primary care data for sources of bias and to factor in estimates from mental health data to support healthcare commissioning.
Research Questions
How should the prevalence of medical co-morbidity of chronic diseases in SMI
be estimated?
How valid are the prevalence estimate models?
How do different chronic disease prevalence estimation methods compare in
terms of their validity?
What is the best available methodology, given the requirements for
6 Objectives
The objectives of the study were to:
Develop a methodology for local prevalence estimation and modelling of
chronic disorders for people with SMI, initially by extending logistic regression modelling to examine predictors of chronic obstructive pulmonary disease (COPD), coronary heart disease (CHD), stroke and hypertension using the HSfE datasets,
Developing an adjustment ratio to calculate the prevalence of SMI in the
estimated prevalence of the chronic diseases i.e. SMI as a subset of main data sets,
Determine new prevalence estimates and future projections at PCT and GP
level and support their use by PCTs (now Clinical Commissioning Groups (CCG)), practices and other agencies,
Explore the use of risk factor prevalence to model future disease prevalence
in relation to those people with serious mental illness,
Undertake a validation of one or more disease prevalence models, through
testing case-finding strategies at practice level, involving data from a West London primary care services,
Explore the links between registered and estimated disease prevalence and
7
1.3 Outputs / benefits
In the first instance, a methodology paper will be published on the physical disease prevalence model for the mentally ill. Later publications will include validation studies and case-finding strategy results.
Subsequent publications will explore the links between disease prevalence, health determinants and healthcare factors, ideally through practice-level analyses. Current person-based ONS survey data is available via the UK Data Archive. It was not clear at the outset whether the same level of access by researchers to person-based data would be permitted for other sources e.g. HES, but this would be an ideal eventual data linkage. The data and its implications for health policy will be presented to local health care commissioners and the wider network.
1.4 Study framework
The study was conducted over a number of phases:
Phase one (Chapter 1)
A study of the literature was undertaken to review two areas namely:
Serious Mental Illness, its definitions (clinical and operational) and how
services are commissioned and managed within community,
Explore the concept of “prevalence modelling” and its application in public
8 Phase two (Chapter 2)
Mental health needs assessment
A mental health needs assessment was undertaken to provide local information required for the modelling exercise, both from a broader community and local mental health delivery perspective. The exercise also assessed the fitness for purpose of general practice (GP) data for the prevalence estimation.
Phase three – Chapter 3
Definition of the methodological framework for study.
It is anticipated that a more sensitive prevalence estimation that was sensitive to variations and develop a “method” for a public health-driven primary care
mental health delivery service.
Phase four (Chapter 4/5)
Development and validation of the synthetic prevalence estimate model using
two chronic (medical) disorders as exemplars.
Using national datasets, the prevalence estimates of two chronic diseases were validated and then applied to local settings. Local health intelligence and information were linked to broader health determinants as explored in the needs assessment.
9
Phase five – Technique for estimating co-morbidity
Development of an adjustment factor for the prevalence estimate models
The rationale was to use an extrapolation (from national prevalence estimates) to determine relative co-morbidity in the SMI groups. The approach used Bayesian methodology to extract local estimates from existing datasets for co-morbidity estimation.
Stage six (Chapter 6)
Discussion and recommendations
The study was reviewed with considerations to its merit,
weaknesses, usefulness and application it has in public health
practice.
Ethics
10
2. Review of the literature
2.1. Serious mental illness and medical co-morbidity
Serious Mental Illness (SMI), although widely considered a severe long term condition, has been marked over time by a difficulty to formerly define. Even in 2013 there is still no nationally recognised definition in the UK. Traditionally, definitions have comprised of three elements - a medical condition of the brain; with significant functional impairment; over a significant period of time. This definition became summarised by ‘the three Ds’, diagnosis, disability and
duration. Goldman et al. formalised this definition in 1981, explicitly stating relevant diagnoses, the level of disability and required duration of illness. Later in the 1980s, McLean and Leibowitz (1989) continued the three Ds approach, adding emphasis of patients’ continued and regular contact with health
services.
The next advances in the UK came in the 1990’s. In 1995, the Department of
Health continued the above theme, adding two further areas to be considered when diagnosing SMI. They included the safety of the patient and/or others and a requirement for community as well as medical support (Department of Health 1995). In 1999, the UK’s National Service Framework (NSF) for Mental
11
definitions encompassing the three Ds are used across federal health care providers.
The word ‘serious’ within the phrase SMI, has the power to suggest other mental disorders are ‘non-serious’. The term is merely used to represent
conditions commonly grouped together. The definitions of SMI above encompass a range of conditions and clinical diagnoses. They can, however, still be considered useful. Grouping conditions based on severity will be especially useful for service providers and commissioners. In other words, although heterogeneous in medical diagnoses, the group is homogeneous in terms of service use and need.
The definitions above stem from a service administration or commissioner perspective, one where the severity and burden on the health system are critical to the definition. The first stage in identifying this group will, however, require a clinical diagnosis. There is no single clinical definition of SMI; it is a suite of disorders. Khatana et al (2001) supported the views of Wang et al
(2002) that frequently, operationalised definitions of SMI cover three domains of the Diagnostic and Statistical Manual of Mental Disorders classification (DSM); mood disorders, anxiety disorders and non-affective psychoses. The DSM is a set of clinical codes used to define known mental disorders and map to the International Classification of Diseases (ICD).
12
measured by the Global Assessment of Functioning (GAF) scale (American Psychiatric Association 1987; Khatana et al. 2011). Specifically, the two levels of dysfunction defined by cut-off points of the GAF are tested: moderate or severe dysfunction a GAF score of 70 or less, indicating mild symptoms or some difficulty in social, occupation or school functioning; or only severe dysfunction a GAF score of 50 or less, indicating severe symptoms or severe difficulty in social, occupational or school functioning. The broad definition; the `two-dimensional definition' is based on the fulfilment of the latter two criteria only (American Psychiatric Association Diagnostic and Statistical Manual of Mental Disorders 2002).
Yet more simple definitions include only specific disease groups. Three conditions, schizophrenia, schizoaffective disorder and bipolar disorder, were considered by the National Institute for Health and Clinical Excellence (NICE) (National Institute for Health and Clinical Excellence 2009) for use as the Quality and Outcome Framework (QOF) indicators relating to SMI. Finally, recent work by the Mental Health Foundation (2007), included psychosis, bipolar disorder, schizophrenia, schizoaffective disorder and puerperal psychosis within SMI. These small numbers of conditions, especially schizophrenia, schizoaffective disorder and bipolar disorder do cover a large proportion of the total SMI cases. This group of clinical definitions is not used universally, with different variants of DSM IV domains. They are however the most common, covering the majority of conditions considered as an SMI.
13
Recent data in the UK from the Information Centre for Health and Social Care (2011), the QOF reported a national prevalence of 0.8 percent (438,000 patients). This covers patients registered with primary care who have a diagnosis of schizophrenia, bipolar disorder or other psychoses and who are considered to have serious morbidity. The prevalence varies between primary care trusts (PCTs), ranging from 0.5 to 1.5 percent as documented by the National Institute for Health and Clinical Excellence (2009).
Epidemiological data concentrating broadly on SMI are scarce. According to the Information Centre for Health and Social Care (2009), all psychotic disorders, not solely cases defined as ‘serious’, have estimated prevalence 5
per 1,000, with an incidence of 31.7 per 100,000 in England. Schizophrenia is the most common psychotic disorder, affecting approximately 400,000 in England. Point prevalence estimates vary from 1.1 to 2.4 percent (National Institute for Health and Clinical Excellence 2009) with an estimate of lifetime prevalence of 8.7 per 1000. Recent estimates, from systematic review, place incidence in England at approximately 15 per 100,000 person years (Halliwell
et al. 2007). Finally, estimates of schizoaffective disorder remain scarce;
14
The National Institute for Health and Clinical Excellence (2009) reported that bipolar disorder affects an estimated 545,000 patients in the UK. International estimates report a lifetime prevalence of bipolar disorder of between 0.9 and 2.1 percent and a prevalence of bipolar disorder with manic episodes of approximately 1 percent (Halliwell et al. 2007). There is variation between populations with estimates of the prevalence without manic episodes especially varied, between 0.2 and 2.0 percent. Khatana at al (2011) again supports the views of Pini et al (2005) that an estimate of the incidence of bipolar disorder across three UK cites, in those aged 16 to 64 years, was 4.0 per 100,000, although this varied from 1.7 in Bristol to 6.2 in London. More generally, estimates place annual incidence at 7 per 100,000, with a lifetime prevalence of bipolar disorder with manic episodes of between 4 and 16 per 1,000 as documented by the National Institute of Excellence (2006). A recent Finnish study, using a nationally representative population-based screening study, placed lifetime prevalence slightly higher than previous estimates at 2 per 1000 (Piri et al. 2007).
Demographics patterns in SMI
15
Although the overall prevalence is equal between sexes, the patterns in incidence with age differ. Both schizophrenia and bipolar disorders have an earlier onset in men compared with women (The National Institute for Health and Clinical Excellence 2009; Information Centre for Health and Social Care 2009; Kirkbride 2012), both occur most frequently between late adolescence to early adulthood. Schizophrenia typically has first onsets between the ages of 20 and 30 years, with estimates of a mean age of 21 in men and 27 in women. Bipolar disorder presents between the ages of 17 to 29 years (Pini et al. 2005; Halliwell et at. 2007), with estimates of a mean of 30 years in men and 35 in women, typically later than schizophrenia. Schizoaffective disorder has a marginally wider range, covering the modal ages of the two conditions above. The incidence of all declines with age, however, schizophrenia can have a secondary peak in incidence in the mid to late-forties (Loranger 1984).
There are differences in many common mental illnesses across socio-economic position (SEP), with the most deprived suffering a greater prevalence. The relationship with incidence appears weaker. Social fragmentation may promote incidence in deprived communities; however, this remains under-studied, with methodological weaknesses. Most importantly, little work has used longitudinal data to establish whether low SEP is causal of or caused by SMI.
16
et al. 2001). Remarkably, this is a relationship not found elsewhere in the
world. According to the results of the AESOP study (Lloyd et al. 2005), the diagnosis of both schizophrenia and bipolar disorder is more common in the black population in the UK compared with other ethnic groups. Meta-regression suggests black African and Caribbean groups have a relative risk of 4.7 to 5.6 for all psychotic disorders, compared with baseline population group in England (Kirkbride 2012). Traditionally, the impact of SMI has been considered equal in Asian and white ethnic groups; however, evidence is emerging of an increased risk in certain south Asian populations. There is evidence of a raised risk of schizophrenia in women of Pakistani or Bangladeshi ethnic backgrounds, with some suggestion of an increased risk of bipolar disorder. Finally, urbanicity, once controlling for age, sex and ethnicity, stands as an independent risk factor for schizophrenia (Kirkbride 2012).
Recent trends in SMI
17
increase over time is drug-induced psychosis, with up to a 15 percent increase each year (Kirkbride et al. 2009; Kirkbride et al. 2012).
Economic burden of SMI
SMIs have a considerable burden on society, with substantial disability and economic impacts (Insel 2008). Indeed, the impact of SMIs far outstrips their prevalence. All diseases have indirect costs - costs not directly from the medical or social care, but from wider societal impacts. Mental illness, most notably SMI are remarkable for their burden of indirect costs (Das Gupta 2002). There are few estimates on the cost of SMI specific to the UK. Bipolar disorders were estimated to cost the UK £2 billion in 2000 (The Sainsbury Centre of Mental Health 2003). Recent experimental estimates of the cost of all mental illness in the UK placed the burden at approximately £77 billion in 2003. Only 16 percent of this was from health and social care; with £41.8 billion in human costs, for example from losses to quality of life; and £23.1 billion from losses in economic output. These figures do not contain social security payments which were not considered a cost, merely a transfer of spending power from the state to individuals (Kessler et al. 2008). This is, however, an opportunity cost, with spending diverted from other causes. In 2003, these social security payments amassed to an estimated £9.5 billion. Unemployment and sickness absences stand as a particular cost for SMIs, with up to 46 percent unemployment in patients with bipolar disorder (The Sainsbury Centre of Mental Health 2003).
18
2012) per year reduction in earning in patients with SMI (Centorrino et al. 2009).
19
SMI and co-occurrence of physical medical diseases
20
greater amount of undiagnosed diseases, so patients with SMI are less likely to be aware that they have a co-morbid condition even if diagnosed (Radke et al. 2010).
Co-morbid conditions exacerbate the impact of SMI. For example, in a sample of patients suffering from manic episodes, the presence of a physical morbidity increased inability to work (a two-fold increase comparing one co-morbidity with none) (Kilbourne et al. 2005). There is further evidence of an association between greater co-morbidity with lower income, greater benefits claims and medical consultation. There is even evidence of a dose response as the number of co-morbidities increase (Kilbourne et al. 2005).
Although the co-morbid conditions affect the entire body, certain co-morbid conditions are particularly common in patients with SMI. Older SMI patients, for example, suffer an especially greater burden and circulatory and pulmonary co-morbidity (Hennekens et al. 2005). CVD is the most frequent cause of death in patients with bipolar disorder, followed by cancer and respiratory disease. Below the evidence behind a number of co-morbid conditions is reviewed in greater detail.
Cardiovascular Diseases (CVD)
21
Drapalski et al. 2008; Osby et al. 2001; Goldstein et al. 2009; Osborn et al.
2007), with a similar 2 to 3-fold increased risk of death (Druss 2007). One review of data for patients with schizophrenia concluded that approximately two thirds of this population are expected to die from CVD, compared with approximately half of the general population (Osby et al. 2001). For patient sub-groups, women may have a greater increase in CVD risk than men. There is also an earlier onset of CVD. In one US survey, patients with CHD were on average 13 years younger if they had a SMI co-morbidity (Osborn et al. 2007).
The best English data comes from over 40,000 patients with SMI in the general practice research database (GPRD) - a nationally representative collection of primary care records. Under the age of 50 years, patients with SMI had a 3-fold increased risk of CHD mortality and 2.5 times increased risk of stroke; over 50 years these were both 2-fold increases (Johannessen et al. 2006). The increased risk of a first CVD event, did not match that for mortality, with in fact no increased risk for those aged 50 years and over.
22
disorder, but not for those with schizophrenia. Other data suggests only a slight increase in patients with SMI.
Similar data from the UK shows patients with schizophrenia have the entire suite of CVD risk factors, much worse than the general population. This includes more smoking, obesity, physical inactivity, poor lipid profiles and poor diet (McCreadie 2003). Osborn et al. reported recent data on the cardiovascular health in SMI patients in UK general practice (Osborn et al. 2006). Compared with the general population, SMI patients were twice as likely to have a raised global CVD risk scores, with a higher median risk score. The difference in global risk was especially apparent for younger ages. There was a higher smoking prevalence, lower HDL cholesterol, higher total cholesterol, a small increase in raised BP and a higher diabetes prevalence (diabetes being an independent risk factor for CVD) (McCreadie 2003) (see page 23). Older patients have smaller differences in CVD risk factors, probably due to a healthy survivor effect (Johannessen et al. 2006).
Two particular risk factors for CVD (as well as risk factors for other poor health outcomes) stand out in groups of patients with SMI. Estimates of smoking prevalence for those with SMI are between 60 and 90 percent, approximately 3 times those in the general population (Drapalski et al. 2008; Osby et al
23
that smoking cessation efforts can be less effective than in the general population. This critically does not have to be the case. Trials show smoking cessation can be effective in patients with SMI, especially if tailored for the patient and drug therapy is included (Osby et al 2001).
The second risk factor to particularly impact patients with SMI is obesity. An American sample suggested an approximately two-fold increase in prevalence, with an especially large increase in highly obese women (Dickerson et al. 2006). Women with SMI suffer a higher burden of obesity compared with men (Drapalski et al. 2008). Of greater concern to cardiovascular health is the increase in abdominal obesity compared with obesity per se (Drapalski et al. 2008) (see page 25). In addition to risk factors, deficiencies in care outlined above have an impact on mortality rates; including poor prevention and acute care. UK data show the increased risk of CVD mortality is significantly greater than the first event; secondary prevention and acute care for CVD remains suboptimal in patients with SMI (Johannessen et al. 2006).
Respiratory Illness and other conditions
24
general population, when compared with circulatory disease and diabetes. There is increased risk of many respiratory illnesses, including COPD, bronchitis and asthma (Drapalski et al. 2008; Himelhoch et al. 2004). Data suggest a three to four-fold increase in chronic bronchitis, a five-fold increase in asthma risk and approximately two-fold increase in COPD (Drapalski et al. 2008; Sokal et al. 2004). Although largely due to smoking prevalence, this may not be the only factor. Second hand smoke, as well as other as yet unknown factors may be important (Drapalski et al. 2008; Sokal et al. 2004). As discussed above, patients with SMI are believed to be at increased risk of co-morbidities affecting the entire body. There is evidence of higher HIV prevalence in some SMI populations (Drapalski et al. 2008). For example in one US sample, patients with schizophrenia had a 1.5 times greater adjusted prevalence and a four-fold increase in patients with affective disorders (Bank
et al. 2002). There is some evidence of women with SMI having an increased
risk of obstetric complications (Thornton et al. 2010). Finally, the impact of how patients with SMI interact with health services is highlighted in paper which describes late presentation with appendicitis and how this results in poorer outcomes and more complications (Cooke et al. 2007).
Diabetes
25
2001; Bushe 2004). More recent estimates quote this figure as a three to four fold increase compared with the general population (Drapalski et al. 2008; Bushe 2004; Goldstein et al. 2009). One significant international study, including 220,000 respondents from 52 countries showed diabetes prevalence in patients with SMI varied considerably between countries, ranging from nearly zero to eleven percent (Nuevo et al. 2011). Finally, there is some evidence that if diabetic, SMI patients are more likely to have complications (Felker et al. 1996; Nuevo et al. 2011). This indicates poor glycaemic control, which is likely in part to be due to poorer care and delayed diagnosis, but this together with anti-psychotic medication also potentially important (Nasrallah et al. 2006; Holt et al. 2010).
26
in the prevalence of diabetes. This was independent of SMI diagnosis, medication and known metabolic risk factors. This suggests a more direct link between symptoms and diabetes, although how this might occur is entirely unknown (Nuevo et al. 2011). Finally, there is evidence of an increased prevalence of aspects of ‘the metabolic syndrome’ (see below) in patients with
SMI, of more severe symptoms and of more limited impacts of treatment (McIntyre et al. 2010). In reality, it seems likely that both lifestyle and the medications are implicit in the diabetes risk, with potential for a third, less understood pathway.
Metabolic syndrome
27
analyses show that metabolic syndrome, and indeed CVD itself share basic genetic pathways (de Almeida et al. 2012).
As mentioned above, anti-psychotic drugs (neuroleptics) may be implicit in the metabolic syndrome. These drugs cause weight gain, although there is variation between agents. Two medications, Clozapine and Clanzapine, may be especially associated with metabolic syndrome, increasing total weight gain, abdominal adiposity, insulin resistance and affecting lipid metabolism (Newcomer 2007). In a randomised trial comparing anti-psychotic medication with a placebo, there was a 1.2 to 5 fold increase in impaired glucose tolerance and evidence of up to 4kg in weight in 10 weeks when taking the medication (Druss 2007). Increased risk of metabolic syndrome, therefore of CVD and diabetes, is complex in patients with SMI and multi-factorial in its causes.
Mental co-morbidity
Other mental co-morbidity, despite potentially not having the same impact on mortality as some conditions, does represent a significant burden on morbidity in patients with an SMI. The majority of patients with bipolar disorder have at least one other axis-1 disorder, with estimates of lifetime prevalence of upwards of 65 percent and a point prevalence of one third (Pini et al. 2005; McElroy et al. 2001). The greatest single mental co-morbidity is anxiety disorder, with some lifetime estimates of prevalence reaching 65 percent (Pini
et al. 2005; McElroy et al. 2001). The risk is not restricted to anxiety disorder,
28
concurrent mental co-morbidities is exemplified by data from patients in one English mental health unit from the 1990s (Pini et al. 2005). Twenty percent of patients with an SMI reported a second mental health diagnosis from within the previous six months (Virgo et al. Journal of Mental Health 2011).
Substance misuse is highly prevalent in patients with SMI. Although now 20 years old and from the US, the largest general population survey of mental health co-morbidity exemplifies this. The rate of lifetime alcohol or drug use disorder in the general population was approximately 17 percent. This was compared with 47 percent for people with schizophrenia, 56 percent for people with bipolar disorder and around 30 percent for people with other mood disorders or an anxiety disorder. Overall, across SMI this was summarised as a 50 percent lifetime prevalence (Regier et al. 1990), with a 25 to 35 percent point prevalence. Comparing the odds of risk with the general population, there is 10 to 20 times higher odds of alcohol abuse and up to 30 to 40 times increased odds of illicit substance abuse in both patients with bi-polar disorder and schizophrenia (Felker et al. 1996; Nuevo et al. 2008).
Despite this bleak prognosis, there is evidence of successful inventions for what is called the “dual diagnosis”, SMI with substance abuse. Trials using
29
2.2 Commissioning for patients with SMI
There is evidence of poorer acute care, including follow-up after disease events and hospital in-patient care, in-patients with SMI (England et al. 2005; NHS Diabetes Commissioning Mental Health and Diabetes Services 2001). Again in a national US sample, patients with SMI were less likely to receive hospital care for CVD and diabetic complications. Similarly, despite evidence of increased need, patients with SMI are significantly less likely to receive appropriate care following a CVD event, patients with SMI were up to three times less likely to receive necessary procedures (England et al. 2005).
Following heart failure, there is evidence that SMI patients are less likely to receive follow-up care and more likely to face re-admission. One final piece of evidence concerning the quality of care, suggests that patients with schizophrenia have a greater rate of adverse events in hospital, compared with the general population (Mechanic 1995).
30
with mental health services can increase the use of a suite of services and result in better patient outcomes, including blood pressure control.
One thing that is clear is that integrated care is of paramount importance for patients with SMI. As such, primary care has been proposed as the best setting to improve patients’ health. Primary care practitioners, have the
greatest experience of holistic and integrated care. For this to happen, however, a number of barriers must be overcome. There firstly needs to be collaboration between primary care and psychiatric services. Primary care doctors can be unfamiliar with psychiatrists, which can limit access to care resulting in ? generally face poor co-ordination and collaboration (Cooke et al. 2007). Secondly, primary care clinicians must accept psychiatric conditions do not inhibit routine medical care. Clinicians can view patients with SMI as disruptive to their practice, cite time constraints as a barrier or simply be uncomfortable with the situation. All of these stop general practitioners managing patients with SMI. Qualitative work does, however, suggest general practitioners are willing to take a central role, not only in the diagnosis of, but also the routine care of patients with SMI (Johannessen et al. 2006).
31
These barriers are frequently caused by the SMI itself, and include forgetting required care, a lack of knowledge of how to access care and difficulties in communication.
There is little specific guidance on commissioning services for patients with SMI, and less evidence on the effectiveness of different strategies. One certainty is that both continuity of care and integrated care play particular importance for patients with SMI (England et al. 2005; NHS Diabetes Commissioning Mental Health and Diabetes Services 2001). They must be able to ‘seamlessly’ navigate between aspects of care, especially mental
health care – but also physical care. Integration is particularly important because patients with SMI are amongst the most socially excluded (England
et al. 2005); therefore have fewer opportunities for care and the condition can
make it hard to negotiate care pathways. They also require care over prolonged periods, a situation in which integration is vital (England et al. 2005; Mechanic 1995).
32
A number of considerations for commissioning services for patients with SMI emerge from the evidence above, with a particular focus on co-morbidities. Firstly, and important to consider for all commissioning decisions, given the differential increase in mortality compared with disease incidence for patients with SMI, there is a very real need to improve the routine care in those with diagnosed disease (NHS Diabetes Commissioning Mental Health and Diabetes Services 2001). Commissioning services that allow for regular physical assessment may be effective. Following a formal guide, such as one for diabetes produced by NHS diabetes may also enable the correct processes for evidence based commissioning (NHS Diabetes Commissioning Mental Health and Diabetes Services 2001).
33
Patients with SMI suffer poorer than average outcomes from national screening programmes, largely due to decreased uptake. An alternative approach to screening or at least extra focus on patients with SMI may be warranted. Bespoke interventions for patients with SMI to reduce CVD risk can be effective (Smith et al. 2007). Currently CVD risk in those without diagnosed vascular disease is the focus of the NHS Health Check programme. Incorporating patients with SMI into the programme, but like one London PCT, separate performance management to promote uptake is a possible solution (NHS Diabetes Commissioning Mental Health and Diabetes Services 2001). Bespoke interventions for ‘dual diagnosis’ (SMI and
substance abuse) can also be effective. Finally, dental care is poorer in patients with SMI than the general population. Although there are few evidence-based interventions, focus must be placed on access to care and good oral hygiene, with particular focus on provision for in-patients.
34
focuses on clinical models rather than organisational or systems level approaches to implementing those models. Comparative effectiveness trials will be needed to compare organisational approaches to delivering and sustaining these evidence-based approaches to improving care for persons with co-morbid conditions. Finally, health reform will include a broad range of changes in insurance coverage and care delivery that could have a disproportionate impact on persons with co-morbid medical and mental conditions. Tracking the impact of this legislation on costs, burden and outcomes of care for this population could provide important information to inform future iterations of health legislation.
2.3 Prevalence modelling
Prevalence modelling is a technique used to estimate the number of people with a particular condition or risk factor in a population when direct evidence is not available (American Psychiatric Association Diagnostic and Statistical Manual of Mental Disorders 2002). Direct evidence may be lacking because surveys or data collection have not been undertaken, are technically impractical, or are unreliable.
35
and ethnicity can influence the prevalence of a behaviour, risk factor or disease and more complex epidemiological modelling techniques are required in order to take such factors into account.
The need for prevalence Modelling
In many cases, routine data are not available to measure directly the frequency and distribution of diseases or behaviours in local populations (Diez-Roux 2000). Modelling is often the best alternative for quantifying prevalence in the absence of reliable direct measures. Typically, direct measures are not available at local level for lifestyle behaviours such as smoking or alcohol consumption, or for diseases that are generally managed in primary care, for example diabetes or hypertension.
Understanding the distribution of behaviours that affect health (either positively or negatively) is increasingly important in the allocation of public health resources and the delivery of interventions (Congdon 2006; Congdon et al. 2007). Prevalence modelling can be used to assess need and help identify those communities that will most benefit from public health initiatives. Modelled estimates of prevalence can also be helpful in explaining variations in care utilisation and outcomes (Congdon et al. 2007).
36
et al. 2002). Modelled estimates that include undiagnosed disease in the
population can offer additional information that can inform case-finding initiatives and highlight areas where under-diagnosis could be an issue.
There is considerable interest in obtaining estimates of expected prevalence at various geographies and for different subgroups of the population, for example ethnic groups or age cohorts, to assist in understanding and tackling health inequalities (Congdon et al. 2007).
Methods
Many methods exist for creating synthetic estimates of prevalence, and in many cases methodologies are combined and adapted to make best use of the information and data available (Homer et al. 2006). There is often a balance to be struck between increasing the complexity of the model by incorporating more contributory factors and the availability of good quality data at local level to populate the model. These input requirements of a model are often restricted by what information is available (Gunners-Schepers 1989). Complex models can also suffer from difficulty of interpretation, which negates the benefit of increased accuracy.
2.4 How does the model work?
37
1) Regression models using demographic characteristics from large surveys
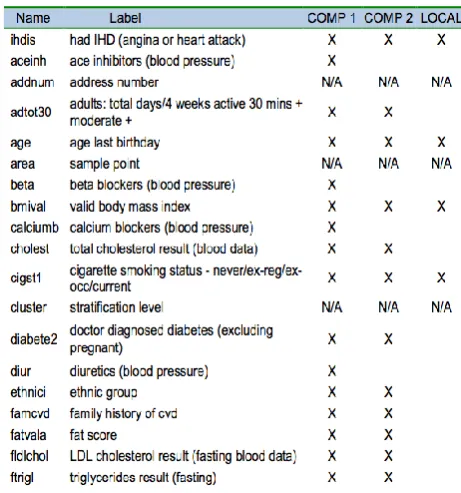
Multiple variables from large surveys can be used to model the risk factors for a behaviour or disease, using techniques such as multi-nomial logistic regression. However, it is important to limit the factors considered to those for which data are available in the population of interest. For example, cholesterol level or family history of disease may be important risk factors which were recorded in the source survey, but such information is not usually available at population level and therefore these are not appropriate variables to be included in a disease prevalence model.
National surveys are usually limited to people living in private households and omit populations such as the homeless, those living in institutional care, ‘special populations’ (armed forces and prisoners) who are the people
particularly likely to decline to participate. For some disease areas, notably some types of mental illness, these omitted populations can be particularly important. Despite this limitation, national surveys are often the best source of prevalence information available, but where possible should be used in conjunction with other evidence about the likely extent to which they miss cases. Models can then be adjusted to take account of the resultant under-estimation of prevalence.
38 2) Capture-recapture methods
Capture-recapture methods are used to estimate the number of people with a disease or behaviour, for example the total number of injecting drug users, including those unknown to any services. A random sample of people is taken (‘captured’) from the whole population, and examined for the characteristic of interest. ‘Sample 1’ is the number of individuals found to have the
characteristic. A second random sample of the whole population is then taken and ‘Sample 2’ is defined similarly as those found to have the characteristic.
Some people will appear in both Sample 1 and Sample 2 and the proportion of Sample 2 that was also in Sample 1 is calculated. This proportion is assumed to be equivalent to the proportion of all the people with the characteristic in the whole population that were captured in Sample 1. Hence, by dividing Sample 1 by this proportion an estimate of the total number with the characteristic is obtained.
3) Combining multiple sources
39
areas. Combining prevalence estimates requires critical appraisal of the appropriateness of each source and development of mathematical methodology, to integrate the variance estimates from unrelated sources to produce an overall confidence interval for the synthetic estimate.
Meta-analysis techniques have been developed to combine multiple estimates of prevalence, each of which may have data quality issues, to produce one triangulated estimate with improved quality at small area level. Estimates from a wide range of sources can be combined, including prevalence estimates from surveys, data from primary care and modelled synthetic estimates. Bayesian statistical methods can be employed to synthesise a diverse set of available data into a prevalence estimate. For example, Goubar et al (2008) combined an array of information, including routine surveillance data and anonymous surveys, to estimate HIV prevalence in various risk groups using Markov chain Monte Carlo simulation.
2.5 Validation, confidence intervals and robustness
40
Estimates of the accuracy of prevalence estimates based on simple models can be generated by combining the uncertainty in prevalence rates from the source study or trial with the stochastic variation expected given the size of the local population. This approach results in a range estimate for the prevalence, rather than confidence intervals. The range estimates are calculated using the same methods as those used to derive the control limits for funnel plots.
However, if there is uncertainty around both the population data and the input data, the calculation of confidence intervals can be complex. Bootstrapping methods are commonly used in such situations.
Four ways of validating models a. Sensitivity testing
41 each other (r2 > 0.95).
One-way sensitivity analysis such as this evaluates the impact of a change in one variable on the model results. Multi-way sensitivity analysis is more powerful and can be used to assess the impact of changing two or more variables simultaneously.
b. Internal validation
One method of assessing the performance of a model is to use it to predict the response for each subject in the source data (e.g. a large survey). These predictions are called fitted values. The differences between the fitted and the observed values are called residuals. Residual analysis can be used to check the adequacy of any assumptions used when creating the model. It can also be used to identify whether any additional factors should be included.
To check the accuracy of the model, the predicted ‘classification’ of each
individual (i.e. whether or not they have the disease or behaviour that is being modelled) can be compared with their actual classification. This will result in a ‘misclassification’ (also known as a ‘contingency’ or ‘confusion’) (Table 1).
42 c. External validation
One method of assessing external validity is to map observed and expected
prevalence and investigate associations with a low ratio of observed to expected cases, at both local authority, PCT and/or practice levels. The gold standard validation would be comparison of model predictions with a comprehensive population survey or case-finding efforts in a number of differing populations: deprived and advantaged, rural and urban, etc.
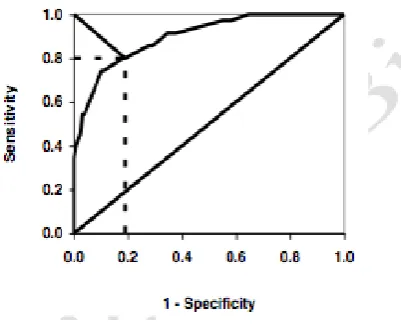
Receiver-Operating Characteristic (ROC) Analysis
ROC analysis is a useful way of assessing the accuracy of a model by understanding the trade-off between the sensitivity (in this sense referring to the true positive rate; Table 2) and the specificity (the true negative rate). The method was developed to assess the accuracy of distinguishing signal from noise in radar systems and has since been applied in many other settings, including clinical diagnostic testing and the evaluation of regression models that classify cases into two categories, for example diseased and non-diseased. Sensitivity is plotted against 1-specificity (specificity subtracted from one) over a range of values and the area under the curve (AUC or AUROC) is used as a summary of the predictive or diagnostic accuracy. A ‘perfect’ model
43
2.6 Projections and forecasting using models
Prevalence models can often be adapted to predict future prevalence. The sophistication of projected prevalence estimates depends on the modelling methodology adopted, and falls into three broad categories:
a. Same risk, changing (e.g. increasing and/or ageing) population. Use the same model coefficients or risks of disease but incorporate population projections. For example, what will be the prevalence of coronary heart disease (CHD) in 2020 if we assume that the age- specific risks do not change but we take into account the aging population? This is sometimes called the ‘prevalence ratio method’
b. Same population, changing risk. Use the same demographic information but change the risk profile. For example, what will be the prevalence of CHD if smoking prevalence reduces?
c. Modify the population and the risks to produce ‘scenario models’ e.g. what
will be the CHD prevalence with an ageing population and reduction in smoking.
44
2.7 Using prevalence models
It is important to remember that prevalence figures generated by models are synthetic estimates of the expected prevalence of disease. They are not ‘real’ measures of prevalence. It must be remembered that ‘all models are wrong but some are useful.’ Discrepancies between modelled estimates and other
sources of data (such as primary care disease registers) may be due to local variations not captured by the model and cannot be solely attributed to weaknesses in directly measured prevalence data. For local populations that differ significantly from a ‘typical’ population (e.g. a large black and minority
ethnic (BME) population that has a very different smoking pattern to the national average) the assumptions of a model may not apply and discrepancies may occur. Local expert opinion (e.g. local GPs’ knowledge of
the pattern of disease) can be invaluable in interpreting and applying synthetic estimates of prevalence.
45
Because modelled prevalence is an estimate of expected prevalence, generally with the assumption that the local area behaves in the same way as the population from which the source data were derived, it is not straight forward to use synthetic estimates to evaluate the impact of a local intervention. For example, low modelled prevalence of binge drinking in a local area that has invested heavily in action to decrease alcohol misuse is not proof that the investment has reduced binge drinking. It is only an indication that the area can expect a low prevalence, given its demographic characteristics. Local interventions or prioritisation of an issue may explain discrepancies between modelled and directly measured prevalence, but the discrepancy does not prove that an intervention or policy is effective. It is not advisable to use prevalence models for performance management or to evaluate the impact of a local programme.
It is also inappropriate to use modelled estimates to monitor changes over time. Changes in estimated prevalence could be due to updated local input data (e.g. demographics) or changes in the source data used to generate a new version of the model. There may also have been adjustments in the modelling methodology used if source data have been re-modelled.
2.8 Issues with Small Area Estimates (SAE)
46
characteristics to the area of interest. Generally, a statistical model is used to obtain indirect estimates for geographical areas considered to be "small". The information from respondents who are outside the geographical area and other geographical characteristics are incorporated through the use of a statistical model. Small area estimates of the prevalence is important where risk factors vary widely, but are important for decision and policy makers, and their quality is a crucial concern. One example is in health promotion, when addressing area-specific health issues or lifestyle behaviours. In some deprived areas people might have more restricted access to screening programmes or preventive healthcare campaigns, or they may have a higher level of certain risk factors. Knowledge of the prevalence of risk factors in small areas is essential to make health promotion strategies more effective.
Small area estimation is conducted in two stages. In the first stage, regression analysis is performed modelling survey data (e.g. HSfE) against predictors of the condition under investigation. This analysis is conducted for the subset of areas covered by the survey. The output from this first stage is a set of parameter estimates. At the second stage each area of the population, the coefficients of the predictor variables obtained from the first stage model, are attached to the identical set of variables at the small area level to produce an estimate for the area as a whole.
Synthetic modelling for small areas uses a number of methods to generate estimates:
47
c. Models combining individual and local area-level covariates, d. Models using area level covariates only,
e. Other approaches for larger areas of geography,
Only two (a and c) of the methods are reviewed here as they are more applicable to the study in question.
a) Indirect standardisation
This involves applying national estimates derived from national surveys to area-level population counts to generate area estimates. An example of this approach – If we have to calculate the proportion of men smoking in a particular ward would involve (a) using national estimates of smoking patterns and (b) applying these to the local population, weighted by the proportion of persons in the sub-group in the small area.
This model has an intuitive appeal in its generally easy and inexpensive to use (Nacul et al. 2007). The major drawback is that it assumes that the national rates of each subgroup are applicable uniformly across all areas.
b) Using covariates from census
This is an extension of the above method. It uses the information regarding the relationship between individual health behaviour measures obtained from surveys against a set of predictor variables for the same individuals.
48
subgroups defined by the covariates who fall into relevant health category. These proportions are then applied to the covariate counts available from the census to derive an overall estimate for the small area in much the same way for indirect standardisation. The major drawback concerns its data requirements. This form of synthetic estimation requires exact correspondence between the covariates used at national and local