Type of the Paper (Article)
1
Evaluation of MODIS-Retrieved Aerosol Optical Depth in
2
Alaska: Implications for Surface Air Quality Applications
3
Alyson McPhetres, Srijan Aggarwal*
4
Civil & Environmental Engineering, University of Alaska Fairbanks, Fairbanks, AK 99701 USA
5
*Correspondence: [email protected]; Tel.: +01-907-474-6120
6
Received: date; Accepted: date; Published: date
7
Abstract: The air quality monitoring network in Alaska is currently limited to ground-based observations
8
in urban areas and national parks leaving a large proportion of the state unmonitored. The use of MODIS
9
aerosol optical depth (AOD) to estimate ground-level particulate pollution concentrations has been
10
successfully demonstrated around the world, and could potentially be used in Alaska. In this work,
11
MODIS AOD measurements at 550 nm were validated against AOD derived from AERONET
ground-12
based sunphotometers in Barrow and Bonanza Creek to determine if MODIS AOD from the Terra and
13
Aqua satellites could be used to estimate ground-level particulate pollution concentrations. The MODIS
14
AOD was obtained from MODIS collection 6 using the dark target Land and Ocean algorithms from 2000
15
to 2014. MODIS data could only be obtained between the months of April and October; therefore, it could
16
only be validated for those months. Individual and combined Terra and Aqua MODIS data were
17
considered. The results showed that MODIS collection 6 products at 10 km resolution for Terra and Aqua
18
combined are not valid over land but are valid over the ocean. On the other hand, the individual Terra
19
and Aqua MODIS collection 6 AOD products at 10 km resolution are valid over land individually but not
20
when combined. Results also suggest the MODIS collection 6 AOD products at 3 km resolution are valid
21
over land and ocean and perform better over land than the 10-km product. These findings indicate that
22
MODIS collection 6 AOD products can be used quantitatively in air quality applications in Alaska during
23
the summer months.
24
Keywords: AOD; MODIS; Alaska; AERONET; air quality
25
26
1. Introduction
27
Exposure to fine particulate matter (PM) air pollution adversely affects cardiopulmonary health and
28
is associated with increased morbidity and premature mortality [1]. Fine particulate pollution consists of
29
particulates smaller than 2.5 µm (PM2.5) in aerodynamic diameter. A risk analysis of the public health
30
impacts of exposure to ambient PM2.5 estimated that 130000 PM2.5-related deaths in the continental United
31
States would result from the PM2.5 concentration levels in 2005 [2]. Alaska is not immune to the effects of
32
PM pollution. Between the years of 2003 and 2008 in Fairbanks, AK, each 10 µg/m3 increase in the mean
24-33
hour PM2.5 was associated with a 6% to 7% increase in the risk for a cerebrovascular disease-coded and
34
respiratory tract-coded hospital visits the following day. Air quality monitoring is essential for monitoring
35
exposure, determining sources of pollutants, and providing air quality alerts to the public [3].
36
The air quality monitoring (AQM) network in Alaska is currently limited to urban areas (Fairbanks,
37
Palmer, Anchorage, Juneau) and national parks. Moderate Resolution Imaging Spectroradiometer
38
(MODIS) derived aerosol optical depth (AOD) has been used successfully around the world to estimate
39
ground-level PM air pollution [4–6], and it could potentially be used to estimate ground-level particulate
40
2 of 14
pollution in Alaska and thus enhance the spatial coverage to fill the gaps beyond what is covered by the
41
state’s AQM network.
42
MODIS currently acquires data across 36 spectral bands, and it has been onboard the Terra and Aqua
43
satellites since 1999 and 2002, respectively. The MODIS Collection 6 (C6) aerosol algorithm consists of three
44
separate algorithms that are used to retrieve AOD from MODIS-observed spectral reflectance: the dark
45
target (DT) ocean algorithm, the DT land algorithm, and the Deep Blue (DB) algorithm (Levy et al. 2013,
46
Hsu et al., 2012or13). The DT ocean algorithm retrieves AOD over the ocean seven wavelengths. The DT
47
land algorithm retrieves AOD over vegetated and dark-soiled land in three visible wavelengths. The deep
48
blue algorithm retrieves AOD over the desert and arid land and more recently has been expanded to all
49
surface type around the globe (Hsu et al. 2013). AOD over land can be derived at wavelengths of 470, 550,
50
and 660 nm. AOD over the ocean can be derived at wavelengths of 470, 550, 660, 870, 1200, and 2100 nm.
51
Both of the DT algorithm products are available at 10 km and 3 km resolution.
52
MODIS collection 6 AOD has been validated at 550 nm globally for Aqua at 10 km resolution, but not
53
specifically for Alaska or Terra at 3 km resolution [7], [8]. Therefore, to determine whether MODIS AOD
54
can be used to estimate ground-level particulate pollution in Alaska, the 10 km and 3 km resolution
55
products must first be validated against ground-based sunphotometers to determine if there is a strong
56
relationship between ground and satellite measurements in Alaska. Thus, the overarching goal of this study
57
is to determine if MODIS measurements of aerosol optical depth are reflecting actual conditions based on
58
ground-based measurements of aerosol optical depth. If at least 67% of the collocated ground-based and
59
satellite-based measurements are highly correlated and within the estimated uncertainty determined from
60
global validation studies (Table 1) [7], then it is indicative that MODIS AOD can be used to model
61
particulate pollution in Alaska. If the relationship is weak to non-existent, MODIS AOD cannot be used to
62
model particulate pollution and other satellite-based measurements should be considered.
63
64
Table 1. Estimated error for MODIS collection 6 dark target algorithm [7].
65
Resolution 10 km 3km
Satellite AQUA TERRA AQUA TERRA
Land ±(0.05+0.15τA) ±(0.05+0.15 τA) ±(0.05+0.2τA) NA
Ocean -0.02-0.1 τA NA ±(0.04+0.05τ τA) NA
+0.04+0.1 τA
66
2. Validation Methods
67
AERONET AOD (τA)
68
The Aerosol Robotic Network (AERONET) (http://aeronet.gsfc.nasa.gov) is a ground-based global
69
network of sunphotometers that measure aerosol properties using measurements of solar direct and diffuse
70
radiances [9]. Measurements are obtained and recorded by AERONET sunphotometers approximately at
71
the frequency of every 15 minutes. AOD is determined from direct measurements of solar radiance using
72
the Beer-Lambert-Bouguer equation [10]. Due to the low level of uncertainty of AERONET AOD
73
measurements (0.01 to 0.02), AERONET data is commonly used for the validation of satellite-derived
74
MODIS AOD products [10–14].
75
The Alaska AERONET sites of Bonanza Creek and Barrow were used for the validation of the MODIS
76
AOD product over Alaska. Table 2 lists the locations of the Bonanza Creek and Barrow sites. The
77
sunphotometers in Barrow and Bonanza Creek measure direct solar radiance. The AERONET
78
measurements are then used to determine AOD at the following wavelengths: 340, 380, 440, 500, 675, 870,
79
3 of 14
interpolate the AOD at 550 nm in the Multi-sensor Aerosol Products Sampling System (MAPSS) using the
81
quadratic fit on the log-log scale [9]. MAPSS is a framework that collects samples and generates the spatial
82
statistics of various satellites (e.g. MODIS) over AERONET sites and other locations of interest and
83
integrates them with ground-based measurements to facilitate validation [9]. The interpolated AOD at 550
84
nm, available in MAPSS between the years 2000 and 2014, were used in this study.
85
Table 2. Locations of AERONET stations.
86
Station Location Latitude
(North)
Longitude (West)
Elevation (m)
Dates Operational
Barrow Barrow, AK 71.31220° 156.66500° 0.0 30 July, 1994-present Bonanza
Creek
Bonanza Creek, AK 64.74281° 148.31627° 150.0 31 May, 1994-present
87
MODIS AOD (τA)
88
The MODIS C6 DT algorithms for land and ocean were used to derive AOD with 10 km and 3 km
89
spatial resolutions at nadir from MODIS measurements at a wavelength of 550 nm at both the Bonanza
90
Creek and Barrow AERONET sites [7], [9]. The MODIS dark target land algorithm was used to determine
91
AOD over the Bonanza Creek site, and the MODIS dark target ocean algorithm was used to determine
92
AOD over the Barrow site as little to no data existed over land for the Barrow site. Terra AOD with mode
93
quality assurance (QA) values of 3 (highest quality) within the collocation area and Aqua AOD with QA
94
values of 3 were used for the validation of the DT land algorithm-derived MODIS AOD. Terra AOD with
95
mode QA values greater than 0 within the collocation area and for Aqua AOD with QA values greater than
96
0 were used for the validation of the DT ocean algorithm-derived MODIS AOD. Previous validation studies
97
have also used MODIS AOD with QA of 3 over land and QA greater than 0 over the ocean [7], [11], [12].
98
AOD data was obtained from Terra between the years 2000 and 2014 and from Aqua between the years
99
2002 and 2014. Table 2 lists the error envelope (EE) for each satellite and the dark target land and ocean
100
algorithms derived from global validation studies for collection 6 [7], [15]. The EE was added to or
101
subtracted from the AERONET AOD (τA).
102
103
Collocation
104
Spatially and temporally collocated MODIS and AERONET AOD measurements were obtained from
105
the MAPSS. In MAPSS, AERONET AOD measurements taken within 30 minutes before or after the satellite
106
overpass time were considered temporally collocated with the MODIS measurements. This was consistent
107
with previously described methods of temporal collocation [9–11]. MODIS pixels in MAPSS were sampled
108
if the distance between the AERONET site and the MODIS pixels did not exceed 27.5 km [9]. Terra AOD
109
was used only if the mode QA of the collocated product was 3, and Aqua AOD was used only for products
110
with QA of 3. In MAPPS, the QA of 3 could only be specified for Aqua and not Terra at the time of the
111
analysis, thus Terra AOD was selected based on a mode of QA 3. The minimum number of collocated
112
AERONET and MODIS pixels were set as one to increase the number of samples as described in the
113
validation study by Sherman et al. [10].
114
115
Analysis
116
The validation study was performed using spatially and temporally collocated AOD from AERONET
117
and MODIS (Terra and Aqua) obtained from MAPSS. AERONET and MODIS AOD were plotted against
118
each other with MODIS AOD on the y-axis and AERONET AOD on the x-axis. Linear regressions
119
(MODIS_AOD=AERONET_AOD*m + b) were calculated using ordinary least squares (OLS) for all AOD,
120
4 of 14
ordinary least squares could be used to calculate statistically significant coefficients but could not be used
122
to calculate standard errors when the residuals were heteroscedastic; therefore heteroscedasticity
123
consistent errors were used to avoid incorrect interpretation of the data when heteroscedasticity
(non-124
constant variance of errors) was present [16]. The residuals were tested for heteroscedasticity (non-constant
125
variance) using White’s test for heteroscedasticity. If the residuals were heteroscedastic, standard errors,
126
significance tests, and confidence intervals were corrected using a heteroscedasticity consistent covariance
127
matrix (HCCM) referred to as type 3 heteroscedasticity consistent (HC3) at a significance level of 0.05 [16].
128
If the residuals were not heteroscedastic, the standard errors calculated using OLS regression were used in
129
the analysis.
130
The error envelopes (EE) for the Terra 10 km land, 3 km land, and 3 km ocean products were assumed
131
to be equal to those found for Aqua [7], [15]. Root mean square error (RMSE) was calculated using equation
132
1, where τM is the MODIS AOD, τA is the AERONET AOD, and N was the number of collocations.
133
RMSE = ∑( ) (1)
134
The median and mean bias were also calculated based on the difference between MODIS AOD and
135
the AERONET AOD. The fraction of data within EE was also calculated as done in similar studies [10], [12].
136
The data was considered valid based on the following three criteria.
137
Criterion 1: the slopes of the linear regressions of MODIS AOD versus AERONET AOD less than 0.15
138
and AERONET AOD greater than 0.15 cannot be statistically different
139
Criterion 2: MODIS AOD and AERONET AOD (all and greater than 0.15) must be highly correlated
140
(Pearson correlation coefficient greater than 0.7). MODIS AOD and AERONET AOD less than 0.15 must be
141
moderately correlated (Pearson correlation coefficient between 0.5 and 0.7)
142
Criterion 3: At least 67% of the MODIS AOD versus AERONET AOD datasets must lie within the EE
143
3. Results and Discussion
144
3.1. Bonanza Creek
145
MODIS AOD cannot be obtained in the presence of snow or clouds due to the high reflectivity of snow and
146
clouds. Due to the presence of snow in Alaska during winter months, MODIS AOD data could only be
147
obtained between the months of April and October; therefore, the validation is only effective for the end of
148
April through early October. Table 3 lists the slopes of the linear regressions of MODIS AOD versus
149
AERONET AOD at the Bonanza Creek site at 10 km and 3 km resolutions. The errors were heteroscedastic
150
based on White’s test for heteroscedasticity, therefore HC3 was used to calculate the standard errors used
151
in the t-tests. Chu et al. (2002) established that the departure of the slope from unity was representative of
152
systematic bias and that the y-intercept represented the error in the estimate of the surface reflectance [12].
153
The systematic errors could be due to aerosol model assumptions, instrument calibration, or measurement
154
selection [12]. While the slopes of the linear regressions for the 10 km datasets were lower than those of the
155
3 km datasets, the slopes of the regressions for the 10-km data were more variable than those of the 3-km
156
data. For example, the slopes of the linear regressions of the 10 km Terra, Aqua, and combined Aqua and
157
Terra datasets ranged from 1.40 to 1.49, while those of the 3 km resolution MODIS AOD data sets ranged
158
from 1.41 to 1.42 (Figure 1). Also, in Figure 1, the 3 km (Figure 1d, 1e, 1f) data appeared to have more noise
159
than the 10-km data (Figure 1a, 1b, 1c), which was presumably due to the higher resolution of the 3-km
160
data.
161
3.1.1. Criterion 1: Linear Regression
162
As listed in Table 3, all of the 3 km resolution MODIS AOD data satisfied criterion 1. The slopes of the
163
5 of 14
t-test), which indicated that combined Aqua and Terra AOD at 10 km resolution should not be used over
165
Alaska. Similarly, the p-value for the stratified individual Terra MODIS AOD at 10 km resolution was
166
relatively low at 0.06, indicating difference. For stratified individual Aqua MODIS AOD at 10 km
167
resolution, slopes were not significantly different (p=0.35). Based on these, individual Aqua MODIS AOD
168
at 10 km resolution could be used. For the all the 3-km data stratified by AERONET AOD (Terra and Aqua
169
combined or individual), slopes were not significantly different (p>0.8; Table 3) indicating that the 3 km
170
datasets could be used in Alaska. Overall, the 3-km dataset appeared to perform better than the 10-km
171
dataset because the difference in slope when the data was stratified by AERONET AOD was not significant.
172
The lower difference between slopes in the 3 km datasets could be due to the higher spatial resolution of
173
the data and the resulting increase in number of retrievals. Combined Terra and Aqua MODIS AOD can
174
be used to estimate ground-level air quality at a resolution of 3 km.
175
176
Table 3. Results of linear regression (τM= τA*m+b) and t-tests at a significance level of 0.05 for the Bonanza
177
Creek AERONET sit
178
Satellite AERONET
AOD Slope Standard Error P-value
Are the slopes significantly different?
10 km Resolution
Terra & Aqua
<0.15 1.29 0.03
0.03 Yes
≥0.15 1.48 0.08
Terra
<0.15 1.32 0.04
0.06 No
≥0.15 1.53 0.10
Aqua
<0.15 1.31 0.05
0.35 No
≥0.15 1.41 0.10
3 km Resolution
Terra & Aqua
<0.15 1.38 0.04
0.84 No
≥0.15 1.40 0.08
Terra
<0.15 1.38 0.05
0.87 No
≥0.15 1.40 0.12
Aqua
<0.15 1.43 0.06
0.83 No
6 of 14
3.1.2. Criterion 2: Correlation
179
Overall, the full MODIS and AERONET AOD datasets were highly correlated with Pearson
180
correlation coefficients (Figure 2) and thereby satisfied criterion 2. In Figure 1, the MODIS AOD and
181
AERONET AOD do appear to be highly correlated, which is consistent with the calculated
182
correlations shown in Figure 2. The Pearson correlation coefficients at 10 km resolution ranged from
183
0.95 to 0.97 for all AERONET AOD and AERONET AOD greater than or equal to 0.15, indicating high
184
correlation. The Pearson correlation coefficient at 10 km resolution for AERONET AOD less than 0.15
185
ranged from 0.71 to 0.76 (highly correlated). The 10 km data satisfied criterion 2. The Pearson
186
correlation coefficients of the 3 km data for all AERONET AOD and AERONET AOD greater than or
187
equal to 0.15 ranged from 0.89 to 0.93 (highly correlated). The Pearson correlation coefficients of
188
AERONET AOD less than 0.15 at 3 km resolution ranged from 0.64 to 0.66 (moderately correlated).
189
The lower correlation coefficients for AERONET AOD less than 0.15 were most likely due to the
190
higher density of data below an AOD of 0.15.
191
192
193
Figure 1. MODIS AOD versus AERONET AOD at the Bonanza Creek AERONET site with linear
194
regression as solid yellow line and the dashed gray line as the error envelope where the following
195
figures are for (a) Terra and Aqua 10 km combined, (b) Terra 10 km, (c) Aqua 10 km, (d) Terra and
196
Aqua 3 km combined, (e) Terra 3 km, (f) Aqua 3 km.
197
7 of 14
200
Figure 2. A comparison of the correlation coefficients for MODIS AOD versus AERONET AOD over
201
the Bonanza Creek AERONET site. Criterion 2 was satisfied if the correlation coefficient was greater
202
than 0.5 for AERONET AOD less than 0.15 and greater than 0.7 for all AERONET AOD and
203
AERONET AOD greater than 0.15.
204
205
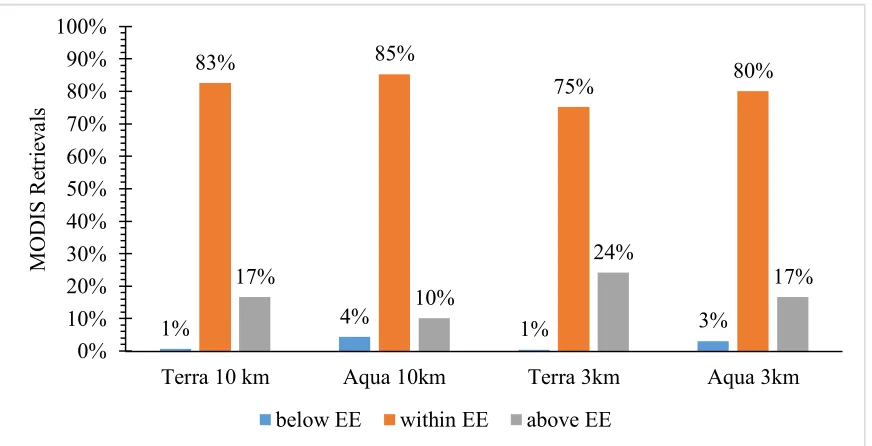
206
Figure 3. A comparison of the percentage of MODIS land retrievals over the Bonanza Creek
207
AERONET site from Aqua and Terra with 3 km and 10 km resolutions below, within, and above the
208
error envelope (EE). The MODIS Collection 6 error envelopes for land are listed in Table 1. Criterion
209
3 for validation is satisfied if 67% of MODIS retrievals are within the error envelope.
210
211
212
213
0.00
0.10
0.20
0.30
0.40
0.50
0.60
0.70
0.80
0.90
1.00
Terra &
Aqua 10 km
Terra 10 km Aqua 10 km
Terra &
Aqua 3 km
Terra 3 km Aqua 3 km
C
o
rr
el
at
io
n
C
o
ef
fi
c
ie
n
t
all AERONET AOD
AERONET AOD<0.15
AERONET AOD≥0.15
1% 4% 1% 3%
83% 85%
75% 80%
17%
10%
24%
17%
0% 10% 20% 30% 40% 50% 60% 70% 80% 90% 100%
Terra 10 km Aqua 10km Terra 3km Aqua 3km
M
O
D
IS
R
et
ri
ev
a
ls
8 of 14
3.1.3 Criterion 3: Error Envelope (EE)
214
More than 67% of the data from both AQUA and TERRA were within the error envelope (Figure 3).
215
The total percentage of the 10-km resolution and 3-km resolution combined Aqua and Terra data
216
within the EE were 83.3 % and 78.7%, respectively. The amount of data within the EE satisfied the
217
validation requirements for fraction of data within the EE used in various validation studies [10],
218
[11].
219
3.1.4 Error and Bias
220
The Aqua and Terra MODIS AOD datasets appeared to have negative bias (y-intercept) at both the
221
10 km (-0.035 to -0.020) and 3 km resolutions (-0.018 to 0.006). The negative bias, indicated by the
y-222
intercept, of MODIS AOD is consistent with the findings of Sherman et al. and Levy et al. ([7], [10].
223
Also, the RMSE of the Bonanza Creek 10 km data was slightly lower than that of the 3-km data. The
224
difference in RMSE was most likely due to the higher number of retrievals over land at 3 km
225
resolution. A validation study over Asia found that Aqua 3 km data was less reliable than the 10 km
226
data as only 55% of retrievals were within the estimated error [15]; however, global studies show that
227
MODIS AOD performance varies by region and terrain [7]. Due to the high correlation between
228
MODIS AOD and AERONET AOD, the high proportion of data points within the EE, and the
229
consistency of the results of the linear regression, the MODIS AOD 10 km and 3 km resolution data
230
can be used in Alaska when using the dark target land and ocean algorithm in Alaska. Based on the
231
overall performance of the 10 km and 3 km resolution data, it is recommended that only the Aqua 10
232
km data be used of all of the 10 km datasets. All of the 3 km MODIS AOD data are valid for use in
233
Alaska between the months of April and October.
234
Overall, the following collection 6 Dark Target land products were determined to be valid: 10 km
235
Aqua MODIS AOD, 3 km combined Aqua and Terra MODIS AOD, 3 km Aqua MODIS AOD, and 3
236
km Terra MODIS AOD. The 10 km Terra MODIS AOD could also be used at the discretion of the
237
researcher as at a significance value of 0.05, the slopes were considered to not be significantly different
238
with a p-value of 0.06. Potential sources of error include the incorrect identification of clouds in the
239
masking process of the dark target land algorithm. Another source of error could be the incorrect
240
assumption of the surface brightness by the dark target algorithm [7]. Another potential source of
241
error could be the use of the mode quality assurance value, which should be to individual QA values
242
when available; however, the error between MODIS Aqua AOD with QA 3 and mode QA 3 when
243
collocated with the Bonanza Creek site was approximately 0.
244
3.2. Barrow
245
MODIS AOD was derived for Barrow over the ocean using the Dark Target Ocean Algorithm. As
246
with the Bonanza Creek site, data was only available between the months of April and October;
247
therefore, this validation study only applies between those months. Table 4 lists the results of the
248
linear regression analysis of the relationship between MODIS AOD and AERONET AOD. White’s
249
test for heteroscedasticity revealed that the errors were heteroscedastic, therefore HC3 was used to
250
calculate the heteroscedasticity robust standard errors.
251
9 of 14
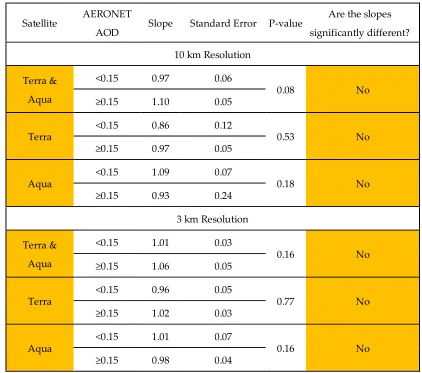
Table 4. Results of linear regression (τM= τA*m+b) and t-tests at a significance level of 0.05 for the
253
Barrow AERONET site.
254
255
3.2.1. Criterion 1: Linear Regression
256
All of the AOD data for the Barrow AERONET site satisfied the criterion that the slopes of the linear
257
regressions of MODIS AOD versus AERONET AOD greater than or equal to 0.15 and AERONET
258
AOD less than 0.15 could not be significantly different. The slopes of the least squares regressions of
259
the 10-km resolution MODIS AOD datasets versus AERONET AOD ranged from 0.96 to 0.97 (Table
260
4, Figure 2a, 2b, 2c), indicating low systematic bias (slopes of 1 would indicate no systematic bias).
261
The slopes from the least squares regression of the 3-km MODIS AOD data versus AERONET AOD
262
ranged from 1.00 to 1.02 for the full datasets (Table 4, Figure 2d, 2e, 2f). The greatest difference
263
between slopes of the 10-km and 3-km data stratified by AERONET AOD were 0.24 (combined Aqua
264
and Terra) and 0.28 (Aqua), respectively (Table 4). Based on t-tests with a significance level of 0.05,
265
the slopes of the all of the 10-km and 3-km data stratified by AERONET AOD were not significantly
266
different (p>0.08; Table 4). The proximity of the slopes to one indicated low systematic bias [17]. The
267
MODIS AOD datasets at 10 km and 3 km were positively biased with values ranging from 0.030 to
268
0.032 and 0.031 to 0.035, respectively, for the full datasets based on the y-intercepts of the linear
269
regressions [17].
270
Satellite AERONET
AOD Slope Standard Error P-value
Are the slopes
significantly different?
10 km Resolution
Terra &
Aqua
<0.15 0.97 0.06
0.08 No
≥0.15 1.10 0.05
Terra
<0.15 0.86 0.12
0.53 No
≥0.15 0.97 0.05
Aqua
<0.15 1.09 0.07
0.18 No
≥0.15 0.93 0.24
3 km Resolution
Terra &
Aqua
<0.15 1.01 0.03
0.16 No
≥0.15 1.06 0.05
Terra
<0.15 0.96 0.05
0.77 No
≥0.15 1.02 0.03
Aqua
<0.15 1.01 0.07
0.16 No
10 of 14
271
Figure 4. MODIS AOD versus AERONET AOD at the Barrow AERONET site with linear regression
272
as solid yellow line and the dashed gray line as the error envelope where the following figures are
273
for (a) Terra and Aqua 10 km combined, (b) Terra 10 km, (c) Aqua 10 km, (d) Terra and Aqua 3 km
274
combined, (e) Terra 3 km, (f) Aqua 3km.
275
276
Figure 5. A comparison of the correlation coefficients for MODIS AOD versus AERONET AOD over
277
the Barrow AERONET site. Criterion 2 was satisfied if the correlation coefficient was greater than 0.5
278
for AERONET AOD less than 0.15 and greater than 0.7 for all AERONET AOD and AERONET AOD
279
greater than 0.15.
280
0.00
0.10
0.20
0.30
0.40
0.50
0.60
0.70
0.80
0.90
1.00
Terra &
Aqua 10 km
Terra 10 km Aqua 10 km
Terra &
Aqua 3 km
Terra 3 km Aqua 3 km
C
o
rr
el
at
io
n
C
o
ef
fi
c
ie
n
t
11 of 14
3.2.2. Criterion 2: Correlation
281
Another requirement for validation is that MODIS AOD and AERONET AOD are highly correlated
282
[10]. For the Barrow site, MODIS AOD and AERONET AOD appeared to be moderately to highly
283
correlated with most points having AERONET AOD less than 0.2 (Figure 2). The correlation
284
coefficients for the full MODIS AOD datasets were greater than 0.7, indicating that MODIS AOD and
285
AERONET AOD were strongly. For AERONET AOD less than 0.15, MODIS AOD and AERONET
286
AOD were moderately correlated with correlation coefficients ranging from 0.51 to 0.58 (Figure 5).
287
For AERONET AOD greater than or equal to 0.15, correlation coefficients greater than 0.75 indicated
288
a strong correlation between MODIS AOD and AERONET AOD (Figure 5). The large difference in
289
Pearson correlation coefficients indicates that the strength of correlation is impacted by the few larger
290
values. Therefore, the correlation requirement for validation should be adjusted to the following:
291
MODIS AOD and AERONET AOD must be moderately to strongly correlated for AERONET AOD
292
less than 0.15, and they must be strongly correlated for all of AERONET AOD and AERONET AOD
293
greater than or equal to 0.15. A moderate to strong relationship was evident in the correlation
294
coefficients and Figure 4, therefore the recommended requirement and previous requirement of
295
correlation to determine validity were satisfied.
296
297
298
Figure 6. A comparison of the percentage of MODIS land retrievals over the Barrow AERONET site
299
from Aqua and Terra with 3 km and 10 km resolutions below, within, and above the error envelope
300
(EE). The MODIS Collection 6 error envelopes for land are listed in Table 1. Criterion 3 for validation
301
was satisfied if 67% of MODIS retrievals were within the error envelope.
302
3.2.3 Criterion 3: Error Envelope (EE)
303
The final requirement for validity is that more than 67% of the collocated data be within the error
304
envelope (Figure 6). The error envelope for Terra was assumed to be equal to that of Aqua, which
305
was expected to be the same [7]. The lowest percentage within the error envelope was 67.3 % for Terra
306
MODIS AOD at 3 km resolution, and the greatest percentage was 74.5% for Aqua MODIS AOD at 3
307
km resolution (Figure 6). When stratified by AERONET AOD, a larger percentage of the collocated
308
4.4%
3.9%
1.4%
0.9%
70.1%
73.2%
67.3%
74.5%
25.4%
22.9%
31.3%
24.7%
0%
10%
20%
30%
40%
50%
60%
70%
80%
90%
100%
Terra 10 km
Aqua 10 km
Terra 3 km
Aqua 3 km
M
O
D
IS
R
et
ri
ev
al
s
12 of 14
data was within the error envelope for AEROENT AOD less than 0.15 (67.8-74.9%) than that for
309
AERONET AOD greater than or equal to 0.15 (58.7-67.3%) (Figure 6). As the requirement of a
310
minimum of 67% was for the full dataset, the requirement was satisfied.
311
3.2.4 Error and Bias
312
Overall, all of the MODIS AOD collection 6 Dark Target Ocean products satisfied the requirements
313
for validity and are thus considered valid for use in Alaska between the months of April and October
314
over the ocean. Based on the linear regression over the Barrow and Bonanza Creek sites, the Barrow
315
data appeared to have less systematic bias than the Bonanza Creek site (Tables 3, 4). Also, RMSE for
316
the Barrow site was lower than that of the AERONET site, which is consistent with the slope that was
317
closer to unity. Potential sources of error could include incorrect assumptions in the Dark Target
318
algorithm, such as incorrect identification of clouds or surface brightness [7]. Another potential
319
source of error could be the use of the mode quality assurance value, which should be to individual
320
QA values when available; however, the error between MODIS Aqua AOD with QA 1, 2, 3 and mode
321
QA 1, 2, 3 when collocated with the Bonanza Creek site was approximately 0. Future analysis could
322
use weighted least squares regression and compare the results to the findings in this study. The use
323
of weighted least squares may result in a different estimation of bias and systematic error based on
324
the regression, but that would not impact the determination of validity.
325
4. Conclusions
326
The Aqua MODIS AOD 10 km and all of the 3 km MODIS AOD products are valid between the
327
months of April and October in Alaska. All of the collection 6 dark target ocean MODIS AOD
328
products are valid over the ocean in Alaska. The successful validation of the MODIS AOD at Bonanza
329
Creek and Barrow indicates that the collection 6 dark target MODIS AOD may be used to estimate
330
ground-level air quality in Alaska [4], [10]. Further research in Alaska should be done to model the
331
relationship between summertime particulate pollution and MODIS AOD. Care should be taken
332
when modeling the relationship between particulate pollution and MODIS AOD in Alaska because
333
the validity of MODIS AOD has been proven to vary by region [7], [10]. Therefore, a clear
334
relationship between MODIS AOD and particulate pollution should be evident prior to use outside
335
of the regions of the AERONET sites in Alaska and models should undergo significant testing and
336
evaluation for robustness. Other validation studies could be done using other satellite platforms to
337
determine which platform will work best in Alaska. Finally, if modeling of the relationship between
338
particulate pollution and MODIS AOD is successful, MODIS AOD could be used to monitor air
339
quality in the areas of Alaska that do not have ground-level air quality monitors, such as much of
340
rural Alaska.
341
Author Contributions: The research was conceptualized, and written by AM and SA. The study
342
design, and data analyses were undertaken by AM under the supervision of SA. Additionally, SA
343
provided project oversight, supervision and funding resources. Funding: This material is based in
344
part upon work supported by the Alaska NASA EPSCoR Program (NNX13AB28A).
345
Acknowledgments: Authors would like to acknowledge assistance from Pawan Gupta at NASA
346
Goddard Centre and resources from department of Civil and Environmental Engineering at
347
13 of 14
Conflicts of Interest: The authors declare no conflict of interest. The funding sponsors had no role in
349
the design of the study; in the collection, analyses, or interpretation of data; in the writing of the
350
manuscript, and in the decision to publish the results.
351
352
References
353
[1] C. A. Pope and D. W. Dockery, Health Effects of Fine Particulate Air Pollution: Lines that
354
Connect, Journal of the Air & Waste Management Association 56(6) (2006): 709–742,
355
doi:10.1080/10473289.2006.10464485.
356
[2] N. Fann, et al., Estimating the National Public Health Burden Associated with Exposure to
357
Ambient PM2.5 and Ozone, Risk Analysis 32(1) (2012): 81–95,
doi:10.1111/j.1539-358
6924.2011.01630.x.
359
[3] D. Ware, et al., Sources and perceptions of indoor and ambient air pollution in rural Alaska,
360
Journal of Community Health 38(4) (2013): 773–780, doi:10.1007/s10900-013-9678-9.
361
[4] P. Gupta, et al., Multi year satellite remote sensing of particulate matter air quality over
362
Sydney, Australia, International Journal of Remote Sensing 28(November 2014) (2007): 4483–
363
4498, doi:10.1080/01431160701241738.
364
[5] S. Dey and L. Di Girolamo, A decade of change in aerosol properties over the Indian
365
subcontinent, Geophysical Research Letters 38(14) (2011): 1–5, doi:10.1029/2011GL048153.
366
[6] Y. Xie, et al., Daily Estimation of Ground-Level PM2.5 Concentrations over Beijing Using 3
367
km Resolution MODIS AOD, Environmental Science and Technology 49(20) (2015): 12280–
368
12288, doi:10.1021/acs.est.5b01413.
369
[7] R. C. Levy, et al., The Collection 6 MODIS aerosol products over land and ocean, Atmospheric
370
Measurement Techniques 6 (2013): 2989–3034, doi:10.5194/amt-6-2989-2013.
371
[8] A. M. Sayer, et al., Validation and uncertainty estimates for MODIS Collection 6 “deep Blue”
372
aerosol data, Journal of Geophysical Research Atmospheres 118(14) (2013): 7864–7872,
373
doi:10.1002/jgrd.50600.
374
[9] M. Petrenko, C. Ichoku, and G. Leptoukh, Multi-sensor Aerosol Products Sampling System
375
(MAPSS), Atmos. Meas. Tech 5 (2012): 913–926, doi:10.5194/amt-5-913-2012.
376
[10] J. P. Sherman, et al., An Evaluation of MODIS-Retrieved Aerosol Optical Depth over a
377
Mountainous AERONET Site in the Southeastern US, Aerosol and Air Quality Research 16
378
(2016): 3243–3255, doi:10.4209/aaqr.2015.09.0568.
379
[11] C. Ichoku, et al., A spatio-temporal approach for global validation and analysis of MODIS
380
aerosol products, Geophysical Research Letters 29(12) (2002): 1–4, doi:10.1029/2001GL013206.
381
[12] L. A. Remer, Validation of MODIS aerosol retrieval over ocean, Geophysical Research Letters
382
29(12) (2002): 2–5, doi:10.1029/2001GL013204.
383
[13] T. F. Eck, et al., Wavelength dependence of the optical depth of biomass burning, urban, and
384
desert dust aerosols, Journal of Geophysical Research 104(D24) (1999): 31333–31349,
385
doi:10.1029/1999JD900923.
386
[14] B. N. Holben, et al., AERONET - A federated instrument network and data archive for aerosol
387
characterization, Remote Sensing of Environment 66(1) (1998): 1–16,
doi:10.1016/S0034-388
4257(98)00031-5.
389
[15] J. E. Nichol and M. Bilal, Validation of MODIS 3 km resolution aerosol optical depth retrievals
390
over Asia, Remote Sensing 8(4) (2016), doi:10.3390/rs8040328.
391
[16] J. S. Long and L. H. Ervin, Using heteroscedasticity consistent standard errors in the linear
14 of 14
regression model, The American Statistician 54(May) (2000): 217–224, doi:10.2307/2685594.
393
[17] D. A. Chu, et al., Validation of MODIS aerosol optical depth retrieval over land, Geophysical
394
Research Letters 29(12) (2002): MOD2-1-MOD2-4, doi:10.1029/2001GL013205.
395
![Table 1. Estimated error for MODIS collection 6 dark target algorithm [7].](https://thumb-us.123doks.com/thumbv2/123dok_us/1025918.1602721/2.595.68.506.436.517/table-estimated-error-modis-collection-dark-target-algorithm.webp)