www.atmos-meas-tech.net/9/3293/2016/ doi:10.5194/amt-9-3293-2016
© Author(s) 2016. CC Attribution 3.0 License.
A surface reflectance scheme for retrieving aerosol optical depth
over urban surfaces in MODIS Dark Target retrieval algorithm
Pawan Gupta1,2, Robert C. Levy2, Shana Mattoo2,3, Lorraine A. Remer4, and Leigh A. Munchak2,3
1Goddard Earth Sciences Technology And Research (GESTAR), Universities Space Research Association (USRA),
Columbia, MD, USA
2NASA Goddard Space Flight Center, Greenbelt, MD 20771, USA 3Science Systems and Applications, Inc, Lanham, MD 20709, USA
4JCET, University of Maryland – Baltimore County, Baltimore, MD 21228, USA Correspondence to:Pawan Gupta ([email protected])
Received: 25 December 2015 – Published in Atmos. Meas. Tech. Discuss.: 18 January 2016 Revised: 28 June 2016 – Accepted: 29 June 2016 – Published: 26 July 2016
Abstract. The MODerate resolution Imaging Spectrora-diometer (MODIS) instruments, aboard the two Earth Ob-serving System (EOS) satellites Terra and Aqua, provide aerosol information with nearly daily global coverage at moderate spatial resolution (10 and 3 km). Almost 15 years of aerosol data records are now available from MODIS that can be used for various climate and air-quality applications. However, the application of MODIS aerosol products for air-quality concerns is limited by a reduction in retrieval ac-curacy over urban surfaces. This is largely because the ur-ban surface reflectance behaves differently than that assumed for natural surfaces. In this study, we address the inaccu-racies produced by the MODIS Dark Target (MDT) algo-rithm aerosol optical depth (AOD) retrievals over urban ar-eas and suggest improvements by modifying the surface re-flectance scheme in the algorithm. By integrating MODIS Land Surface Reflectance and Land Cover Type information into the aerosol surface parameterization scheme for urban areas, much of the issues associated with the standard algo-rithm have been mitigated for our test region, the continen-tal United States (CONUS). The new surface scheme takes into account the change in underlying surface type and is only applied for MODIS pixels with urban percentage (UP) larger than 20 %. Over the urban areas where the new scheme has been applied (UP > 20 %), the number of AOD retrievals falling within expected error (EE %) has increased by 20 %, and the strong positive bias against ground-based sun pho-tometry has been eliminated. However, we note that the new retrieval introduces a small negative bias for AOD values less
than 0.1 due to the ultra-sensitivity of the AOD retrieval to the surface parameterization under low atmospheric aerosol loadings. Global application of the new urban surface param-eterization appears promising, but further research and anal-ysis are required before global implementation.
1 Introduction
In large concentrations, aerosols near the surface (also called particulate matter or PM) are air pollutants. As urbanization and industrialization have amplified many folds during the last few decades (United Nations, 2014), air quality has be-come a global public health concern, especially in densely populated urban areas. In some cities, urban PM concentra-tions are at dangerous levels, 5 to 10 times higher than World Health Organization (WHO) guidelines. Although urban ar-eas only represent about half a percentage of the total Earth’s surface and about 3 % of Earth’s land surface, half of the hu-man population lives in these areas. According to the new projections, two-thirds of the human population will live in urban areas by 2025; therefore, it is critical to monitor air quality (aerosol or PM), especially as relating to human ex-posure in populated regions around the world.
metropolitan-scale mapping, they are not dense enough for local or neighborhood scales. Also, about 30 % of counties in the USA are without any PM monitoring. In contrast, most other countries, especially in developing nations, have few or no surface PM monitors and cannot measure the urban pop-ulation’s exposure to PM.
In the last few decades, satellites are increasingly being used to offer a global perspective on many atmospheric vari-ables. One of these is aerosol optical depth (AOD), which is a measure of aerosol loading, integrated through the at-mospheric column. As retrievals of AOD are increasing in their spatial resolution, coverage and accuracy, environmen-tal monitoring agencies are increasingly looking to satellites to cover the gaps in aerosol monitoring. Although it is not straightforward, many studies (Wang and Christopher 2003; Gupta et al., 2006; Gupta and Christopher, 2009; Hoff and Christopher, 2009; van Donkelaar et al., 2010, 2015; Liu et al., 2010) are trying to link satellites retrievals of AOD to surface concentrations of PM2.5or PM10 (PM having
aero-dynamic diameters of 2.5 or 10 micrometers, respectively). In addition to its role in air quality and public health, aerosols are considered an essential climate variable (e.g., IPCC, 2007), and remote sensing of AOD has evolved, pri-marily, to address climate-related questions. Decisions about aerosol products, product resolution and tolerance of poorer quality retrievals have been made to maximize the effective-ness of these products for climate, not air-quality, applica-tions. For example, poor quality retrievals over urban sur-faces that represent so little of the Earth’s surface have a negligible effect on the climate question, and so retrieval al-gorithms originally were tuned to ignore the special nature of the urban environment. There are several satellite-based AOD products and each combination of satellite/retrieval al-gorithm has its own advantages and limitations. One satel-lite/algorithm pair with a climate-oriented aerosol prod-uct is the MODerate resolution Imaging Spectroradiometer (MODIS) Dark Target (MDT) algorithm. The MDT algo-rithm is mature, having been developed 20 years ago (Kauf-man et al., 1997b; Tanré et al., 1997) for retrieval of AOD over primarily vegetated (e.g., dark) land surfaces and re-mote oceans. It is now running as Collection 6 (Levy et al., 2007a, b, 2013), and the standard AOD product (nominal 10 km spatial resolution) is generally unbiased over global land regions, a requirement for climate applications.
The standard MDT product, while well suited to answer climate questions, has many shortcomings when used for air-quality monitoring. The first, and most important, is that PM is defined as the concentration of particles in the surface layer of the atmosphere where people can be affected by the pol-lution, while the MDT product measures the aerosol loading (AOD), integrated from this surface layer all the way to the top of the atmosphere. Correlation between column AOD and surface PM depends on the vertical profile of aerosol con-centration, which is not measured by MODIS. However, the other problem is that the MDT retrieval, while nearly
un-biased compared with the full set of sun photometer (SP) measurements in the Aerosol Robotic Network (AERONET) database, has strong biases for particular surface types.
MDT over land was designed for retrieval over vegetated and other “dark” surface regions. MDT does not provide aerosol retrieval over very bright surface (i.e., desert) and over snow and ice regions. In addition, several validation studies have shown that MDT AOD retrievals over urban area are positively biased with respect to AERONET AODs (Levy et al., 2010; Jethva et al., 2007; Hyer et al., 2011; Gupta et al., 2013; Munchak et al., 2013). These studies have shown that the major source of bias in the MDT over cities is that the city surface does not behave as a vegetated “dark” target. Several other research attempts have been made to change the surface scheme in the MDT for particular urban regions and produce better AOD retrievals for those specific cities (de Almeida Castanho et al.,2007, 2008; Li et al., 2005; Wong et al., 2011; Zha et al., 2011; Li et al., 2012; Escribano et al., 2014; Jäkel et al., 2015). Instead of a retrieval focused on only one city, we seek a surface parameterization that is valid for cities across the globe. This will lead to more ac-curate AOD retrievals, which can be utilized for air-quality applications and research, including estimating urban popu-lation exposure to aerosols. In this paper, we have developed a surface characterization for cities in the continental US (CONUS) region, applied it to the MDT algorithm and eval-uated the results. In Sect. 2 we introduce MODIS, the MDT algorithm and its current limitations over cities. Section 3 discusses study region and various data sets utilized in this study. Section 4 describes the new surface parameterization, whereas results and impact of new surface scheme on MDT AOD retrievals over CONUS regions are discussed in Sect. 5. Section 6 covers implications of the new surface scheme over global regions and its limitations and challenges. We summa-rize the results and future directions in Sect. 7.
2 MODIS and the Dark Target algorithm
MODIS sensors have been observing the Earth system (at-mosphere, land and ocean) on board two satellites, since 1999 on Terra and since 2002 on Aqua. MODIS observes top-of-the-atmosphere (TOA) radiance in 36 spectral bands, which are used to derive geophysical information about at-mosphere, land and ocean. The spatial resolution varies from 250 m to 1 km depending on spectral band. The large swath width of MODIS (∼2300 km) enables global coverage in 1– 2 days. Data are separated into 5 min segments known as granules.
par-ticular aspect of the combined Earth’s system. Specifically, the MDT is used to derive global aerosol properties under cloud/snow/ice-free conditions.
The theoretical basis of the MDT algorithm has remained constant from its original at-launch version, although indi-vidual sub-modules have been continuously evolving. While a summary of the algorithm is provided here, the reader is encouraged to read the references for details of the algorithm assumptions and structure and its evolution through different versions over time (Remer et al., 2005; Levy et al., 2007a, b, 2013).
The five main components of the MDT aerosol retrieval algorithm are (1) pixel selection and aggregation, including cloud masking and other filtering; (2) separating the sur-face from the atmosphere; (3) assumptions about the aerosol (e.g., aerosol models); (4) matching observed TOA spec-tral reflectance to lookup tables; and (5) inferring the am-bient aerosol conditions (model weightings and total AOD). There are two separate retrievals, one over ocean and one over land, and the results of these retrievals and associated diagnostics are available in a single data file. Each retrieval result and each diagnostic are independent science data sets (SDSs) within the produced file. In production, collectively these SDSs within the single file are known as the MxD04 product, where x is “O” for Terra and “Y” for Aqua, and the “04” denotes the level 2 aerosol products. Products (SDSs) include the total AOD (at 0.55 µm), spectral AOD and diag-nostics describing the choice of retrieval solutions, plus qual-ity assurance criteria and expected confidence in the retrieved AOD. The standard MxD04 product, known as MxD04_L2, is provided at a nominal (nadir) spatial resolution of 10 km. In the recent release of MODIS Collection 6 (C6) data ver-sion, there is also a MxD04_3K product, which is at 3 km spatial resolution (nadir) and available globally. The standard C6 products have gone through initial validation (e.g., Levy et al., 2013; Munchak et al., 2013; Remer et al., 2013).
The MODIS retrieval codes are run in an operational en-vironment to create C6 products. This includes infrastruc-ture for managing file formats and also for processing entire granules of MODIS data. In this work, we also make use of the so-called “stand-alone” version of the MODIS Dark Tar-get (S-MDT) retrieval code (e.g., Levy and Pinker, 2007). The S-MDT is stripped of all routines for cloud masking, pixel selection and pixel aggregation, instead operating on a pixel-by-pixel basis. Inputs are a single set of TOA spec-tral reflectance values, plus sun–satellite geometry and geo-location. Outputs are the retrieved AOD and most of the diag-nostics contained in the standard output. Since the standard C6 data (e.g., the 10 km retrievals) include the TOA spec-tral reflectance used for each retrieved AOD value, the data provided in the C6 output file (e.g., MxD04_L2) can be recy-cled through the S-MDT algorithm to retrieve the same AOD value as provided within the C6 product. Thus, the S-MDT can be easily modified to test different assumptions within the retrieval, including surface reflectance assumptions. The
insights gleaned from the S-MDT exercises can then be trans-ferred back to modify the full (operational) retrieval code, and tests (and statistics) can be performed for global data. 2.1 MDT surface characterization and urban aerosol
retrievals
The land surface is too variable to apply an explicit model to describe its spectral optical properties. Thus MDT uses an empirical parameterization based on only three MODIS bands. Kaufman et al. (1997a, 2002) noted that for most veg-etated and dark-soiled land surfaces, observations showed that surface reflectance in a blue wavelength (0.47 µm) and red wavelength (0.65 µm) were about quarter and one-half of the surface reflectance in a shortwave infrared (SWIR, 2.1 µm) wavelength band, respectively. With such a SWIR-to-visible (SWIR–VIS) surface relationship theoretically ex-isting on a global scale (e.g., Kaufman et al., 2002), one can construct three equations and three unknowns using the satellite-measured reflectance at the three wavelengths to separate the surface and aerosol contributions (Levy et al., 2007b).
The current operational version (C6) of the MDT algo-rithm is still based on the SWIR–VIS surface relationships, but it also adjusts the relationship for vegetation amount and geometry as determined by a variant of the normalized dif-ference vegetation index based on SWIR bands (NDVISWIR)
and the scattering angle of the solar/surface/satellite observ-ing geometry. The NDVISWIRis defined as
NDVISWIR=
ρ1m.24−ρm2.12
ρ1m.24+ρm2.12, (1) where ρ1m.24andρ2m.12 are the measured reflectances by MODIS at wavelengths 1.24 and 2.12 µm, respectively. NDVISWIRis less affected by aerosols in the atmosphere than
the traditional NDVI based on red and near-infrared channels (Levy et al., 2007b).
op-erated in Washington DC–Maryland during 2011 to identify the urban high bias and link that bias to the urban percentage (UP) around each AERONET site. While there have been attempts to improve the MDT aerosol retrieval on the local or even regional scale, no attempt has been made to date to develop a general improved surface reflectance parame-terization that can be applied to the global retrieval. In this study, we develop a new SWIR–VIS scheme that accounts for NDVISWIRand scattering angle but also accounts for the
UP.
3 Data and study region
We explore whether MDT surface parameterization can be modified to account for urban surface properties. We start with the research S-MDT version (Levy and Pinker, 2007; and http://darktarget.gsfc.nasa.gov) and develop a replace-ment SWIR–VIS parameterization that includes dependence on UP. To develop the replacement SWIR–VIS parameteri-zation, we rely on two data sets. These are the MODIS Land Cover Type and the MODIS Land Surface Reflectance prod-ucts. The MDT algorithm with the replacement SWIR–VIS parameterization, we denote as the C6-Urban (C6U) version. To test the C6U retrieval, we compare the retrieved AOD with the SP measurements taken at standard AERONET sites, as well as AERONET’s DRAGONs during the Mary-land deployment of the “Deriving Information on Surface conditions from Column and Vertically Resolved Observa-tions Relevant to Air Quality” (i.e., DISCOVER-AQ) (Hol-ben et al., 2010) experiment.
3.1 AERONET
AERONET is NASA’s global ground network of SPs that make measurement of direct transmitted solar light during daylight hours (Holben et al., 1998), and from that mea-surement we derive spectral AOD. There are currently about 300 sites around the globe with more than 1 year of regular observations; in addition, dense DRAGONs, while more lim-ited in time, make dense measurements over urban/suburban areas. DRAGONs have tended to be deployed in support of large field experiments, including DISCOVER-AQ.
The spectral measurements from the SPs are used to de-rive AODs in respective spectral bands. The typical fre-quency of measurements is every 15 min and the spectral bands are generally centered at 340, 380, 440, 500, 675, 870 and 1020 nm. Here we use the Ångström coefficient to inter-polate AERONET AOD to 550 nm. AERONET data prod-ucts are available as unscreened (level 1.0), cloud screened (level 1.5) and cloud screened and quality assured (level 2.0). In this study, level 2.0 AERONET AOD data are considered as ground truth to validate the satellite-retrieved AOD data. The reported uncertainty in AERONET AOD is of the order of 0.01–0.02 (Eck et al., 1999). There are about 135 CONUS
AERONET stations collocated with MODIS Aqua for the 2003 to 2012 time period. This includes 39 DRAGON sites, permanent AERONET sites and temporary AERONET sites operated for different periods between 2003 and 2012. Only the sites located over land are considered in this study.
The DRAGON sites in Maryland DISCOVER-AQ de-ployment were operated for about 6 weeks from 1 July to 15 August 2011. The sites were located in the Washington DC–Baltimore metropolitan area. The network provided use-ful AOD measurements over urban, agricultural, coastal and mountain landscapes over the Washington DC metropolitan area.
3.2 MODIS Land Cover Type
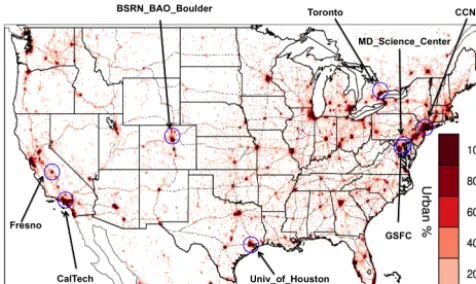
The MODIS Land Cover Type product (MCD12Q1) for the year 2011, at 500 m resolution, has been used to identify ur-ban surfaces in the new surface scheme. This is a yearly prod-uct, based on a trained classification algorithm that uses five different classification schemes (Friedl et al., 2010), and is derived using observations from both MODIS sensors. There are 17 land cover classes as defined by the International Geosphere-Biosphere Program (IGBP). The land cover class defined as “urban and built-up area” has been extracted and UP at 0.1×0.1◦resolution (approximately equivalent to the 10 km MODIS AOD product resolution) is calculated. Fig-ure 1 shows the map of UP for the CONUS region. This map of UP has been used in the C6U algorithm to define and ap-ply the new surface scheme for each MODIS 10 km AOD retrieval. We have done a separate analysis (not shown in the paper) which demonstrates that urban land use at 10 km2 spatial resolution only changes by 1–3 % over a period of 10 years. Because we are working with range of urban per-cent, as opposed to a sharp threshold, this should not impact our surface characterization from year to year. Therefore, we decided to use UP from the year 2011 to apply on MODIS records from 2003 to present.
3.3 MODIS Land Surface Reflectance
The surface parameterization in the MDT algorithm was based on performing atmospheric correction of MODIS-measured reflectance near AERONET sites, which led to formulation of the empirical SWIR–VIS relationships (e.g., Levy et al., 2007b, 2013). Rather than repeating this exer-cise, we rely on the MODIS-derived land spectral surface reflectance product because it is available and has been vali-dated with similar atmospheric correction exercises. Specifi-cally, we use the MODIS 8-day, clear-sky surface reflectance product (MOD09A1/MYD09A1; Vermote and Kotchenova, 2008) for the first seven bands of MODIS, which are gridded at 500 m resolution. These are same bands used for the MDT aerosol retrieval.
Figure 1. The urban percentage map for the continental United States derived from MODIS Land Cover Type product (MCD12Q1) at 0.1×0.1◦resolution to be used in the new surface characteriza-tion scheme inside the MODIS DT AOD retrieval algorithm. The circles show individual AERONET stations for which results are presented in Fig. 5 and Table 4. Dotted lines on the map show ma-jor highways.
Table 1. Uncertainty in surface reflectance product (MYD09) as obtained by validation exercise and reported at http://landval.gsfc. nasa.gov/ (accessed on 14 May 2016).
Uncertainty in surface reflectance
AERONET Site Band 1 Band 3 Band 7 (red) (blue) (NIR)
GSFC 0.0055 0.0118 0.0009
MD_Science_Center 0.0094 0.0214 0.0009 BSRN_BAO_Boulder 0.0025 0.0068 0.0042
Bondville 0.0036 0.0096 0.0035
and performing generic atmospheric corrections (estimating aerosol type and AOD) to obtain surface reflectance values. These pixels are selected for low view angle, the absence of clouds or cloud shadow, and low aerosol loading. Pixels identified as snow/ice, adjacent to cloud, fire, cirrus, inland water or high aerosols loading are excluded. This surface reflectance product is officially validated as a stage 3 prod-uct. Validation of the MxD09A1 product has been performed over 150 AERONET sites (http://modis-sr.ltdri.org) by us-ing AERONET measurements (spectral AOD, water vapor) to perform a detailed atmospheric correction. Overall, 87 % of “good” pixels of red band reflectance are within the er-ror bars defined as±(0.005+5 %) (http://modis-sr.ltdri.org/ pages/validation.html). A “good” quality surface reflectance retrieval is determined when the atmosphere has no cloud, cloud shadow or high aerosol loading.
Validation results show that the red and SWIR bands are more accurate than the blue band, and uncertainty increases over urban areas in all bands, but especially in the blue. Early validation results suggested that for urban surfaces, typified
by Hamburg, Germany, the percentage of surface reflectance retrievals falling within the above stated error bars were 70 % and 100 % for the red and SWIR channels, respectively, but less than 10 % for the blue channel (Vermote and Kotchen-ova, 2008). Also, this site exhibited a consistent high bias of 0.01 reflectance in band 4 (0.54 µm). However, Vermote and Kotchenova (2008) explain that the Hamburg site suffered from a very small sample size (only 2 clear days during the month of study). Non-urban sites had much greater sample sizes and much better validation statistics, although overall the blue channel still lagged behind the other channels with only 50 % of retrievals falling within the error bars (Ver-mote and Kotchenova, 2008). More recent validation pro-vided from the web site (http://landval.gsfc.nasa.gov/) con-tinues to show the blue channel reflectance having greater uncertainty than either red or SWIR, especially for urban sites. Table 1 lists the validation results and uncertainty in surface reflectance for three bands at four sites. Bondville is the most rural of the sites. MD_Science_Center in down-town Baltimore is the most urban. The blue band always has the highest uncertainty, which increases as the surface tran-sitions from rural to urban.
Despite these uncertainties, we will make use of all three wavelengths bands, because the MxD09A1 provides the most complete characterization of surface reflectance at the spatial scales necessary for our study. We are fully aware that the high uncertainty in the blue band can lead to errors in sur-face reflectance ratios and thus to errors in retrieved AODs, specifically under low aerosol conditions when the algorithm is most sensitive to accurate surface reflectance values. Fur-ther discussion of the MxD09A1 product from the perspec-tive of this study is provided in Sect. 7.
4 Developing the new surface reflectance scheme For the MDT algorithm to include an urban surface re-flectance scheme, it must
1. reduce the bias between MDT retrievals and SP mea-surements in urban areas;
2. improve the retrievals in urban areas without degrading retrieval quality in non-urban areas;
3. have an operational path that identifies whether or not to apply the new scheme;
4. slip into the structure of the existing operational algo-rithm without requiring extensive additional modifica-tions.
correction could be applied. These local relationships have not been shown to represent the SWIR–VIS relationship over larger areas. Relationships derived in this limited database are skewed towards surface characteristics of AERONET lo-cations.
By using the MODIS Land Surface Reflectance product (MOD09) as described in Sect. 3, we have a data set with global coverage, as opposed to atmospheric correction exer-cises for individual sites (which use observed ground-based aerosol properties to derive surface reflectance).
To create our urban surface parameterization, we start with the MOD09 product in its native resolution (e.g., 500 m pix-els). The MODIS 500 m resolution surface reflectance values are quality controlled and averaged into a 0.1×0.1◦ grid, roughly equivalent to the MDT 10 km AOD retrieval. Thus instead of point measurements of surface reflectance, we now have spatial maps of surface reflectance covering the entire study region. At the same time, we used the offline land cover database (MCD12Q1) to identify which pixels were urban. The UP is defined as the percentage of pixels (500 m) iden-tified as urban land cover type within each 0.1×0.1◦degree grid.
We expect that different cities will exhibit different sur-face reflectance relationships for the same UP, because the natural vegetation background is different. Therefore, we employ both UP and NDVISWIR to define four categories
of surface type. For example, Brooklyn (New York), with its sidewalk plantings of deciduous trees, may look differ-ent than Los Angeles (California), which uses palm tree plantings for its sidewalks. These four categories are sepa-rated into low vegetation and high UP (NDVISWIR< 0.20 and
UP > 50 %), low vegetation and low UP (NDVISWIR< 0.20
and 20 % < UP < 50 %), high vegetation and relatively low UP (NDVISWIR> 0.20 and 20 % < UP < 70 %) and high
vege-tation and high UP (NDVISWIR> 0.20 and UP > 70 %). These
bin thresholds were chosen to optimize the correlation coef-ficient between wavelengths in each bin. We have also re-stricted this analysis to only over the urban areas by select-ing pixels with UP larger than 20 % so that the retrieval over natural surfaces does not contribute to the formulation of the parameterization. For UP < 20 %, we use the C6 assumptions for surface reflectance (using NDVISWIRonly).
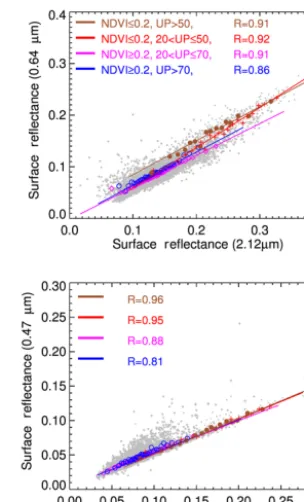
Figure 2 provides the surface reflectance spectral relation-ships between SWIR and VIS, defined for the four differ-ent categories based on the combinations of NDVISWIRand
UP. The four regression lines in the figures are calculated for each of the four categories using bins of equal number of points. We still derive the regression coefficients from the cloud of points (shown as gray color) but bin the data to help visualize the differences from regime to regime. We note that the slopes of the regression between the blue and red wave-lengths are not strongly dependent on differences in the UP or the NDVISWIR, as long as UP > 20 %. However, the
re-gressions between the red and SWIR wavelengths are indeed dependent on the nuances of the urban surface. The values
Figure 2.The 0.65 µm vs. 2.12 µm surface reflectance (top panel) and the 0.47 µm vs. 0.65 µm surface reflectance (bottom) for four different combinations of NDVISWIRand UP values. Each
combi-nation of NDVISWIRand UP values is color-coded and plotted as a
different symbol. The standard regression using least absolute devi-ation method applied and the resulting regression lines are plotted. The regression parameters corresponding to each bin of NDVISWIR
and UP are presented in Table 2 and the linear correlation coefficient (R) is presented in the figure. These four regression lines represent the new surface scheme for revised urban aerosol retrieval in the MDT.
of the regression statistics (“slope” and “yint”) for each of the four categories are given in the Table 2. Here slope and intercept are calculated based on the least absolute deviation method to avoid the extreme outliers. Mean of the absolute deviation (AbsStd) of the results andY (result is calculated VIS reflectance andY is original VIS reflectance) is also pro-vided in Table 2. This provides a quantitative indicator of un-certainties in surface reflectance of visible bands in the new surface scheme.
The regression statistics provide the information needed to relate the surface reflectance (ρs)at 0.65 and 0.47 µm to that at 2.12 µm. We take into account the effects of geometry by relying on the Levy et al. (2007b) parameterization for scattering angle,θ.
ρ0s.65=ρ2s.12·M0.65 2.12
+b0.65
2.12, (2)
ρ0s.47=ρ0s.65·M0.47 0.67
+b0.47
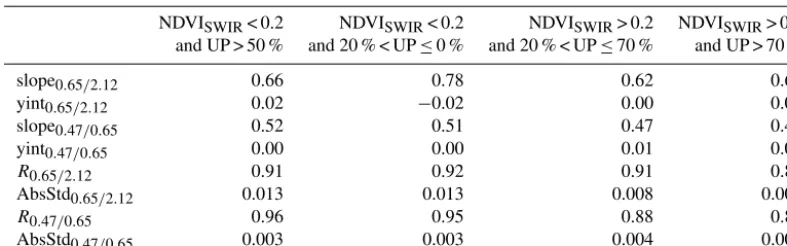
Table 2.Regression coefficients for the new surface scheme introduced in C6U MDT algorithm.
NDVISWIR< 0.2 NDVISWIR< 0.2 NDVISWIR> 0.2 NDVISWIR> 0.2
and UP > 50 % and 20 % < UP≤0 % and 20 % < UP≤70 % and UP > 70 %
slope0.65/2.12 0.66 0.78 0.62 0.65
yint0.65/2.12 0.02 −0.02 0.00 0.00
slope0.47/0.65 0.52 0.51 0.47 0.48
yint0.47/0.65 0.00 0.00 0.01 0.01
R0.65/2.12 0.91 0.92 0.91 0.86
AbsStd0.65/2.12 0.013 0.013 0.008 0.008
R0.47/0.65 0.96 0.95 0.88 0.81
AbsStd0.47/0.65 0.003 0.003 0.004 0.006
where
M0.65/2.12=slope0(NDVI.65/2.,12UP)+0.002·θ−0.27, (4)
b0.65/2.12=yint0(NDVI.65/2.,12UP)−0.00025·θ−0.033, (5)
M0.47/0.67=slope(0NDVI.47/0.,67UP),and (6)
b0.47/0.67=yint(0NDVI.47/0.,67UP). (7)
Slope and yint are the regression constants for particular wavelengths, NDVISWIRand UP, found in Table 2.
As shown in Table 2, the new slopes of SWIR–VIS over urban areas are significantly higher than those assumed in the C6 algorithm for global application, which is consistent with other studies (i.e., Levy et al., 2007b; de Almeida Castanho et al., 2007). The red–SWIR ratios are also higher for less-vegetated areas (NDVISWIR< 0.2) than for more-vegetated
areas (NDVISWIR> 0.2).
The new surface scheme is expected to provide better sur-face reflectance estimates over urban areas than the existing operational scheme (i.e., C6). Figure 2 shows very tight rela-tionships between SWIR–VIS reflectances, but even the pres-ence of the small amount of scatter in the correlation can cause errors in certain conditions and seasons. Bidirectional reflectance function (BRDF) effects over urban surfaces and other factors as discussed in Levy et al. (2007b) may also introduce error. Because surface reflectance dominates the TOA signal for low aerosol conditions (AOD < 0.1) as com-pared to high aerosol loading (AOD > 0.4), relative uncertain-ties in retrieving AOD are larger under clean conditions.
UP is the only new parameter added to the surface scheme. This is a globally available parameter calculated from a stdard MODIS Land Product (MCD12Q1) and is updated an-nually. The C6U algorithm inputs UP and uses this parameter to decide whether to apply the old or the new surface param-eterization. Dependence on UP assures that there will be no changes to the retrieved aerosol products for non-urban sur-faces (UP < 20 %).
We have developed this surface scheme using data from the continental USA, expecting the scheme to be optimized for this region. Global implementation may be challenging and we discuss these challenges in Sect. 6. Also, we note
that this application of UP surface correction is applied only for the MODIS 10 km aerosol product. We discuss future ap-plication to 3 km retrieval in Sect. 6.
5 Evaluation of C6U retrieval
5.1 Collocation and analysis strategies
un-certainties, the following statistical parameters were calcu-lated (Hyer et al., 2011).
Root mean square error (RMSE) and mean bias is esti-mated using Eqs. (4) and 5.
RMSE=
r 1 n
X
(AODAERO−AODMODIS)2 (8)
Bias=arithmatic mean(AODMODIS−AODAERO) (9)
Expected error (EE) (Remer et al., 2005) for AOD retrieved over land, as given by the MODIS science team through val-idation exercises, is presented in Eq. (6).
EE= ±(0.05±15%) (10) The percentage of retrievals, falling within the envelope of EE, as compared to AERONET AODs is given by Eq. (7).
EE %=AODAERO− |EE| ≤AODMODIS≤AODAERO+ |EE|, (11)
where the AODAERO is AOD from AERONET, and
AODMODIS is the retrieved value from MODIS (either C6
or C6U version). Note that the MODIS AOD is reported at 0.55 µm, so we perform interpolation (quadratic on log–log scale) on the AERONET data.
In addition, we have computed linear regression statistics, including correlation coefficient (R), regression coefficients (slope and intercepts) and number of data points (N).
Note that MODIS also reports AOD values at 0.47 and 0.67 µm wavelengths, but these are not independent pieces of information and are determined by the retrieval solution. The spectral dependence of the retrieval (e.g., Ångström ex-ponent) is interesting, but we choose not to validate it in this study.
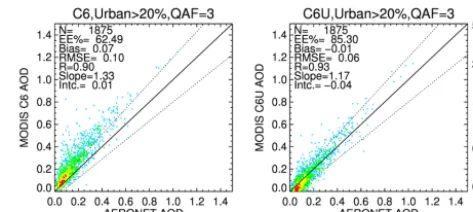
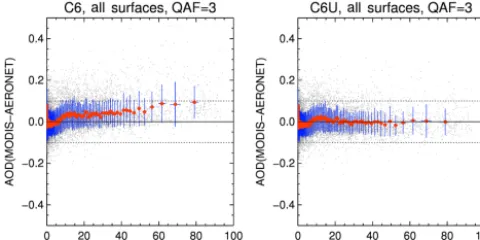
5.2 Validation: comparison with AERONET/DRAGON Figure 3 shows 2-D density scatter plots, representing all col-locations of MODIS-retrieved AOD and AERONET SP mea-sured AOD over CONUS urban sites. Here, only retrievals where UP > 20 % and the retrieval quality assurance flag in-dicates “very good quality” (QAF=3; Levy et al., 2014) are shown. Figure 3 (left panel) represents the MODIS C6 re-trieval, whereas Fig. 3 (right panel) shows the same collo-cations but for C6U retrievals. Figure 3 (left panel) clearly shows positive bias (0.07) in C6-retrieved AODs as com-pared to SP AODs. The bias is significantly reduced (to
−0.01) when the C6U retrieval is applied (right panel). As discussed in Sect. 4, aerosol retrieval from passive satellite measurements is sensitive to underlying surface re-flectance; the relative uncertainty becomes greater for lower AOD conditions, when the surface reflectance dominates the signal. By improving the overall urban surface reflectance parameterization, the bias is reduced. However, the small negative bias indicates that there is still uncertainty in esti-mating visible reflectance. We note that most of the negative
Figure 3. The frequency scatter plot for AOD at 0.55 µm over AERONET locations in the CONUS region. This comparison be-tween MODIS and AERONET considers only MODIS AOD pixels with UP larger than 20 % with QAF=3. The side-by-side scatter plots of C6 (left) and C6U (right) AOD retrievals with AERONET are shown to analyze the impact of the new surface scheme on the retrieved AOD values. The one-to-one lines and EE % envelopes are plotted as solid and dashed lines. The statistics of MODIS– AERONET comparisons are presented in the top left corner of each scatter plot.
AODs from the C6U retrieval are correctly identifying low values of AODs (< 0.1), such that a retrieval of “clean” con-ditions is correct. The other source of uncertainty in AOD retrievals comes from selection of proper aerosol model, but this effect should be minimal at such low optical depths. The number of retrievals within pre-defined expected error enve-lope (EE %) has also increased from 63 % for C6 to 85 % for the C6U retrievals. Most of the statistical parameters in com-paring MODIS and SP AODs demonstrate improvement in C6U AODs as compared to C6 retrievals.
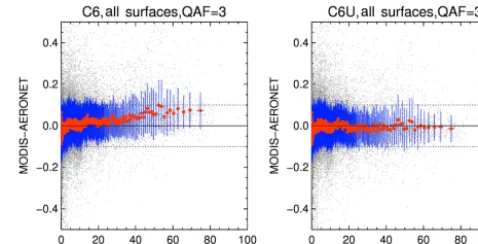
anal-Figure 4.Binned bias in MODIS AODs compared to AERONET AODs as a function of UP, using all collocated data sets with QAF=3. MODIS C6 retrievals on left and MODIS C6U retrievals on the right. Each bin represents 100 points and the error bars are ±1 standard deviation in both directions. There are a total of 14 402 MODIS–AERONET collocated points compared in the plot. C6 AODs show increased in bias over urbanized land surfaces whereas C6U is able to correct the bias over the CONUS region for QAF=3 data points.
ysis indicates that the C6U surface parameterization success-fully removes AOD biases over cities and should be applied to MDT aerosol retrievals over the CONUS region.
The MODIS AOD data presented in Figs. 3 and 4 repre-sent collocations for where the quality assurance flag identi-fies the retrieval as “science quality” (QAF=3, “very good”; Levy et al., 2013). A QAF value is defined for each MODIS AOD pixel based on retrieving conditions (i.e., number of available cloud-free pixels, presence of cirrus cloud, surface reflectance, retrieving error) as reported in Levy et al. (2013). AOD retrievals with QAF of 3, 2, 1 and 0 are considered as “very good”, “good”, “marginal” and “poor”, respectively. Further details on the QAF can be found in Levy et al. (2013). For some applications, including identifying large aerosol “events”, there is interest in analyzing retrievals with lower, but non-zero values of confidence flags (QAF > 0). For ex-ample, for air-quality interest, it would be useful to identify heavy aerosol loading, even within cloud fields.
In order to analyze and validate MODIS AODs with lower quality flags, we have grouped the data in several differ-ent ways to represdiffer-ent differdiffer-ent retrieval conditions. Table 3 presents the statistical analysis of the two retrievals (C6 and C6U) for three categories of underlying surface type (i.e., UP). These are
1. ALL: all retrievals irrespective of UP;
2. UP > 0.0 %: retrievals that have some urban fraction; 3. UP > 20 %: retrievals with UP larger than 20 %. For the third category (UP > 20 %), this includes only re-trievals where C6U retrieval would be applied and different from C6, while the second category includes retrievals that
may be suburbs or small towns, and the first category (ALL) includes everything.
Since QAF value is most strongly connected to the number of pixels used in the retrieval, the difference between C6U and C6 would not be reflected in reported QAF value.
Each surface category in Table 3 is further broken down by QAF level. Note that the case of ALL and QAF=3 rep-resents the data in Fig. 4, which are the MDT recommen-dations of “science-quality” data. The correlation for C6U (R=0.86) is marginally higher than for C6 (R=0.85), but the bias is reduced to 0.006 from 0.022. The number of re-trievals within EE % increased by 4 %. For the UP > 20 % cases (e.g., data shown in Fig. 3), there is a huge reduction in bias (from 0.075 to−0.007), and the EE % increases from 58.6 to 85.3 %.
For the C6 data, there is a clear reduction in regression quality (decreased correlation, increased bias, %EE reduc-tion) as QAF criteria are relaxed from 3 to 2 to 1. This is true for the set of ALL retrievals, but especially when the retrieval is performed over even a small fraction of urban surface type (UP > 0). For C6U, the immediate effect is to cut bias to a negligible value for QAF=3 for all categories including ALL. As QAF criteria are relaxed, bias jumps up and correlation and EE % decrease, although not as drasti-cally as for the C6 retrievals. In fact, the statistics, including bias, for the QAF=2 or 3 criteria are not much different than the statistics for the current C6 retrievals for QAF=3 only. However, there is improved sampling (50 % more colloca-tions with AERONET). If the currently recommended C6 re-trieval at QAF=3 is adequate, then it may make sense to recommend QAF=2 and 3 for the C6U algorithm and in-crease the number of available retrievals by 30, 50 and 84 % for ALL, UP > 0 and UP > 20 % categories, respectively.
The improved statistics for AOD retrievals with lower as-signed quality flags are encouraging and suggest opportunity for overall increase in high-quality sampling with the MDT algorithm. This will definitely help characterize aerosol for air-quality applications in densely populated areas. However, further research and dedicated evaluations of quality flag as-signment criteria in the algorithm are required before we sug-gest making use of lower-quality data even in the C6U re-trievals.
5.3 Evaluation over selected cities
Table 3.Statistics of MODIS and AERONET inter-comparisons using collocated data sets. Comparisons are performed for different quality flags. Three different MODIS pixel selection schemes based on surface type are used. All: all MODIS pixels were considered irrespective of underlying surface type; urban % > 0.0: MODIS pixels with urban surface were selected; urban % > 20: MODIS pixels with urban percentage larger than 20 % were selected in collocation. Statistical parameters, number of data points (N) linear correlation coefficient (R), mean bias (bias) and EE % are reported in this table.
R Bias EE %
Data Set QAF N C6 C6U C6 C6U C6 C6U
All 1 723 0.67 0.74 0.114 0.072 38.8 52.6
1, 2 6415 0.73 0.78 0.106 0.067 41.9 56.4 1, 2, 3 21 842 0.80 0.83 0.051 0.029 65.0 72.5 2, 3 18 995 0.81 0.84 0.041 0.020 69.1 76.0 3 14 402 0.85 0.86 0.022 0.006 77.1 81.1
Urban % > 0.0 1 295 0.63 0.74 0.171 0.084 27.3 55.0 1, 2 3269 0.68 0.77 0.141 0.070 31.3 57.5 1, 2, 3 11 258 0.78 0.84 0.071 0.028 59.1 74.6 2, 3 9455 0.79 0.85 0.062 0.020 63.8 78.1 3 6300 0.88 0.90 0.036 0.002 75.2 85.2
Urban % > 20.0 1 109 0.50 0.59 0.259 0.105 15.5 49.5 1, 2 1406 0.65 0.73 0.205 0.083 16.6 52.0 1, 2, 3 4301 0.75 0.83 0.128 0.032 37.4 73.2 2, 3 3451 0.78 0.85 0.115 0.021 42.2 76.8 3 1875 0.90 0.93 0.075 −0.007 58.6 85.3
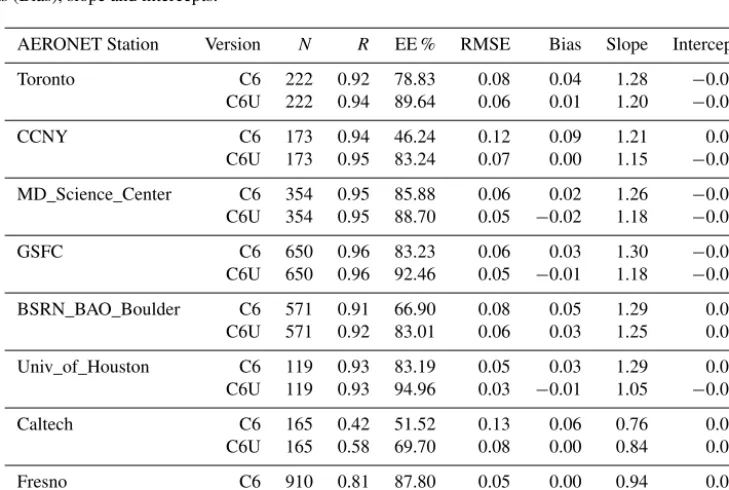
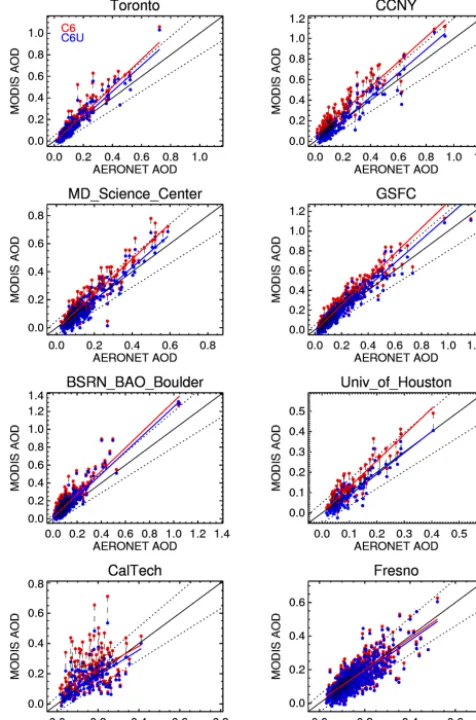
Table 4.Statistics of MODIS and AERONET inter-comparisons over selected urban sites (Fig. 5). Statistical parameters are the number of coincident points (N), linear Correlation coefficient (R), percentage of retrievals with uncertainty envelope (EE %), root mean square error (RMSE), mean bias (Bias), slope and intercepts.
AERONET Station Version N R EE % RMSE Bias Slope Intercept
Toronto C6 222 0.92 78.83 0.08 0.04 1.28 −0.01
C6U 222 0.94 89.64 0.06 0.01 1.20 −0.02
CCNY C6 173 0.94 46.24 0.12 0.09 1.21 0.05
C6U 173 0.95 83.24 0.07 0.00 1.15 −0.03
MD_Science_Center C6 354 0.95 85.88 0.06 0.02 1.26 −0.01 C6U 354 0.95 88.70 0.05 −0.02 1.18 −0.04
GSFC C6 650 0.96 83.23 0.06 0.03 1.30 −0.01
C6U 650 0.96 92.46 0.05 −0.01 1.18 −0.03
BSRN_BAO_Boulder C6 571 0.91 66.90 0.08 0.05 1.29 0.02 C6U 571 0.92 83.01 0.06 0.03 1.25 0.00
Univ_of_Houston C6 119 0.93 83.19 0.05 0.03 1.29 0.00 C6U 119 0.93 94.96 0.03 −0.01 1.05 −0.02
Caltech C6 165 0.42 51.52 0.13 0.06 0.76 0.08
C6U 165 0.58 69.70 0.08 0.00 0.84 0.02
Fresno C6 910 0.81 87.80 0.05 0.00 0.94 0.01
C6U 910 0.81 88.24 0.05 −0.01 0.94 0.00
in Fig. 1. Table 4 provides statistical parameters correspond-ing to the scatter plots presented in Fig. 5. All AERONET stations show positive bias in C6 AOD, which, except for Fresno, is corrected in the C6U retrievals. Over Fresno, the
Figure 5. Inter-comparison of MODIS AODs at 0.55 µm with AERONET AODs over selected AERONET stations located in ma-jor cities in the USA and Canada (see Fig. 1). Each panel represents an individual station; the red dots are AODs retrieved with C6 MDT and blue dots are AODs from C6U MDT algorithm. The one-to-one lines and EE % envelopes are plotted as solid black and dashed lines. The two regression lines for C6 and C6U comparisons are also plotted as solid red and blue lines, respectively. These AERONET stations are selected to demonstrate the performance of C6U over varying surface and aerosol types.
The lowest correlation is observed over Caltech with val-ues of 0.42 and 0.58 for C6 and C6U, respectively, likely because of the complex terrain within the 0.5×0.5◦ box surrounding the Caltech AERONET station. The Caltech AERONET site is located at the entrance of the San Gabriel Valley, up against some very high mountains. There is a high possibility of having pieces of the mountains, the San Gabriel Valley, the San Fernando Valley and the Los Angeles coastal plain within that 0.5×0.5◦box. Under these complex mix of terrain, it is likely that AERONET and MODIS often sam-ple different air masses and thus comparisons can have large scatter. The largest improvement in EE %, bias and RMSE is
observed over the New York City (CCNY) AERONET sta-tion. The number of retrievals within the uncertainty window (EE %) at CCNY almost doubled from 46 % in C6 to 83 % in C6U, and the bias is reduced to 0 from 0.09. The C6U re-sults over CCNY observed a slight negative offset of−0.03 mainly due to a negative bias in low aerosol loading condi-tions (AOD < 0.1). In general the slope is larger than one for eastern US sites whereas it less than one for western US sites. In Fig. 6 we have evaluated the spatial distribution of AOD over the region covering two large urban cities, Baltimore and Washington DC. The map shows averaged AODs for the period of June–August 2011. The main purpose of the figure is to demonstrate, spatially, that the C6U algorithm reduces the high AOD bias over urban surfaces, such as the Wash-ington DC area in the figure. There we see that the seasonal mean values in the C6U algorithm are more spatially consis-tent with the surrounding suburban and rural area than are the values from C6. Figure 6c shows the difference between C6 and C6U AODs, which is correlated with UP (Fig. 6d) and could be as high as 0.12.
The secondary purpose of the figure is to demonstrate that the C6U algorithm has not solved all problems associated with the retrieval over cities. There are still artificially high seasonal mean values for Baltimore and the Chesapeake Bay shoreline. The reason these seasonal mean values remain ar-tificially inflated is because of sampling. Figure 6e presents the number of averaging days (or number of retrievals) for each grid box, and it is apparent that some grids near city centers and along the shoreline have very limited sampling (1–5) days. Coincidently, these available days correspond to high aerosol loading days, creating an illusion of high sea-sonal mean aerosol loading in the city centers and along the Chesapeake Bay. The low number of retrievals in these squares is caused by a combination of clouds and the addi-tional issue of the algorithm choosing not to retrieve over very bright urban surfaces under low aerosol loading and at certain sun–satellite geometry. While the new C6U algorithm will be able to produce a better urban retrieval when an urban pixel is selected for processing, it will continue to be affected by the algorithm’s pixel selection process that makes it diffi-cult for urban pixels to be chosen. This work focuses on the parameterization of the surface reflectance relationships and not on the upstream pixel selection and masking processes. 5.4 Regional analysis over DRAGONs
Figure 6. Seasonal (June–July–August 2011) maps of MODIS AOD at 0.55 µm as retrieved by C6(a), C6U(b), C6-C6U(c)and urban %(d)covering Washington DC and Baltimore urban corridor.
(e)Number of AOD retrievals over the season. MODIS AODs with QAF=3 for 3 months have been averaged over 0.1×0.1◦ grids to generate these maps. C6U MDT-retrieved AODs are lower over large cities as compared to C6 AODs, and the improvements are well correlated with UP.
different types of landscapes. This AERONET DRAGON deployment also provides an excellent opportunity to evalu-ate the high AOD values near the cities as observed in Fig. 6. The data have been utilized to validate satellite aerosol re-trievals and spatial variability in the aerosol fields (Munchak et al., 2013). Munchak et al. (2013) reported that the MODIS C6 AOD retrievals were positively biased against AERONET values in (and near) urban areas with a high degree of corre-lation with UP. We now revisit the Munchak et al. (2013) data sets to verify whether the new C6U retrievals alleviate the issues noted by the previous study.
Figure 7a, c, e, g (left panels) and b, d, f, h (right panels) represent comparisons between MODIS C6 and C6U AOD validation statistics, respectively. The two scatter plots show MODIS-retrieved AOD plotted against AERONET
measure-Figure 7.Inter-comparison statistics of MODIS–AERONET AODs over DRAGON network during DISCOVER-AQ field campaign (June–July 2011) in the Washington DC–Baltimore area. This analysis used data from AERONET stations operated as part of DRAGON network. Scatter plot between AERONET and MODIS for C6(a), C6U(b); each collocated point is color-coded with UP corresponding to AERONET site. Other statistical parameters for each AERONET stations are mapped in following order:(c)linear correlation coefficient (R) for C6 and UP,(d)Rfor C6U,(e)mean bias in C6 AODs,(f)mean bias in C6U AODs,(g)EE % from C6 and(h)EE % from C6U.
(UP > 60 %) area. The two scatter plots (Fig. 7a and b) very clearly show the improvement in AOD comparisons against AERONET when the C6U algorithm is applied. The mean bias between MODIS and AERONET is reduced to almost 0, and EE % has gone up to 93 %. This implies that the RMSE and slope have also improved in the C6U retrievals, as com-pared with the C6 retrievals, but the offset (I) in C6U is now slightly negative (−0.02), which was 0 in the C6 retrievals. A closer look at the scatter plot reveals that C6U has introduced some negative bias at very low AOD cases (AOD < 0.15), which is consistent with previous analysis over the CONUS region. Again, in order to remove these negative biases, more accurate estimation of surface parameters is required. The re-maining figures show correlation, bias and EE % for the two algorithms over individual DRAGON sites. The outer color-coded circle in Fig. 7c represents UP over each DRAGON site. The color-coding is done according to the scale shown in the Fig. 7a. In almost all statistical parameters, C6U out-performed C6 algorithm over each station.
6 Global implications and challenges
The new surface scheme presented here is designed to work only over CONUS (and perhaps other regions with similar surface properties) and with the 10 km aerosol retrieval. Im-plementing the new scheme into the global algorithm, as well as at a different spatial resolution (e.g., 3 km), may be chal-lenging. In CONUS we had a wealth of data to work with: 135 AERONET stations with several in highly urban loca-tions and a well-analyzed DRAGON network to evaluate the small-scale variability in the aerosol fields. We were able to parameterize the surface reflectance relationships by di-viding the surfaces into only four categories depending on UP and NDVISWIR. The presence and varying amount (and
type) of vegetation in the urban areas and the different ma-terials used in construction of buildings and roads in other parts of the world will make accurate surface parameteriza-tion a more complex problem. However, because the results over CONUS have been so encouraging, we decided to run the CONUS-derived C6U algorithm globally and to compare the results with AERONET measurements. Figure 8 presents the difference between C6U AOD with AERONET AOD as a function of UP over the entire global data set, excluding AERONET stations from the CONUS region. The CONUS region has been excluded in order to avoid weighting the re-sults by the formulation data set. The rere-sults are surprisingly good. The CONUS-derived C6U has reduced the positive bias over urban surfaces to nearly 0 globally. This analysis is very encouraging, but more in depth analysis for specific stations/regions will be required to better understand the new algorithm before applying it operationally at global scale.
Figure 8.Binned bias in MODIS AODs compared to AERONET AODs as a function of UP using all collocated data sets with QAF=3. This analysis used data from global (excluding CONUS region) AERONET network for the period of January 2003– June 2013. MODIS C6 retrievals are on the left and MODIS C6U retrievals are on the right. Each bin represents 100 points and the error bars are±1 standard deviation in both directions. There are a total of 50 948 MODIS–AERONET collocated points from 302 sta-tions compared in this plot. C6 AODs show increased in bias over urbanized land surfaces whereas C6U is able to correct the bias over the region for QAF=3 data points.
7 Discussion of the MxD09 product from the perspective of this study
For years the MDT algorithm refrained from using the MxD09 because of the question of “circularity”. The MODIS land atmospheric correction and aerosol retrieval algorithms evolved from the same basic root (Vermote et al., 1997; Kauf-man et al., 1997). Using the land reflectance derived from the aerosol algorithm to derive the AOD that is used to produce the land reflectance would create an incestuous circular rela-tionship, tuned to agree at AERONET stations and nowhere else. However, over time the land atmospheric correction and the Dark Target aerosol retrieval evolved significantly into very different second-generation algorithms, using a dif-ferent set of wavelengths, a difdif-ferent set of assumptions of aerosol properties and minimizing a different cost function in the inversion (Vermote and Kotchenova, 2008; Levy et al., 2007a, b). To reduce the possible circularity even further, we do not attempt to directly use daily surface reflectance prod-uct in our MDT algorithm but rather look for spectral rela-tionships. Mirroring the logic within the C6 MDT algorithm, we use 1 year of MOD09 over CONUS to form the SWIR– VIS relationships as a function of NDVISWIRand urban
per-cent. Therefore no direct use of surface reflectance product is used for our urban DT retrieval.
global database of atmospherically corrected surface re-flectance at AERONET sites. There is one global value per pair of wavelengths. Because, as we have shown, the surface reflectance ratios over urban surfaces differ from the vast ma-jority of land surface types, we would expect that MxD09 values over urban surfaces to show higher errors and greater uncertainty than more rural and typical surfaces. Indeed that is the case as shown in Sect. 3.3. If this error is not spectrally uniform and involves a bias as well as random error, as is suggested by the urban example in Vermote and Kotchen-ova (2008), then the ratios that we derive from MxD09 in Fig. 2 will not represent that actual surface reflectances in the MDT retrieval. Errors and biases will be introduced into the C6U results. Comparisons against AERONET will be partially contaminated because the original MxD09 pre-determined surface reflectance ratios were based on the cor-rected surface reflectances surrounding AERONET sites.
Despite these causes of concern, we proceeded with the use of MxD09 in this study because this is the only data set having robust statistics with any hope of providing surface reflectance ratios in urban settings at the spatial scale needed. Any alternative method of performing our own atmospheric correction at specific AERONET locations with variable UP to determine our own urban surface reflectance ratios would suffer from limited statistics. Our decision to proceed with MxD09 has been justified with the results shown in Figs. 3, 4, 5 and especially 6, 7 and 8. The C6U results not only bring the urban AOD closer to the AERONET values in a general sense but also reduce the urban bias beyond the orig-inal AERONET stations used to derive the pre-determined surface reflectance ratios. We see this across the DRAGON network of Fig. 7, where C6U brings down the bias and cap-tures the mesoscale variation of the aerosol. None of these DRAGON stations existed at the time that the universal sur-face reflectance ratios were determined for the MxD09 algo-rithm, and therefore this is a clean validation. We also note that AERONET has grown significantly since the MxD09 pre-determined ratios were calculated, and while our valida-tion data set may overlap with the formulavalida-tion one, it is not identical. Figure 8 also bolsters our confidence in this data set. Note that the urban surface reflectance ratios we derive in Fig. 2 were derived using only values over CONUS. There was no guarantee that these values would improve retrievals over non-CONUS cities, but they do.
Thus, while the MxD09 product has significant uncer-tainty in the blue channel, especially over urban surfaces, that uncertainty appears to be manageable. There is no doubt that C6U is an improvement over C6 in urban settings.
8 Summary and conclusions
The MDT aerosol retrieval algorithm, shaped by continu-ing research and influenced by application needs, has been operating successfully for 15 years. The MODIS C6U
al-gorithm presented here reflects the MODIS science team’s commitment to keeping the algorithm updated and relevant. In this spirit, we address the AOD biases in the current oper-ational product related to improper surface parameterization over urban areas. We develop a revised surface parameteriza-tion scheme over urban regions using the MODIS Land Sur-face Reflectance and Land Cover Type products. The new parameterization parallels the current Collection 6 surface scheme, where visible surface reflectances are estimated for each pixel using the value of the SWIR surface reflectances at that pixel, modified by NDVISWIRand scattering angle. The
new scheme introduces one additional parameter, the per-centage of urban land type cover (UP) for each retrieval box. The new surface scheme is only applied for MODIS retrieval boxes with UP larger than 20 %. All other MODIS retrievals have been treated exactly same as in the C6 algorithm. Ini-tially, the surface parameterization has been developed and implemented only for the continental United States.
MODIS Aqua data sets from 2003 to 2012 over all AERONET stations in the USA including a dense DRAGON network deployed during the DISCOVER-AQ field cam-paign in the Baltimore–Washington DC metropolitan area, have been utilized to evaluate the revised AOD retrievals. The side-by-side comparison of C6 and C6U retrieval against AERONET measurements provided quantitative estimates of improvements in the MODIS AOD retrievals. Over urban ar-eas where the C6U retrieval has been applied (UP > 20 %), we find an increase of more than 20 % in the number of re-trievals falling within EE %. The strong positive correlation between bias in AOD and amount of urban surface near the AERONET site that was observed in C6 is gone in C6U. The C6U retrieval does introduce a small negative bias in the retrieved AOD for AOD values less than 0.1 due to ultra-sensitivity of the AOD retrieval to the surface parameteriza-tion under low atmospheric aerosol loadings.
While the new C6U algorithm successfully reduces the high biases in AOD seen over urban pixels when one of these pixels is selected for retrieval, C6U does not affect the pixel selection process. Pixel selection itself is affected by the properties of urban surfaces, and under low aerosol load-ing conditions and certain geometries, urban pixels are dis-proportionally rejected for retrieval. Thus, C6U will improve retrievals when retrievals are made but will not increase the number of retrievals attempted.
to change the recommendation and relax the QAF criteria for quantitative purposes, but this analysis definitely gives suffi-cient motivation to revisit the quality flag assignment scheme in the MODIS DT algorithm if the C6U algorithm is imple-mented operationally.
While the formulation of the C6U algorithm is based on surface characterization of stations in the continental USA, we tested the new algorithm on the global data set and compared with AERONET AOD. Even when excluding the CONUS AERONET stations to avoid the mistake of validat-ing the formulation data set, the results show the elimination of AOD bias as a function of urban percentage. These are unexpected, but encouraging, results that suggest that the pa-rameterization developed from the CONUS data may be im-plemented soon into the global operational algorithm for a significant improvement over urban centers worldwide. Ad-ditional testing will be necessary first.
As populations flock to urban centers, causing the urban landscape around the world to grow continuously, it becomes obvious that these regions can no longer be treated with second-class status by the MDT aerosol algorithm. It is cru-cial to have accurate retrievals of AOD over the urban land-scape, which translate into more accurate estimates of partic-ulate matter concentrations for air-quality purposes over the regions where most people live. The revised C6U algorithm improves the quality of MODIS AOD retrievals over urban regions, which will be extremely useful for air-quality appli-cations. We expect that this improvement will open up new opportunities for the research community to apply the MDT AOD data to address other pressing issues such as urban-scale spatial variability, gradients between rural and urban areas, more accurate long-term trends and air-quality–health links.
Acknowledgements. AERONET data were obtained from the
NASA AERONET data server; we would like to thank the AERONET team for maintaining the network and data archive. We could not do this study without the AERONET and DRAGON teams’ continuing support of quality-controlled, easy-access data. This project is supported through NASA ROSES grants under Terra–Aqua: NNH13ZDA001N-TERAQEA MODIS maintenance project.
Edited by: M. Wendisch
Reviewed by: two anonymous referees
References
Cooper, M., Martin, R. V., van Donkelaar, A., Lamsal, L., Brauer, M., and Brook, J.: A satellite-based multi-pollutant index of global air quality, Env. Sci. and Tech., 46, 8523–8524, 2012. de Almeida Castanho, A. D., Prinn, R., Martins, V., Herold, M.,
Ichoku, C., and Molina, L. T.: Analysis of Visible/SWIR sur-face reflectance ratios for aerosol retrievals from satellite in
Mexico City urban area, Atmos. Chem. Phys., 7, 5467–5477, doi:10.5194/acp-7-5467-2007, 2007.
de Almeida Castanho, A. D., Vanderlei Martins, J., and Artaxo, P.: MODIS Aerosol Optical Depth Retrievals with high spatial reso-lution over an Urban Area using the Critical Reflectance, J. Geo-phys. Res., 113, D02201, doi:10.1029/2007JD008751, 2008. Eck, T. F., Holben, B. N., Reid, J. S., Dubovik, O., Smirnov, A.,
O’Neill, N. T., et al.: Wavelength dependence of the optical depth of biomass burning, urban, and desert dust aerosols, J. Geophys. Res.-Atmos., 104, 31333–31349, 1999.
Escribano, J., Gallardo, L., Rondanelli, R., and Choi, Y.-S.: Satellite retrievals of aerosol optical 10 depth over a subtropical urban area: the role of stratification and surface reflectance, Aerosol Air Qual. Res., 14, 596–U568, doi:10.4209/aaqr.2013.03.0082, 2014.
Friedl, M. A., Sulla-Menashe, D., Tan, B., Schneider, A., Ra-mankutty, N., Sibley, A., and Huang, X.: MODIS Collection 5 global land cover: Algorithm refinements and characterization of new datasets, Remote Sens. Environ., 114, 168–182, 2010. Gupta, P. and Christopher, S. A.: Particulate matter air quality
as-sessment using integrated surface, satellite, and meteorological products: Multiple regression approach, J. Geophys. Res., 114, D14205, doi:10.1029/2008JD011496, 2009.
Gupta, P., Christopher, S. A., Wang, J., Gehrig, R., Lee, Y., and Kumar, N.: Satellite remote sensing of particulate matter and air quality assessment over global cities, Atmos. Environ., 40, 5880– 5892, 2006.
Gupta, P., Khan, M. N; da Silva, A; Patadia, F.: MODIS aerosol optical depth observations over urban areas in Pakistan: quantity and quality of the data for air quality monitoring, Atmospheric Pollution Research, 4, 43–52, 2013.
Hoff, R. M. and Christopher, S. A.: Remote sensing of particulate pollution from space: have we reached the promised land?, J. Air Waste Manage., 59, 645–675, 2009.
Holben, B. N., Eck, T. F., Slutsker, I., Tanre, D., Buis, J. P., Set-zer, A., Vermote, E., Reagan, J. A., Kaufman, Y., Nakajima, T., Lavenu, F., Jankowiak, I., and Smirnov A.: AERONET – A fed-erated instrument network and data archive for aerosol character-ization, Remote Sens. Environ., 66, 1–16, 1998.
Holben, B., Eck, T., Schafer, J., Giles, D., and Mikhail, M.: Distributed Regional Aerosol Gridded Observation Networks (DRAGON), White Paper, NASA Goddard Space Flight Center, p. 13, 2011.
Hyer, E. J., Reid, J. S., and Zhang, J.: An over-land aerosol opti-cal depth data set for data assimilation by filtering, correction, and aggregation of MODIS Collection 5 optical depth retrievals, Atmos. Meas. Tech., 4, 379–408, doi:10.5194/amt-4-379-2011, 2011.
Ichoku, C., Chu, D. A., Mattoo, S., Kaufman, Y. J., Remer, L. A., Tanre, D., Slutsker, I., and Holben, B. N.: A spatio-temporal approach for global validation and analysis of MODIS aerosol products, Geophys. Res. Lett., 29, MOD1.1–MOD1.4, doi:10.1029/2001GL013206, 2002.
Uni-versity Press, Cambridge, United Kingdom and New York, NY, USA, 2007.
Jäkel, E., Mey, B., Levy, R., Gu, X., Yu, T., Li, Z., Althausen, D., Heese, B., and Wendisch, M.: Adaption of the MODIS aerosol retrieval algorithm using airborne spectral surface reflectance measurements over urban areas: a case study, Atmos. Meas. Tech., 8, 5237–5249, doi:10.5194/amt-8-5237-2015, 2015. Jethva, H., Satheesh, S. K., and Srinivasan, J.: Assessment
of second-generation MODIS aerosol retrieval (Collection 005) at Kanpur, India, Geophys. Res. Lett., 34, L19802, doi:10.1029/2007GL029647, 2007.
Kaufman, Y. J., Tanré, D., Gordon, H. R., Nakajima, T., Lenoble, J., Frouin, R., Grassl, H., Herman, B. M., King, M. D., and Teillet, P. M.: Passive remote sensing of tropospheric aerosol and atmo-spheric correction for the aerosol effects, J. Geophys. Res., 102, 16815–16830, 1997a.
Kaufman, Y. J., Tanre, D., Remer, L., Vermote, E., Chu, A., and Hol-ben, B. N.: Operational remote sensing of tropospheric aerosol over land from EOS moderate resolution imaging spectrora-diometer, J. Geophys. Res.-Atmos., 102, 17051–17067, 1997b. Kaufman, Y. J., Gobron, N., Pinty, B., Widlowski, J., and Verstraete,
M. M.: Relationship between surface reflectance in the visible and mid-IR used in MODIS aerosol algorithm – theory, J. Geo-phys. Res., 29), 2116, doi:10.1029/2001GL014492, 2002. Liu, Y., Paciorek, C., and Koutrakis, P.: Estimating The Spatial and
Temporal Variability of PM2.5Concentrations in Massachusetts
Using Satellite Data, Meteorological, and Land Use Information, Environ. Health Persp., 117, 886–892, 2009.
Levy, R. C. and Pinker R. T.: Remote sensing of spectral aerosol properties: a classroom experience, B. Am. Meteorol. Soc., 88, 25–30, 2007.
Levy, R. C., Remer, L. A., and Dubovik, O.: Global aerosol opti-cal properties and application to Moderate Resolution Imaging Spectroradiometer aerosol retrieval over land, J. Geophys. Res.-Atmos., 112, D13210, doi:10.1029/2006JD007815, 2007a. Levy, R. C., Remer, L. A., Mattoo, S., Vermote, E. F., and
Kauf-man, Y. J.: Second-generation operational algorithm: Retrieval of aerosol properties over land from inversion of Moderate Resolu-tion Imaging Spectroradiometer spectral reflectance, J. Geophys. Res.-Atmos., 112, D13211, doi:10.1029/2006JD007811, 2007b. Levy, R. C., Remer, L. A., Tanré, D., Mattoo, S. and Kaufman, Y.J.: Algorithm for remote sensing of tropospheric aerosol over dark targets from MODIS: Collections 005 and 051. Revision 2, available at: http://modis-atmos.gsfc.nasa.gov/_docs/ATBD_ MOD04_C005_rev2.pdf (last access: 15 November 2015), 2009. Levy, R. C., Remer, L. A., Kleidman, R. G., Mattoo, S., Ichoku, C., Kahn, R., and Eck, T. F.: Global evaluation of the Collection 5 MODIS dark-target aerosol products over land, Atmos. Chem. Phys., 10, 10399–10420, doi:10.5194/acp-10-10399-2010, 2010. Levy, R. C., Mattoo, S., Munchak, L. A., Remer, L. A., Sayer, A. M., Patadia, F., and Hsu, N. C.: The Collection 6 MODIS aerosol products over land and ocean, Atmos. Meas. Tech., 6, 2989– 3034, doi:10.5194/amt-6-2989-2013, 2013.
Li, C., Lau, A., Mao, J., and Chu, D.: Retrieval, validation, and ap-plication of the 1-km aerosol optical depth from MODIS mea-surements over Hong Kong, IEEE T. Geosci. Remote, 43, 2650– 2658, 2005.
Li, S. S., Chen, L. F., Tao, J. H., Hand, D., Wang, Z. T., Su, L., Fan, M., and Yu, C.: Retrieval of aerosol optical depth over bright
targets in the urban areas of North China during winter, Science China, 55, 1545–1553, doi:10.1007/s11430-012-4432-1, 2012. Munchak, L. A., Levy, R. C., Mattoo, S., Remer, L. A.,
Hol-ben, B. N., Schafer, J. S., Hostetler, C. A., and Ferrare, R. A.: MODIS 3 km aerosol product: applications over land in an urban/suburban region, Atmos. Meas. Tech., 6, 1747–1759, doi:10.5194/amt-6-1747-2013, 2013.
Remer, L. A., Kaufman, Y. J., Tanre, D., Mattoo, S., Chu, D. A., Martins, J. V., Li, R. R., Ichoku, C., Levy, R. C., Kleidman, R. G., Eck, T. F., Vermote, E., and Holben, B. N.: The MODIS Aerosol Algorithm, products, and validation, J. Atmos. Sci.-Special Edi-tion, 62, 947–973, 2005.
Remer, L. A., Mattoo, S., Levy, R. C., and Munchak, L. A.: MODIS 3 km aerosol product: algorithm and global perspective, At-mos. Meas. Tech., 6, 1829–1844, doi:10.5194/amt-6-1829-2013, 2013.
Tanré, D., Kaufman, Y. J., Herman, M., and Mattoo, S.: Re-mote sensing of aerosol properties over oceans using the MODIS/EOS spectral radiances, J. Geophys. Res., 102, 16971– 16988, doi:10.1029/96JD03437, 1997.
United Nations: World Urbanization Prospects: The 2014 Revision, Highlights, Department of Economic and Social Affairs, Popula-tion Division, ST/ESA/SER.A/352, 2014.
van Donkelaar, A., Martin, R. V., Brauer, M., Kahn, R., Levy, R., Verduzco, C., and Villeneuve, P. J.: Global estimates of ambient fine particulate matter concentrations from satellitebased aerosol optical depth: development and application, Environ. Health Per-spect., 118, 847–855, doi:10.1289/ehp.0901623, 2010.
van Donkelaar, A., Martin, R. V., Brauer, M., and Boys, B. L.: Use of Satellite Observations for Long-Term Exposure Assess-ment of Global Concentrations of Fine Particulate Matter, Env-iron. Health Perspect., 123, 135–143, doi:10.1289/ehp.1408646, 2015.
Vermote, E. F. and Kotchenova, S.: Atmospheric correction for the monitoring of land surfaces, J. Geophys. Res., 113, D23S90, doi:10.1029/2007JD009662, 2008.
Vermote, E. F., El Saleous, N., Justice, C. O., Kaufman, Y. J., Privette, J. L., Remer, L., Roger, J. C., and Tanré, D.: Atmo-spheric correction of visible to middle-infrared EOS-MODIS data over land surfaces: Background, operational algorithm and validation. J. Geophys. Res.-Atmos., 102, 17131–17144, doi:10.1029/97JD00201, 1997.
Wang, J. and Christopher, S. A.: Intercomparison between satellite-derived aerosol optical thickness and PM2.5 mass: implica-tions for air quality studies, Geophys. Res. Lett., 30, 2095, doi:10.1029/2003GL018174, 2003.
Wong, M., Nichol, J., and Lee, K.: An operational MODIS aerosol retrieval algorithm at high spatial resolution, and its applica-tion over a complex urban region, Atmos. Res., 99, 579–589, doi:10.1016/j.atmosres.2010.12.015, 2011.