Polyethylene recycling: waste policy scenario analysis for the EU-27
Abstract
This paper quantifies the main impacts that the adoption of the best recycling practices together with a reduction in the consumption of single-use plastic bags and the adoption of a kerbside collection system could have on the 27 Member States of the EU. The main consequences in terms of employment, waste management costs, emissions and energy use have been quantified for two scenarios of polyethylene (PE) waste production and recycling. That is to say, a "business as usual scenario", where the 2012 performances of PE waste production and recycling are extrapolated to 2020, is compared to a “best practice scenario”, where the best available recycling practices are modelled together with the possible adoption of the amended Packaging and Packaging Waste Directive related to the consumption of single-use plastic bags and the implementation of a kerbside collection system. The main results show that socio-economic and environmental benefits can be generated across the EU by the implementation of the best practice scenario. In particular, estimations show a possible reduction of 4.4 million tonnes of non-recycled PE waste, together with a reduction of around €90 million in waste management costs in 2020 for the best practice scenario versus the business as usual scenario. An additional 35,622 jobs are also expected to be created. In environmental terms, the quantity of CO2 equivalent emissions could be reduced by around 1.46 million tonnes and the net energy requirements are expected to increase by 16.5 million GJ as a consequence of the reduction in the energy produced from waste. The main analysis provided in this paper, together with the data and the model presented, can be useful to identify the possible costs and benefits that the implementation of PE waste policies and Directives could generate for the EU.
1. Introduction
Figure 1. Recycling/Reuse/Recovery rate of different materials
source: eurostat data (2007-2009)
Within this context, the present paper will specifically focus on the part of the amended Packaging and Packaging Waste Directive related to the reduction of the single-use carrier plastic bag. In particular, the impacts generated by the implementation of the scenario reported in the Option 3 of the Impact Assessment document prepared by the European Commission is considered together with the assumption of the implementation of the best available recycling practices and kerbside collection. In particular, the Impact Assessment document considers 4 different policy implementation options. The man objective is to assess the feasibility and impact of four different options for plastic carrier bags reduction. In the present paper Option 3 is considered. The main consequences in terms of employment, waste management costs, emissions and energy use are quantified at EU-27 level for the year 2020. A “business as usual scenario” is also modelled in this paper.
individual Member States is presented together with the scenarios analysed in the paper. Section 4 summarizes the main results and discusses the costs and benefits generated by the adoption of the best recycling practices together with the reduction in the use of the plastic bags and the implementation of a kerbside collection system. Section 5 identifies the main limitations and the possible future developments. Section 6 concludes.
2. Data
Eurostat data together with confidential data from Plastics Europe (2011) have been used to quantify the total amount of PE waste generated in 2012 across the different EU Member States. The same databases have also been used to disaggregate the total PE waste according to the PE categories reported in Table 1.
Table 1. PE waste disaggregation categories
Sector PE waste categories
Agriculture Total agricultural PE waste
Industrial/commercial waste and household waste Film (LDPE)
Bags, sacks (HDPE/LDPE) Closures (HDPE/LDPE) Bottles (HDPE)
Rigid containers (HDPE) Other
Construction Total construction PE waste
The quantity of PE waste generated in 2012 (reported in Table S1 of the Supplementary material) has been used as a baseline for the scenario analysis performed in this paper. In particular, the following data have been used to quantify the socio-economic and environmental impacts generated in the EU-27 and in the different Member States by the waste production and recycling options considered in this study.
Capital costs, including site assessment, acquisition, capital expenditure and development, energy recovery equipment, restoration and aftercare, installation of machinery, vehicles and replacement of bins (Eunomia, 2002; WRAP, 2008);
Operational costs, including labour costs, cost of energy and fuel (including taxes), machinery maintenance, insurance, landfill and incineration tax (Eurostat website);
Energy generation revenues (Europe energy website; Eurostat Energy statistics Database).
Eurostat data have also been used to quantify the number of jobs associated to waste collection, treatment and recycling.
Recycling: Eurostat data on plastic recycling has been used to quantify the amount of PE recycled by the EU-27. The percentages of non-recycled PE waste allocated between the three disposal options considered in this paper (namely: landfill, incineration and mechanical biological treatment) have been quantified based on data collected from the European Environmental Agency website and previous EU reports (BIOS, 2012; ETC/SCP, 2012). The recycling costs have been quantified using the same data sources and the cost disaggregation used for the waste collection and the waste treatment costs (Eurostat website; Eunomia, 2002, WRAP, 2008). The revenue from the use of recycled material is included in the analysis, as well as the cost reduction generated by the substitution of virgin PE with recycled PE. The market prices for primary and secondary PE material have been obtained from the Plasticker website.
Environmental impacts: Two main environmental impacts have been considered in this paper, namely:
Tons of CO2 equivalent
Energy consumption
environmental impacts by using the method of life cycle assessment (LCA) as standardised by the International Organisation for Standardisation (International Organization for Standardization (ISO) 2006a; International Organization for Standardization (ISO) 2006b). Since specific data for light plastic bags are not included in these databases, the mean value for low density polyethylene (LDPE) and high density polyethylene (HDPE) have been considered in this study.
The estimate the emissions and energy impacts related to PE waste management the coefficients provided by WRATE, the UK Environmental Agency’s life cycle tool, have been used. The database contains information on a wide range of waste treatment facilities and the main environmental impacts are modelled by applying the life cycle assessment methodology used in the Ecoinvent database. For the case of polyethylene the main assumption considers a waste stream that is 25% dense plastic and 75% film plastic. The key assumptions used in the modelling of each of the treatment methods are summarised in Table S2 in the Supplementary material.
Since the emissions and the energy use coefficients are not disaggregated between the different Member States, the environmental impacts generated by PE production together with the environmental effects of the different non-recycled waste management options, have been calculated for the EU-27 as a whole. The specific coefficients used in this paper are reported in Tables 2 and 3.
Table 2. Emissions and energy coefficients of PE manufacture – per ton of material Emissions CO2 Energy content
(kg CO2 eq.) (MJ)
PE manufacture from primary material 2,014 79,933
PE manufacture from recycled content 672 10,707
source: plastic Europe’s eco-profiles and ecoinvent v2.2 database
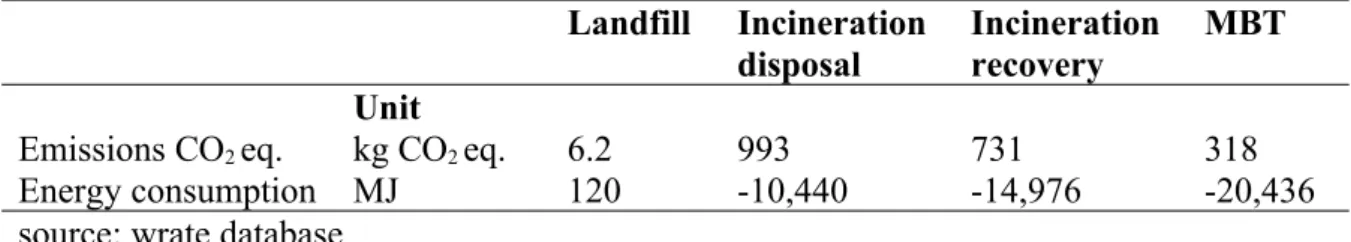
Table 3. Emissions and energy coefficients of PE waste management – per ton of waste Landfill Incineration
disposal
Incineration recovery
MBT Unit
Emissions CO2 eq. kg CO2 eq. 6.2 993 731 318
Energy consumption MJ 120 -10,440 -14,976 -20,436
source: wrate database
To estimate the socio-economic and environmental impacts generated by different scenarios of waste production, disposal and recycling, a Polyethylene accounting model has been proposed in this paper based on the links between an EU-27 material flow model and an EU country-specific waste flow model. Figure 2 displays the PE model structure.
Figure 2. Structure of the PE model
In the PE model reported above, the quantity of PE waste generated by the different EU countries and disaggregated according to the PE product types reported in Table 1 is linked to polyethylene production in the EU-27. In this paper, the material recycled in one year is assumed to be completely incorporated into the production process of the following year, with a consequent reduction in the raw materials and energy demand. However, the model is designed to take into account the import and export of PE, as well as to account for stocks in society and production losses. Changes in gross domestic product, PE prices and consumption preferences can also be considered when investigating the impacts generated on PE consumption and PE waste generation. The EU country-specific waste flow model includes one worksheet for each country and accounts for the PE product type waste production together with the different disposal options. On this basis, the quantity of recycled materials, the waste management costs and the associated environmental impacts can be calculated for the EU as a whole and the 27 Member States individually.
With the help of this model and the data and assumptions reported in the previous section, the socio-economic costs generated by different scenarios of PE waste collection, waste disposal and recycling can be calculated for every one of the Member States. However, since the PE production process is modelled at EU-27 level and since the environmental coefficients are not available for every EU Member State, the total environmental impacts are only calculated at EU aggregate level.
As the main objective of this paper is to investigate the impacts generated by an improvement in the PE recycling rate and by the reduction in PE production linked to the drop in the use of plastic bags, as established in Option 3 of the Impact Assessment of the amended Packaging and Packaging Waste Directive, two scenarios have been considered in this paper:
2012 performances of the different EU Member States are extrapolated to 2020, while taking into account an increase in polyethylene consumption linked to economic growth.
Scenario B: This scenario reflects full implementation of the best available recycling practices, plus full implementation of Option 3 defined in the Impact Assessment document prepared by the European Commission for the amended Packaging and Packaging Waste Directive. In particular, this scenario assumes:
Full implementation of the best available recycling practice. It starts from the hypothesis that by 2020 all Member States will have a PE recycling rate of 56%, which corresponds to the recycling performance of Germany in 2010. The recycling rate for every country is assumed to increase with a constant trend between 2013 and 2020. The non-recycled waste will be allocated to landfill, incineration and mechanical biological treatment based on the same 2012 allocation.
Implementation of the Option 3 of the Impact Assessment of the amended Packaging and Packaging Waste Directive: a steady decrease in single-use carrier bags is assumed to take place in all Member States until an 80% reduction is reached in 2020.
Since Member States will be free to determine the instruments used to meet this target, such as pricing measures or market restrictions, the economic impacts generated by Option 3 have not been included in the Impact Assessment prepared by the European Commission and will not be considered in this study.
A kerbside system for collecting PE waste from households and businesses is also assumed to be gradually introduced as established in the recent review of the waste policies and legislation: by 2020 all EU-27 countries are expected to operate a 90% kerbside collection system. Specialist items, such as agricultural plastic, are assumed to be collected via a bring-based system.
By using the model and the data reported above, the main socio-economic impacts generated by scenarios A and B in the different EU Member States have been calculated for the period 2012-2020. The environmental impacts have been estimated at EU level.
4. Results and discussion
The main results generated by using the PE model developed in this study, according to the two scenarios described above, highlight that the full implementation of the best available recycling practices, together with the reduction in the consumption of single-use plastic bags and the adoption of a kerbside collection system, generate a cost reduction both in economic and environmental terms. The specific impacts generated by scenarios A and B have been disaggregated as follows:
Scenario A – Baseline scenario. The following costs are expected to be generated in 2020 across the EU:
At EU aggregate level, the total cost of PE waste management is expected to increase by 22.4%, as a consequence of the additional quantity of PE waste generated across the EU (Table S3). According to data reported in Table 4, the total costs for PE waste management are expected to grow from €1,674 million in 2012 to €2,048 million in 2020.
An additional 4,106 jobs in the PE waste management sector will be created to deal with the increased quantity of PE waste generated in the EU.
According to data reported in Tables 5 and 6, an emissions increase of 1,276 thousand tonnes of CO2 equivalent, associated with managing the additional PE waste, plus 2,699 thousand tonnes of CO2 equivalent generated by PE manufacturing is expected to take place in 2020, compared to the levels of 2012. The total increase in emissions is thus quantified as 3,975 thousand tonnes of CO2 equivalent.
An increase of 48 million GJ of energy produced from PE waste will be generated in 2020 according to data reported in Table 5.
Scenario B – Full implementation of the best available recycling practices plus reduction in the use of plastic bags and the implementation of a kerbside collection system. The following costs are expected to be generated across the EU-27:
At EU-27 aggregate level, the total cost of PE waste management is expected to increase by 17% (Table S3), as a consequence of implementation of the kerbside system, and as a consequence of the PE waste generation increase generated by gross domestic product variation. According to data reported in Table 4, the total costs are expected to increase from €1,634 million in 2012 to €1,958 million in 2020.
An additional 39,728 jobs in the PE waste management sector are expected to be created between 2012 and 2020 to deal with the kerbside collection system and the increased recycling rate.
According to data reported in Tables 5 and 6, an emissions reduction of 481 thousand tonnes of CO2 equivalent is expected to take place in 2020, compared to 2012. This reduction will be mainly attributed to the reduction in non-recycled PE waste generated by the drop in the consumption of plastic bags. However, since an additional 1.96 million tonnes of CO2 equivalent emissions are expected to be generated by increased PE manufacturing in 2020 related to the economic growth trend, this leads to a net overall increase in CO2 emissions of 1.48 million tonnes, compared to the 2012 level.
As reported in Table 6, an additional 63.6 million GJ will be needed in 2020 for PE manufacturing. A reduction of nearly 6 million GJ of energy produced from incineration of PE waste is expected to take place in 2020, compared to the 2012 figure.
Comparisons between Scenario A and Scenario B – The net changes generated by the implementation of the best available practices compared to the values generated under the baseline conditions have been quantified as:
A reduction of 4.4 million tonnes of non-recycled PE waste, disaggregated into: o A reduction of 3.2 million tonnes of PE waste generated by the reduction in
the use of plastic bags.
According to data reported in Table 4, the reduction in the total costs of PE waste management has been quantified at about €89.9 million. Since the cost in the baseline scenario of managing PE waste in 2020 is around €2,048 million and the cost in the best practice scenario is €1,958 million, this represents a 4.39% costs decrease.
The number of jobs associated with PE waste management increases significantly, as an additional 35,622 jobs are estimated to be created on top of the 27,357 jobs that would be required under the baseline conditions.
Based on data reported in Tables 5 and 6, an emissions reduction of 1.76 million tonnes of CO2 equivalent would be generated by the reduction in the treatment of PE waste management. Further savings of 737 thousand tonnes of CO2 equivalent are expected from the use of the additionally recovered PE to manufacture new PE. However, the change in the waste collection system will result in the consumption of an additional 394 million litres of diesel, which, in turn, will result in 1.02 million additional tonnes of CO2 equivalent. Hence, the net emissions reduction is estimated at around 1.46 million tonnes of CO2 equivalent.
The increased recycling rate and the consequent reduction in the amount of primary PE that is manufactured results in a reduced energy requirement of 37.5 million GJ. However, the reduction in the amount of PE waste sent for incineration will result in a reduction in the associated energy generation of 54 million GJ. The net variation, calculated as the difference between the energy produced from waste and the energy required for PE production and PE waste management, accounts for 16.5 million GJ. The reduction in the use of plastic bags, together with an increase in the recycling rate and a kerbside collection system will result in a reduction of waste management costs at EU-27 aggregated level. However, according to data reported in Table S3 of the Supplementary material, in some countries, such as the Czech Republic, Greece, Spain, Finland, Hungary, Ireland, Italy and Slovenia, the PE management cost is expected to increase. The main reason is that these countries would need to implement significant structural changes in order to implement the three conditions established in Scenario B. In particular, they have to: (i)
implement a kerbside sort system, which is more expensive than the bring-based system currently in use in these countries; (ii) increase the recycling infrastructure and performance;
Table 4. EU27 - PE management costs (million €) and employment in 2012 and 2020 2012 Scenario A 2020 Change 2012-2020 Scenario A Scenario B 2020 Change 2012-2020 Scenario B Net impact of best practice (B-A) 2020
PE costs 1,673.7 2,048.2 374.5 1,958.4 284.7 -89.8
PE employment 23,251 27,357 4,106 62,979 39,728 35,622
Table 5. Environmental impacts of PE waste treatment in 2012 and 2020 2012 Scenario A 2020 Scenario A Change 2012-2020 Scenario B 2020 Scenario B Change 2012-2020 Net impact of best practice (B-A) Emissions (thousand t
CO2 eq.) 2,054 3,330 1,276 1,573 -481 -1,757
Energy consumption (thousand GJ)
-54,715 -102,935 -48,220 -48,792 5,923 54,143
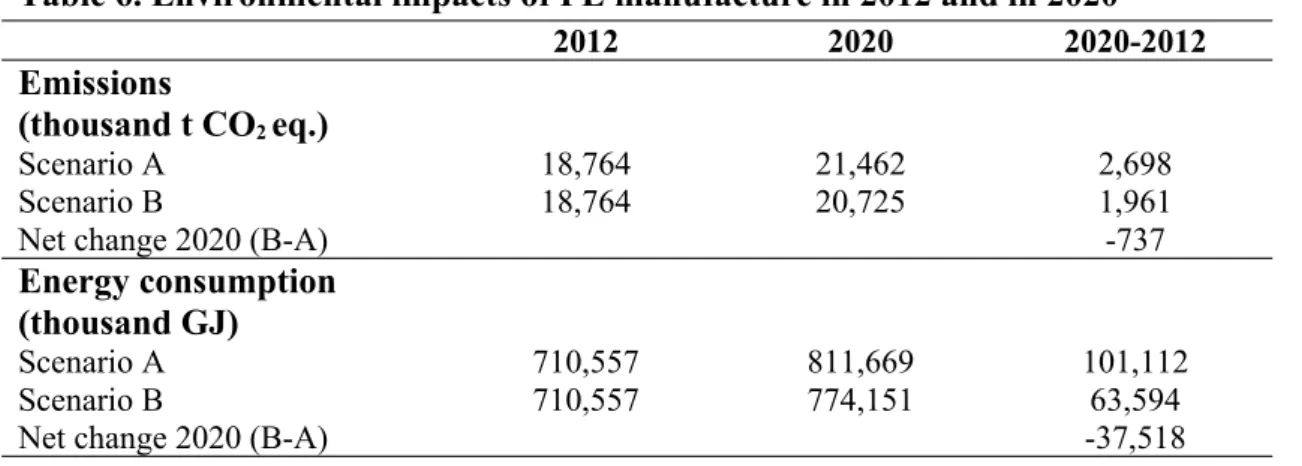
Table 6. Environmental impacts of PE manufacture in 2012 and in 2020
2012 2020 2020-2012
Emissions
(thousand t CO2 eq.)
Scenario A 18,764 21,462 2,698
Scenario B 18,764 20,725 1,961
Net change 2020 (B-A) -737
Energy consumption (thousand GJ)
Scenario A 710,557 811,669 101,112
Scenario B 710,557 774,151 63,594
Net change 2020 (B-A) -37,518
5. Limitations and future developments
A number of assumptions were made in this paper to deal with the limited availability of data. In particular:
data included in Plastics Europe (2011) have been used to disaggregate the total quantity of PE waste provided by Eurostat according to the classification reported in Table 1.
Implementation of best practice recycling rate and kerbside collection: the recycling rate for every country is assumed to increase with a constant trend between 2013 and 2020. However, it must be kept in mind that setting such a timeframe may not always be realistic. Due to discrepancies in local markets, facilities, investment capacities, or human resources some Member States may be able to meet the targets faster than others.
Cost of waste collection, treatment, recycling and revenue from energy and recycled material: the costs have been inflated up to 2020 prices. According to the inflation target of the EU, a yearly 2% price increase has been considered in this paper. However, based on specific technological development hypotheses, it might be possible to include different trends on prices and revenues.
The number of jobs provided by Eurostat is available for the waste management sectors at aggregated level. The numbers of jobs related to PE management have been calculated as a proportion of the PE waste over the total waste generated.
Environmental coefficients: Since data on energy and CO2 equivalent emissions are not available for every single Member State, the Ecoinvent data have been used at EU aggregated level. These coefficients are applied for the time period 2012-2020. However, based on technological developments and differences between Member States, improvements in energy efficiency and emissions reduction might be included in the model.
The gross domestic product variation is assumed to be 2% a year between 2013 and 2020. However, different rates can be used to identify the impacts that economic growth/degrowth could generate on PE consumption and waste.
different production and waste management technologies would be needed to provide better estimations of the total environmental impacts generated at EU and Member State level. Secondly, according to the structure of the model, imports and exports of PE and recycled material, together with stocks in societies and production losses, could be added to model the extra-EU impacts generated by PE recycling and waste reduction policies. In addition, the impacts and effectiveness of market-based incentives or taxation for recycling and waste reduction could be introduced into the model.
6. Conclusion
This paper quantified the socio-economic and environmental impacts generated by different scenarios for polyethylene (PE) waste production and polyethylene waste management and recycling in the EU as a whole and the 27 individual Member States. Using data provided by Eurostat, National Statistics, Plastics Europe, Europe’s Energy, the Ecoinvent database and previous EU reports, a PE model has been specifically designed to account for PE production and PE waste management. In this paper two main scenarios have been considered. The first one is a “business as usual scenario” where the 2012 performances on PE waste production and PE waste management and recycling are extrapolated to 2020. The second one considers the full implementation of the best available recycling practices together with the reduction in the consumption of single-use plastic bags and the adoption of a kerbside collection system. The main results show that significant socio-economic and environmental benefits could be generated across the EU by the implementation of the best practices scenario. In particular:
A reduction of 4.4 million tonnes of non-recycled PE waste, together with a reduction of €90 million in waste management costs, is expected to take place in 2020.
As a consequence, the quantity of CO2 equivalent emissions should reduce by around 1.46 million tonnes. However, the total energy requirement should increase by 17 million GJ, calculated as the difference between the reduction of the energy produced from waste and the energy required for PE production and for PE waste management.
The number of waste management-associated jobs is expected to increase in both scenarios. However, in the best practice scenario the number of jobs created has been estimated to be 35,600 higher than in the business as usual scenario.
kerbside collection system would be able to generate socio-economic and environmental benefits across the EU, with some differences between Member States. However, considering that the data used in this paper have not been able to take into account technological developments or faster adoption paths, the benefits expected in reality could be greater than the results presented in this paper. The scenario modelled in the present version of the paper is a middle ground scenario where improvement on recycling rate and PE consumption are expected to take place in line with the recent revision of the waste legislations and directives. More ambitious scenarios could also be modelled and the impacts on socio-economic and environmental variables could be estimated to identify the consequences that more challenging targets could generate at EU or at Member State level. In both cases, however, a careful analysis of the short and long term benefits and costs should be taken into account together with an objective evaluation of the feasibility of any kind of requirements.
Additional data and some model development oriented to include more socio-economic and environmental variables could be added to the modelling framework presented in this study. In general terms, however, the analysis presented is a good starting point to support the development and analysis of new EU policy proposals oriented towards recycling and PE waste reduction.
The accounting model developed in this study provides several advantages and generates new options for the evaluation of policy measures and the design of new policy proposals. By focussing on a single component of waste, rather than on the entirety of a mixed municipal or industrial waste stream, this study was able to model socio-economic impacts related to changes in the management of a specific material encountered in these waste streams. Such component-specific analysis can help in identifying how overall environmental benefits from (new) waste policy measures can be attributed to the different building blocks of the waste flow. This type of analysis could also assist in assessing the impacts of targeted policy options, such as measures to reduce single-use plastic bags, by highlighting the benefits and challenges of these material-specific measures. As such, it may help in complementing or rethinking existing waste policy measures that may have limited effects for certain elements of the waste flow. For example, low-density materials such as plastics may receive low priority in policy tools aimed at improving recycling rates on a weight basis, but could benefit from measures based on overall emission savings in waste management.
References
Al-Salem, S.M., Evangelisti, S., Lettieri, P., 2014. Life cycle assessment of alternative technologies for municipal solid waste and plastic solid waste management in the Greater London area. Chem. Eng. J. 224, 391-402.
Antonopoulos, E.S., Perkoulidis, G., Logothetis, D., Karkanias, C., 2014. Ranking municipal solid waste treatment alternatives considering sustainability criteria using the analytical hierarchical process tool. Resour. Conserv. Recy. 86, 149-159.
Arafat, H.A., Jijakli, K., Ahsan, A., 2014. Environmental performance and energy recovery potential of five processes for municipal solid waste treatment. J. Clean. Prod. (in press).
BIOS IS/Eudomia/IEEP/Ecologic, 2012. Use of Economic Instruments and Waste Management Performance. Final Report for DG Environment, April 2012.
Cherubini, G., Bargigli, S., Ulgiati, S., 2009. Life cycle assessment (LCA) of waste management strategies: Landfilling, sorting plant and incineration. Energy J. 34, 2116-2123.
Cleary, J., 2009. LCA of municipal solid waste management systems: a comparative analysis of selected peer-reviewed literature. Environ. Int. 35, 1256-1266.
Cossu, R., Masi, S., 2013. Re-thinking incentives and penalties: Economic aspects of waste management in Italy. Waste Manage. 33(1), 2541-2547.
Cucchiella, F., D’Adamo, I., Gastaldi, M., 2014. Sustainable management of waste-to-energy facilities. Renew. Sust. Energ Rev. 33, 719-728.
Ecoinvent v.2.2 database: http://www.ecoinvent.org/ Accessed on 10/04/2015
EEA. 2011. Earnings, jobs and innovation: the role of recycling in a green economy. EEA Report No 8/2011. Copenhagen, Denmark: European Environmental Agency; 2011, ISSN 1725–9177. Ekvall, T., Assefa, G., Eriksson, O., Finnveden G., 2007. What life-cycle assessment does and does
not do in assessments of waste management. Waste Manage. 27, 989-996.
Emery, A., Davies, A., Griffiths, A., Williams, K., 2007. Environmental and economic modelling: a case study of municipal solid waste management scenarios in Wales. Resour. Conserv. Recy. 49, 244-263.
Environmental Action Programme: http://ec.europa.eu/environment/newprg/
Eriksson, O., Bisaillon, M., 2011. Multiple system modelling of waste management. Waste Manage. 31, 2620-2630.
ETC/SCP, 2012. Waste Implementation Project: Ex-post MSW Analysis – Reports produced for the European Environmental Agency.
Eunomia, 2002. Costs for Municipal Waste Management in the EU. Final Report and Annexes to DG Environment, European Commission.
EUROPE 2020 website: http://ec.europa.eu/europe2020/index_en.htm . Accessed on 10/04/2015 Europe’s Energy website: http://www.energy.eu/#fueltaxes Accessed on 10/04/2015
European Environmental Agency website: www.eea.europa.eu
Eurostat Energy Statistics Database. Available at-, http://epp.eurostat.ec.europa.eu/portal/page/portal/ energy/data/database Accessed on 10/04/2015
Eurostat, 2014: http://epp.eurostat.ec.europa.eu/cache/ITY_PUBLIC/2-14022014-AP/EN/2-14022014-AP-EN.PDF
Ferrao, P., Ribeiro, P., Rodrigues, J., Marques, A., Preto, M., Amaral, M., Domingos, T., Lopes, A., Costa, I., 2014. Environmental, economic and social costs and benefits of a packaging waste management system: A Portuguese case study. Resour. Conserv. Recy. 85, 67-78.
Finnveden, G., Bjorklund, A., Moberg, A., Ekvall, T., 2007. Environmental and economic assessment methods for waste management decision-support: possibilities and limitations. Waste Manage. Res. 25, 263-269.
Herva, M., Neto, B., Roca, E., 2014. Environmental assessment of the integrated municipal solid waste management system in Porto (Portugal). J. Clean. Prod. 70, 183-193.
Herva, M., Roca, E., 2013a. Ranking municipal solid waste treatment alternatives based on ecological footprint and multi-criteria analysis. Ecol. Indic. 25, 77-84.
Herva, M., Roca, E., 2013b. Review of combined approaches and multi-criteria analysis for corporate environmental evaluation. J. Clean. Prod. 39, 355-371.
Hoornweg, D., Bhada-Tata, P., Kennedy, C., 2013. Environment: waste production must peak this century. Nature 502, 615-617.
Klang, A., Vikman, P., Brattebo, H., 2003. Sustainable management of demolition waste – an integrated model for the evaluation of environmental, economic and social aspects. Resour. Conserv. Recy. 38, 317-334.
Impact Assessment Document is available at: http://eur-lex.europa.eu/legal-content/EN/TXT/PDF/? uri=CELEX:52013SC0444&from=EN Accessed on 10/04/2015
International Organization for Standardization (ISO) 2006a. Environmental management - Life cycle assessment - Principles and framework. ISO 14040:2006; Second Edition 2006-06, Geneva. International Organization for Standardization (ISO) 2006b. Environmental management - Life cycle
assessment - Requirements and guidelines. ISO 14044:2006; First edition 2006-07-01, Geneva. International Organization for Standardization (ISO) LCA methodology:
Larsen, A.W., Merrild, H., Moller, J., Christensen, T.H., 2012. Waste collection systems for recyclables: an environmental and economic assessment for the municipality of Aarhus (Denmark). Resour. Conserv. Recy. 30, 744-754.
Laurent, A., Bakas, I., Clavreul, J., Bernstad, A., Niero, M., Gentil, E., Huschild, M.Z., Christensen, T.H., 2014. Review of LCA studies of solid waste management systems – Part I: Lessons learned and perspectives. Waste Manage. 34, 573-588.
Lilja, R., 2009. From waste prevention to promotion of material efficiency: change of discourse in the waste policy of Finland. J. Clean. Prod. 17, 129-136.
Massarutto, A., de Carli, A., Graffi, M., 2011. Material and energy recovery in integrated waste management systems: A life-cycle costing approach. Waste Manage. 31, 2102-2111.
Menikpura, S.N.M., Sang-Arun, J., Bengtsson, M., 2013. Integrated Solid Waste Management: an approach for enhancing climate co-benefits through resource recovery. J. Clean. Prod. 58, 34-42. Milutinovic, B., Stefanovic, G., Dassisti, M., Danijel, M., Vuckovic, G., 2014. Multi-criteria analysis
as a tool for sustainability assessment of a waste management model. Energy J. 74, 190-201. OECD, 2013. Environment at a Glance: OECD Environmental Indicators, OECD Publishing, Paris Plasticker website:http://plasticker.de/preise/marktbericht2_en.php?j=12&mt=9&quelle=bvse
Plastic europe’s eco-profiles: http://www.plasticseurope.org/documents/document/20110421141821-plasticseurope_eco-profile_methodology_version2-0_2011-04.pdf. Accessed on 10/04/2015 Plastics Europe, 2011, Plastics – The Facts 2011: An Analysis of European Plastics Production
Demand and Recovery for 2010.
Plastics Europe’s eco-profiles: http://www.plasticseurope.org/plasticssustainability/eco-profiles.aspx Reich, M.C., 2013. An Economic assessment of municipal waste management systems – case studies
using a combination of life cycle assessment (LCA) and life cycle costing (LCC). J. Clean. Prod. 13, 253-263.
Resource Efficiency Roadmap: http://ec.europa.eu/environment/resource_efficiency/ Accessed on 10/04/2015
Raw Materials Initiative: http://ec.europa.eu/enterprise/policies/raw-materials/index_en.htm
Simpson, D., 2012. Knowledge recourses as a mediator of the relationship between recycling pressures and environmental performance. J. Clean. Prod. 22, 32-41.
Song. Q., Wang, Z., Li, J., 2013. Environmental performance of municipal solid waste strategies based on LCA method: a case study of Macau. J. Clean. Prod. 57, 92-100.
Tabasova, A., Kropac, J., Kermes, V., Nemet, A., Stehlik, P., 2012. Waste-to-energy technologies: Impact on environment. Energy J. 44, 146-155.
Tan, S.T., Lee, C.T., Hashim, H., Ho, W.S., Lim, J.S., 2014. Optimal process network for municipal solid waste management in Iskandar Malaysia. J. Clean. Prod. 71, 48-58.
UNEP-SETAC Live Cycle Initiative: http://www.lifecycleinitiative.org/ Accessed on 10/04/2015 WRATE:http://www.wrate.co.uk/Page/Download Accessed on 10/04/2015
← ←