Article
Technical Efficiency and Its Determinants of
Rice Production in Cambodia
Sokvibol Kea 1,2, Hua Li 1,* and Linvolak Pich 3
1 College of Economics and Management (CEM), Northwest A&F University, 712100 Shaanxi, China; [email protected]
2 Faculty of Sociology & Community Development, University of Battambang, 053 Battambang, Cambodia 3 College of Water Resources and Architectural Engineering (CWRAE), Northwest A&F University,
712100 Shaanxi, China; [email protected]
* Correspondence: [email protected]; Tel.: +86-133-6393-6398
Abstract: The present study aims to measure the technical efficiency and establish core factors effecting rice production in Cambodia. Four-years dataset generated from the central government document “Profile on Economics and Social” of entire 25 provinces between 2012-2015 and the stochastic production frontier model (SFA) was applied. The results indicated that the level of output (quantity) of Cambodian rice production varied according to the different level of capital investment in agricultural machineries, total rice actual harvested area, and technically fertilizers application within provinces. Furthermore, evidence revealed the overall mean efficiency of rice production is 78.4% implies that there is still room to further improve technical efficiency by given the same level of inputs and technology. More importantly, the findings revealed that irrigation, production technique and amount of agricultural supporting staffs are being as the most important influencing factors of rice production’s technical efficiency in Cambodia. In conclusion, present study strongly recommends the development of irrigation systems and good water management practices to be considered and bring into more effective actions by the central government as well as related agencies for improving rice production in Cambodia in addition to capital investment and improving technical skills of supporting staffs and rural farmers.
Keywords: technical efficiency; SFA; rice production; Cambodia; agriculture; productivity
JEL Classification: C01; C33; C51; C87; E23; M11; O33
1. Introduction
Economy of Cambodia is largely dependent on agricultural sector which contributes 27% of national GDP (Gross Domestic Product) in which 65% of the labor force are engaged [1]. Growth in agricultural sector has played a crucial role in the development of Cambodia [2]. Since 2004, garments, construction, agriculture, and tourism have driven Cambodia's growth. Between 2010-2013, GDP climbed more than 7% annually [3], and GDP per capita in purchasing power parity has increased from $2,462 (US Dollar) in 2010 to $3,056 in 2013 [4]. However, although Cambodian’s per capita income is rapidly increasing, it still remains low compared to other nations in the region. Most rural households depend on agriculture and its related sub-sectors; and rice, fish, timber, garments and rubber are Cambodia's major export products [3].
dominated most agricultural economies in the world, particularly in developing countries like Cambodia.
Having similar characteristics to other agricultural crops, nowadays the growth of rice production yield seems to depend on three important aspects: (a) enlarging planting areas, (b) increasing input of material factors, and (c) raising productivity gradually [6]. Due to the limitation of planting area and material input factors, along with the result of rapid population growth from 11.4 million in 1998 to 15.5 million in 2014 [7, 8] and, thus, an increasing demand of land areas and material input factors for non-farm activities, raising productivity of rice production should be the most preferable factor among the three factors previously described.
Khmer farmers have been growing rain-fed rice for at least 2,000 years, possibly longer in the case of upland rice [9]. Today, rice production still serves as the foundation of Cambodian economy. Between 1980-2010, rice production yield has been doubled from 1.21 tons/ha to 2.97 tons/ha [10]. However, productivity of Cambodian rice still has been relatively low compared to other Asian countries, such as Myanmar, Indonesia, Vietnam, Japan, South Korea, and China where rice productivity in 2010 was recorded 4.12 tons/ha, 5.01 tons/ha, 5.32 tons/ha, 6.51 tons/ha, 6.51 tons/ha, and 6.55 tons/ha respectively [11]. Therefore, in order to raise the productivity of rice production in Cambodia, it is important to identify the core factors influencing it.
The main objective of this study was to measure the technical efficiency (hereafter, TE) of rice production in Cambodia. Additionally, the study was also trying to identify core influencing factors of TE in order to explain the possibilities of increasing productivity and profitability of rice by increasing efficiency at provincial level, as well as identify what technical progress policy should be recommended to help decision-makers to increase the rice productivity in Cambodia. The results of this study will be useful for both rice producers and policy makers in government and all other stakeholders along the rice value-chain including development agencies, non-government organizations (NGOs) and many other related parties working towards improving rice production and the agricultural sector at large.
The rest of this article is organized as follows: section 2 presents analytical frameworks and methodology for measuring rice production TE, while in section 3 the data and descriptive statistics of output and input variables is presented. The results are presented, compared, and discussed in section 4. Finally, conclusion remarks are offered in Section 5.
2. Methodology
In the economics literature, productivity refers to the amount of output(s) obtained from given levels of input(s) in an economy or a sector. It is an important topic of study, since productivity is one of the two fundamental sources of larger income streams; the other being savings, which permit more inputs for employment [12]. Coelli, Rao [13] argued that productivity is the ratio of the output(s) that it produces to the input(s) that it uses [Productivity = Output(s) / Input(s)]. In other words, productivity is raised when growth in output(s) outpaces growth of input(s). Productivity growth without an increase in input(s) is the best kind of growth to aim for rather than attaining a certain level of output [14]. Nevertheless, measuring the total input and total output is both conceptually and empirically difficult. Methods to estimate productivity and efficiency that commonly and frequently implement in most of today’s empirical works are data envelopment analysis (DEA) and stochastic frontier analysis (SFA), which are non-parametric approach and parametric approach respectively.
deviations from the frontier1 are due to inefficiency, which is made by DEA, may be a courageous
assumption. Thus, only a small percentage of agricultural frontier applications have used the DEA approach to frontier estimation. However, DEA has a very large following in other professions, especially in the management science literature, and in applications to service industries where there are multiple outputs, such as banking, health, telecommunication and electricity distribution, include [16],[17],[18],[19],[20], etc. Another benefit of SFA approach is determinants of inefficiency which allowed external factors affecting efficiency of firms to be determined where unavailable in DEA approach. SFA, hence, was applied by a large number of papers in the recent years, particularly in agricultural researches. For instance, the studies implemented SFA approach include [21],[22],[23], [24], etc. Further detailed discussion of the differences between DEA and SFA has been given in Coelli [15]. Therefore, SFA was also being applied to the present study.
Productivity and efficiency studies have taken the attention of most economists and policy makers in recent years, since there is no meaningful welfare improvement and economic development can take place in the absence of productivity growth [10]. Productivity is a basic and intuitive measure of performance. Furthermore, total factor productivity (TFP2) is a method of
measuring businesses performance. TFP is used both in competitive and regulated industries, such as electricity distribution companies [26] for instance. It is a method of measuring productivity and growth, which is a productivity measurement involving all factors of production. Other traditional measures of productivity, such as labor productivity in a factory, fuel productivity in power stations, and land productivity (yield) in farming, are often called partial measures of productivity. These partial productivity measures can provide a misleading indication of overall productivity when considered in isolation [27].
However, agricultural productivity and efficiency studies as well as rice production efficiency studies in Cambodia seem to be very poor. Most of research works were conducted by the related government agencies, such as National institute of statistics (NIS), Ministry of agriculture, forestry and fishery (MAFF), Cambodia Development Resource Institute (CDRI), Cambodia Agricultural Research and Development Institute (CARDI), etc. Thus, only a few research works were conducted by the scholars. Given the scarcity of literature on efficiency in Cambodia, the present study therefore seeks to augment literature and contribute in many ways to bridge the gap and supplement the shortage.
The objective of this study was achieved through the estimation and analysis of the stochastic production frontier model (hereafter, SFA model), originally proposed by Aigner, Lovell [28], and Meeusen and Van den Broeck [29]. The most commonly used package for estimation of SFA model is FRONTIER 4.1c, see Coelli [30]. The general form of the SFA model:
= ( , ; ) + − (1)
where Ln indicates the natural logarithm function form; and denote rice production output(s) and input(s) within period t respectively; represent estimated coefficients; is statistical random error, assumed to be normal distribution, ~ (0, ); denotes technical inefficiency, assumed to be truncated normal distribution, ~| (0, )|; and are assumed to be independent; i=1,2,…,N; N is number of measurement unit ( ), i.e. total samples; and t is time variable measured as year, t=1,2,…,T.
The present study utilized the logarithmic form of translog production function, thus equation (1) above can be written as:
1 According to 15. Coelli, T.J., Recent Developments in Frontier Modeling and Efficiency Measurement. Australian Journal of Agricultural
Economics, 1995. 39(3): p. 219-245. “Frontier” refers to a bounding function, which provided benefits of heavily influencing of the best
performing firms in in a field (of economics), that always reflect the technology they are using. Additionally, the frontier function represents
a best-practice technology against which the efficiency of firms within the industry can be measured.
2 Also called multi-factors productivity (MFP) in some lectures, like 25. Zheng, S. and H. Bloch, Australia’s mining productivity
= + ∑ + t + ∑ ∑ + + ∑ + − (2)
The technical inefficiency effect can be expressed in following general form:
= + ∑ + (3)
where is the stochastic noises; denotes exogenous variables that are factors affecting Cambodia's rice production TE; and are estimated coefficients; if is negative indicates positive relationship between affecting factor variables and TE of rice production, conversely, if is positive shows negative relationship between TE and affecting factors.
Followed by equation (2) and (3), the parameters estimation of SFA model can be achieved by applying maximum likelihood estimation method, which estimates the likelihood function in terms of two variance parameters, see Coelli [31]:
= ⁄ ; = + (4)
Gamma ( ) takes value between zero and one (0 ≤ ≤ 1), reflects validity of the random disturbances ( , ) proportion. If is closer to zero, it indicates that the gap between actual output and the maximum possible output mainly comes from other uncontrolled pure random factors, which makes the use of stochastic frontier model meaningless. In contrast, if is closer to one, it shows that the gap comes mainly from the effects of one or more exogenous variables , indicates using stochastic frontier production function model is more appropriate.
Rice production TE of every can be estimated by the ratio of observed output relative to the potential output defined by SFA model, as follow:
= ⁄ ( , )= (− ) ≤ 1 (5)
TE value is always smaller or equal to one. When TE equal to one, indicates in the samples is fully technical efficiency. Therefore, the closer of TE value to one indicates the higher TE of rice production.
Technical efficiency change (hereafter, TEC) of every between period t and t+1 is the ratio of TE in period t+1 to its TE in period t, which can be expressed as the following formula:
, = ⁄
(6)
3. Data and descriptive statistics
The data used for present study were drawn from the document sets of the Royal Government of Cambodia (hereafter, RGC), namely “Profile on Economics and Social” of entire 25 provinces in Cambodia (24 provinces and 1 municipality, Phnom Penh) from 2012 to 2015 (4-years dataset) [32, 33]. These document sets were prepared by Provincial Department of Planning of every province based on computer program namely Commune Database (CDB) that provided derived-data from village and commune data books which are annually documented and kept at commune/sangkat and village chief or village representative who is member of Planning and Budgeting Committee.
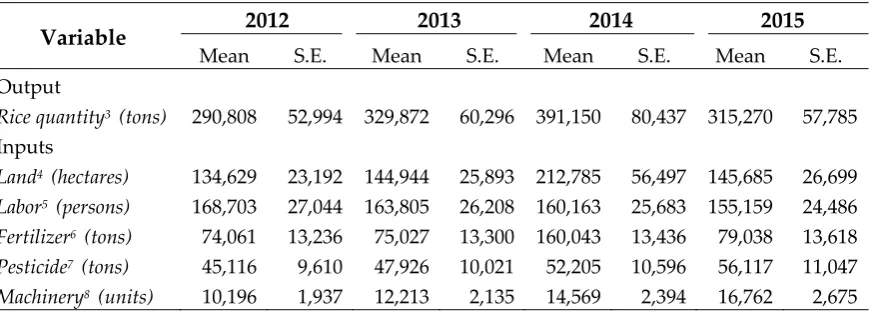
and Prey Veng where around 279 and 268 thousand hectares of rice area were respectively harvested in 2015 and produced more than 798 and 803 thousand tons of rice output (respectively), which was much higher compared to Phnom Penh suburbs that harvested on only 11 thousand hectares and produced about 2 thousand tons within this year [33]. Harvested area (i.e. land input), hence, was expected to have positive effect on provincial as well as total rice output. Labor input, on the other hand, measured as total farmers with rice farming as primary occupation (hereafter, rice farmers), unit in persons. According to dataset from RGC [32, 33], provinces with higher rate of rice farmers tended to produce higher amount of rice output since rice remains as their provincial dominant crop as well as the dominant commodity. Thus, labor input was also expected to have positive effect on rice output. Furthermore, fertilizer input measured as total amount of chemical and organic fertilizers’ quantity using by total families cultivating rice (hereafter, rice families) in the province (unit in tons), while pesticide input also measured as total amount of poisons for insects and grass’s quantity (for both chemical and organic poisons) using by total rice families in the province, unit in tons. Followed by the concept of green revolution [35], these two input variables were also expected to be positively related to rice output. Additionally, another important input variable was determined as the variable of capital investment on agricultural machineries which measured as total amount of tractors, walking tractors (“koryons” in Khmer language), and rice transplanting machines existing in the provincial territory. This input variable was also expected to have positive effect on rice output as well. Along with the global technological expansion, the development of agricultural sector was inevitably linked to the mechanization improvement as many works/tasks in agricultural production, particularly rice production in Cambodia (which normally is labor-intensive), could be completed faster and greater with the performances of these machineries. Table 1. provides summary statistics of the output and inputs of rice production within entire 25 provinces in Cambodia from 2012 to 2015.
Table 1. Input and output summary statistics for 25 rice producing provinces in Cambodia, 2012-2015
Variable 2012 2013 2014 2015
Mean S.E. Mean S.E. Mean S.E. Mean S.E. Output
Rice quantity3 (tons) 290,808 52,994 329,872 60,296 391,150 80,437 315,270 57,785
Inputs
Land4 (hectares) 134,629 23,192 144,944 25,893 212,785 56,497 145,685 26,699
Labor5 (persons) 168,703 27,044 163,805 26,208 160,163 25,683 155,159 24,486
Fertilizer6 (tons) 74,061 13,236 75,027 13,300 160,043 13,436 79,038 13,618
Pesticide7 (tons) 45,116 9,610 47,926 10,021 52,205 10,596 56,117 11,047
Machinery8 (units) 10,196 1,937 12,213 2,135 14,569 2,394 16,762 2,675 Source: Measured by Ms. Excel 2016 using combined datasets of RGC [32, 33]. “S.E.” = Standard Error.
Output quantity of rice production in Cambodia was higher in 2015 than in 2012 which increased 8.4% in average from 290 thousand tons (2012) to 315 thousand tons (2015). Total area of rice actually harvested in average also increased around 8% from 134 thousand hectares in 2012 to 145 thousand
3Rice quantity was the total provincial un-milled rice production output quantity, measured in tons
4Land input was the total area of rice actually harvested within the year (included both in wet and dry season), measured in hectares
5Labor input measured as total farmers in the province with rice farming as primary occupation, unit in persons
6Fertilizer input was total amount of chemical and organic fertilizers’ quantity using by total rice families in the province, unit in tons
7Pesticide input measured as total amount of chemical and organic poisons for insects and grass’s quantity using by total rice families in
the province, unit in tons
8Machinery measured the capital investment on agricultural machineries was the total amount of tractors, walking tractors (koryons), and
hectares in 2015. Total rice families using quantity of chemical and organic fertilizers (i.e. fertilizer input), on the other hand, increased in average by 7%, while pesticide and machinery input (definition same as above) increased greatly between this period. Total rice families using quantity of poison for insects and grass increased by nearly 25% (3-times larger than land and fertilizer input), while the total capital investment on agricultural machineries between this period increased by a huge percentage of 64.4%, indicated a huge improvement of mechanization in Cambodian agriculture, particularly in rice production sector. Nevertheless, along with the improvement of agricultural mechanization, labor input which measured as total people with rice farming as primary occupation tended to slightly decrease by 8%, presented the progression of transformation of labor forces out of agriculture to other higher productivity and profitability sectors, such as industries and services.
Figure 1. illustrates the percentage changes of input and output statistics of Cambodian rice production between the study period 2012-2015. A closer look to percentage changes within output and input variables from year to year indicated that from 2012 to 2013, there were not significantly changed within both output and input variables. However, there were a massive change in inputs, particularly in land and fertilizer between 2013-2014 which caused rice output to increased greatly. Unfortunately, the natural disasters (drought, flood, and insects) at the end of 2014 and in 2015 had destroyed a huge percentage of rice cultivated land in most leading rice production provinces (totally reduced around 30% of 2014 production) and fertilizer input was also decreased greatly (by more than 50%). Rice output, therefore, also decreased by a great percentage of 20%. Conversely, development of capital investment in agricultural machineries still continued to increase by 15-20% per year, while implementation of pesticide by farmers tended to increased 6-9% annually as well. Labor input, on the other hand, had the decreasing trend from year to year in the percentage of 2-3%.
Figure 1. Percentage changes in input and output statistics for 25 rice producing provinces in Cambodia for the periods 2012-2013, 2013-2014, and 2014-2015
In the technical inefficiency model (3), there were seven influencing factors of rice production TE to be considered in the present study. Disaster measured as percentage of rice production land damaged by floods, droughts, and insects to total rice production land actually harvested within the year. Apparently, disaster always caused the lower of harvested land to cultivated land ratio. Thus, disaster was expected to have negative effect on rice production TE. Irrigation, on the other hand, measured as percentage of provincial paddy land having or benefit from irrigation systems (as well as paddy land located near water sources, such as rivers, lakes, ponds, etc.) to total provincial
-60 -40 -20 0 20 40 60 80 100 120
2012-2013 2013-2014 2014-2015
Pe
rce
n
tag
e
cultivated land within the year. Irrigation systems could cause the availability of rice cultivated land expansion by improving multi-cropping9, hence, irrigation was stalwartly expected to have positive
relationship with rice production TE. Additionally, production technique measured as percentage of families cultivating rice under the system of rice intensification (SRI) to total families cultivating rice. Under SRI which introduced by MAFF with the supporting of CEDAC10, various rice cultivation
techniques with less utilization of modern inputs and inexpensive method of planting in relatively dry area could result in an average yield of 3.6 ton/ha, while under a similar situation the yield with traditional farming practice is only 2.4 ton/ha [36]. Farmers cultivated rice under SRI were expected to have higher productivity than farmers using traditional techniques for cultivating rice. However, the percentage of families cultivating rice under this system still seem to be very low in Cambodia. Furthermore, farmers living in villages located closer to the center of district/khan might be able to get further and faster market information about rice, hence, this factor of distant to information sources was measured as average distance from village center to the center of district/khan (in kilometers). Agricultural staffs, on the other hand, might have played some crucial roles for providing technical supports as well as technical knowledge of rice production to the rural farmers. Thus, number of agricultural supporting staffs existing in province was expected to have positive effects on TE of rice production. The variable of agricultural supporting staffs was included in technical inefficiency model (3), measured as percentage of agricultural staffs included both government officers and NGOs staffs (working on agricultural plans or projects) to total rice farmers existing in the province. Likewise, there are two main seasons in Cambodia, i.e. wet season and dry season. Greater availability of water resource during wet season have caused rice crop to be able to grow in every provinces of Cambodia. However, during dry season only some provinces (as well as some parts of a province) where rice fields benefit from irrigation systems or located near water sources could be able to cultivated rice crop. Dry season rice crop always provides higher yield of production, nonetheless it requires plenty of water and utilization of fertilizers, as well as higher commitments to watch over. However, rice production during dry season of Cambodia was still highly depends on availability of water resources during this season. Available land for cultivating rice during dry season sometimes was abundance due to the lack of water. Thus, the improvement of dry season rice was expected to have positive effect on TE of rice production in Cambodia. The factor of dry-season production measured as percentage of dry-season paddy land actually harvested to total available land for rice cultivation in dry-season was correspondingly included in the model. Size of farm land owned by farmers was also expected to have positive effect on rice production TE. The great percentage of rice farmers owning farm land less than one hectare, which might cause limited ability for them to improve their rice production. This factor (small-land farmers) measured as percentage of families having paddy land smaller than one hectare altogether with families having no paddy land to total rice families. Conversely, some external factors, such as social, economic, demographic, as well as geographic perspectives of each province were omitted from the technical inefficiency model (3), due to un-sufficient availability of appropriated datasets during the study period. Furthermore, the present study utilized only four-years dataset of entire 25 provinces of Cambodia, which limited availability to included too many influencing factors into the model as it might cause unexpected conflicts or correlations among factor variables. Moreover, provinces of Cambodia were quiet tiny in area and normally the local governance as well as economy are still under directly controlled by the central government in Phnom Penh (i.e. provincial local government in Cambodia are not much independence from each other as the situation in other countries like China for instance). Therefore, the present study assumed these external factors to be neutral to rice production TE. Thus, equation (3) can be written as:
= + + + ℎ + + + + (7)
9 Multi-cropping: cropping/cultivating several times of crop on the same plot land
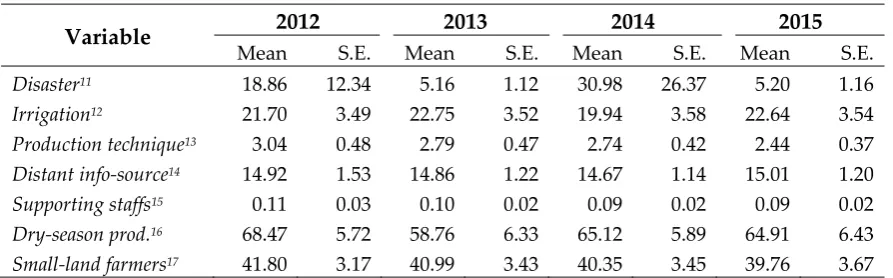
Table 2. Descriptive statistics of factors affecting the efficiency of rice production in Cambodia, 2012-2015
Variable 2012 2013 2014 2015
Mean S.E. Mean S.E. Mean S.E. Mean S.E.
Disaster11 18.86 12.34 5.16 1.12 30.98 26.37 5.20 1.16
Irrigation12 21.70 3.49 22.75 3.52 19.94 3.58 22.64 3.54
Production technique13 3.04 0.48 2.79 0.47 2.74 0.42 2.44 0.37
Distant info-source14 14.92 1.53 14.86 1.22 14.67 1.14 15.01 1.20
Supporting staffs15 0.11 0.03 0.10 0.02 0.09 0.02 0.09 0.02
Dry-season prod.16 68.47 5.72 58.76 6.33 65.12 5.89 64.91 6.43
Small-land farmers17 41.80 3.17 40.99 3.43 40.35 3.45 39.76 3.67 Source: Measured by Ms. Excel 2016 using combined datasets of RGC [32, 33]. “S.E.” = Standard Error.
Table 2. presents descriptive statistics of Cambodian rice production efficiency’s influencing factors between 2012-2015. Percentage of rice land damaged by floods, droughts, and insects was lower in 2015 compared to 2012. Rice land damaged by disasters in 2012 was 18.8% in average, while in 2015 disasters destroyed only 5.2% of rice production land in average (decreased by 72.4%). However, flooded in wet season of 2014 have still destroyed almost 30% of total rice cultivated land within the year. These percentages still remain huge, which ought to be considered by RGC and the related agencies. Furthermore, from 2012 to 2015, there were also large percentage changes in rural farmers’ production technique and amount of agricultural supporting staffs existing the province. Production technique which measured as percentage of families cultivating rice under SRI decreased greatly by 20% within 3 years, while percentage of agricultural supporting staffs (to total rice families) also decreased by around 17% during this period, indicated lack of technical supporting techniques as well as technical improvement training for farmers in the purpose of improving the national rice production, particularly for small-land rural farmers which most of them are rice farmers. Although percentage of small-land farmers (farmers owned no rice cultivated land or having rice land smaller than one hectare) have been slightly reduced during the study period (less than 5%), in 2015 small-land farmers in Cambodia still accounted for 39.8% in average which was still the vast percentage. Moreover, during the dry season, available land for cultivating rice still not fully cultivated yet. In the study period 2012-2015, in average more than 30% of available dry season rice land was abundant annually. During 2012, in average only 68.5% of the total available dry-season rice production land had been actually cultivated and this percentage became worse in 2013 (58.8%). Although situation had been faintly improved in 2014 while this percentage slightly increased to 65.1%, water shortage during the dry season of 2015 had reduced the percentage of dry-season actually cultivated again to around 64.9%. Therefore, there is still a huge gap for Cambodian famers to improve their rice production during dry season as well as total production of rice.
11Disaster measured as percentage of rice land damaged by floods, droughts, and insects to total rice actual harvested land within the year
12Irrigation measured as percentage of provincial paddy land having or benefit from irrigation systems as well as paddy land located near
water sources to total provincial cultivated land within the year.
13Production technique measured as percentage of families cultivating rice under the SRI system to total rice cultivated families
14Distant to information sources measured as average distance from village center to the center of district/khan (in kilometers)
15Agricultural supporting staffs measured as percentage of agricultural staffs included both government officers and NGOs staffs (working
on agricultural plans or projects) to total rice farmers existing in the province
16Dry-season production measured as percentage of paddy land actually harvested during dry season to the total available cultivated land
for rice cultivation during dry season
17Small-land farmers measured as percentage of families having paddy land smaller than one hectare altogether with families having no
Irrigation plays as a very important role for rice production in Cambodia, particularly in dry-season. Between 2012-2015, irrigation systems were improved gradually by increased the percentage of paddy land having irrigation system from 21.7% in 2012 to 22.6% in 2015 (3.5% increased within 3 years). However, this irrigation rate still seems to be very low compared to other agricultural nations, especially its neighboring countries like Thailand, and Vietnam, since another nearly 80% of total cultivated land still being performance as the rain-fed agricultural land. These statistics reveled that irrigation systems in Cambodia still remain lack, shortage far behind its potential to improve the national rice production. In many developed countries, irrigation systems were not only used for agriculture, but also being used as natural disasters prevention devices. Global climate change had been affecting Cambodia in the latest decade. Natural disasters like floods and droughts occurred more frequently than previous times. Sometimes, within a year, Cambodian people suffered from flood in wet-season, and then suffered again from droughts in dry-season. These could be the results of irrigation systems shortage, which caused Cambodia to had no ability to deal with such frequently-occurred disasters. What if Cambodia could build irrigation and water storage systems in order to store an over-needed water resources during the wet-season keeping for utilization in agriculture during the dry-season?
4. Results and discussion
4.1. SFA model estimation
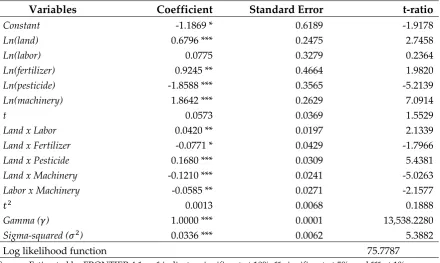
Table 3. lists the parameters estimation results by implementing the maximum likelihood estimation method in FRONTIER (version 4.1c) econometrics software of Coelli [30]. The variance ratio parameter of gamma (γ) had a value of 1.00 and significant at 1%, shows that the variation of the composite error term was mainly from the technical efficiency ( ) almost 100%, and the variation of random error (v) less than 1%, indicated the efficiency source of Cambodian rice production within the study period came mainly from the production’s technical efficiency.
Table 3. Parameter estimates of SFA model
Variables Coefficient Standard Error t-ratio
Constant -1.1869 * 0.6189 -1.9178
Ln(land) 0.6796 *** 0.2475 2.7458
Ln(labor) 0.0775 0.3279 0.2364
Ln(fertilizer) 0.9245 ** 0.4664 1.9820
Ln(pesticide) -1.8588 *** 0.3565 -5.2139
Ln(machinery) 1.8642 *** 0.2629 7.0914
t 0.0573 0.0369 1.5529
Land x Labor 0.0420 ** 0.0197 2.1339
Land x Fertilizer -0.0771 * 0.0429 -1.7966
Land x Pesticide 0.1680 *** 0.0309 5.4381
Land x Machinery -0.1210 *** 0.0241 -5.0263
Labor x Machinery -0.0585 ** 0.0271 -2.1577
0.0013 0.0068 0.1888
Gamma ( ) 1.0000 *** 0.0001 13,538.2280
Sigma-squared ( ) 0.0336 *** 0.0062 5.3882
Log likelihood function 75.7787
Source: Estimated by FRONTIER 4.1c. * indicates significant at 10%, ** significant at 5%, and *** at 1%.
families in the province for the production of rice was also positively related but significant at 5%. These results indicated that enlarging in total actual harvested land, more capital investment in agricultural machineries and technically improvement of fertilizers application by smallholder rice producers (farmers) could cause the result in increasing output (quantity) of rice within the province. Moreover, with the estimated coefficient of 1.86, capital investment in agricultural machineries was the main input factor driven more output for Cambodia’s provincial rice production compared to land and fertilizer input factor during the study period. This means that the provinces with higher capital investment (in agricultural machineries) tended to produce higher level of rice output than the provinces with lower capital investment.
Total actual harvested land was the second core input factor for increasing output of rice. The provinces which cultivate more additional lands of rice have the ability to maintain reasonable levels of other necessary inputs in order to cause the rice output to increase faster than the provinces with low rate of rice cultivated land. This result confirmed the results of several previous studies, such as Yu and Diao [5], Smith and Hornbuckle [37] and some studies of Asian Development Bank [2, 38]. Furthermore, total families using quantity of poison for insects and grass (included both chemical and organic poison) existing in the province, i.e. pesticides input factor, was negatively related to rice output and significant at 1%, indicated that provinces with more amount of poison (pesticides) application tended to produced lower rice output than the provinces with smaller amount of poison application. This could be the result of inefficiency used of poison in rice production by farmers. Be noted that most of smallholder rice producers are the farmers with low education. Furthermore, the instruction of product usage for most imported agricultural poison products have not been totally translated into Khmer language yet before imported (to Cambodia), which might cause numerous misunderstanding and leaded to incorrected technical used as well as inefficiency used in field practices by farmers. However, the study established that there was no significant relationship between rice output and the labor force involved in rice production.
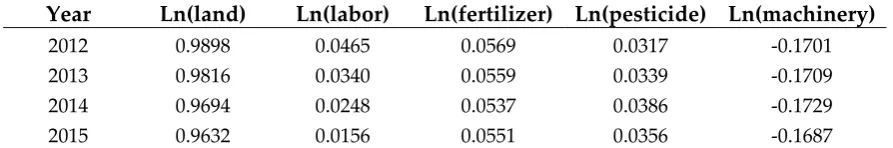
Table 4. Input elasticities of rice production in Cambodia, 2012-2015
Year Ln(land) Ln(labor) Ln(fertilizer) Ln(pesticide) Ln(machinery) 2012 0.9898 0.0465 0.0569 0.0317 -0.1701 2013 0.9816 0.0340 0.0559 0.0339 -0.1709 2014 0.9694 0.0248 0.0537 0.0386 -0.1729 2015 0.9632 0.0156 0.0551 0.0356 -0.1687 Source: Calculated by Ms. Excel 2016
Table 4. illustrates the input elasticities of rice production in Cambodia between 2012-2015. From this table, all input factors, except machinery, have had increasing return to scale to rice output, and elasticity of land input was the highest among all input factors, followed by fertilizer and labor input. Between the study period of 2012-2015, harvested land elasticity was 0.976 in average, indicated that 1 hectare increasing in harvested land could cause rice output to increase by 0.976 tons, while the other input factors just had minor of elasticity value (less than 0.10).
4.2. Technical efficiency analysis
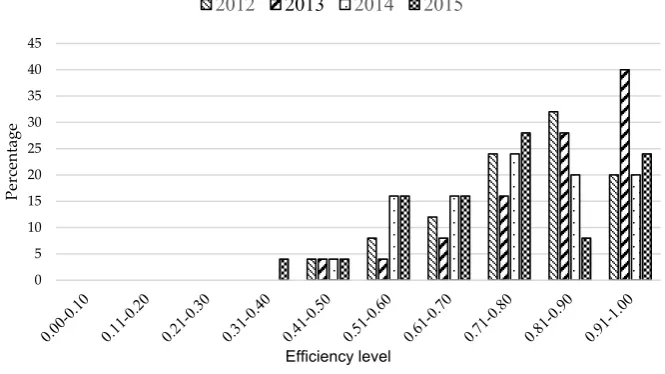
Figure 2. Technical efficiency distribution of rice production in Cambodia, 2012-2015
Figure 2. illustrates distribution of Cambodian rice production’s TE from 2012 to 2015. Rice production in Cambodia performed very well during 2013, which 40% of provinces had technical efficiency score between 0.91-1.00, and another 28% had technical efficiency score between 0.81-0.90. Thus, in 2013 nearly 70% of provinces produce more than 80% of rice at best practice at the current level of their production inputs and technology. However, natural disasters in 2014 and 2015 caused the decreased in technical efficiency score in most Cambodian provinces.
Table 5. Regional technical efficiency of rice production in Cambodia, 2012-2015
Regions 2012 2013 2014 2015 TE Change (%)
M S.E. M S.E. M S.E. M S.E. 12-13 12-14 12-15
Phnom Penh 0.83 0.00 0.84 0.00 0.81 0.00 0.61 0.00 1.2 -3.4 -26.5
Tonle Sap plain18 0.81 0.05 0.87 0.04 0.71 0.05 0.77 0.04 6.8 -12.4 -5.4
Mekong plain19 0.86 0.07 0.89 0.10 0.88 0.07 0.88 0.07 3.2 2.6 2.2
Mekong plateau20 0.79 0.04 0.79 0.04 0.74 0.06 0.70 0.06 0.0 -6.7 -11.3
Mountain21 0.66 0.09 0.76 0.08 0.63 0.09 0.53 0.09 14.6 -5.7 -19.7
Coastal22 0.81 0.07 0.84 0.06 0.86 0.09 0.79 0.08 4.7 6.3 -2.0
Cambodia 0.80 0.03 0.84 0.03 0.76 0.03 0.74 0.03 5.4 -3.9 -6.9
Source: Estimated by FRONTIER 4.1c; “M” = Mean; “S.E.” = Standard Error; “12-13” = TE change between 2012 and 2013; “12-14” = TE change between 2012 and 2014; “12-15” = TE change between 2012 and 2015
Table 5. shows the rice production TE in different regions of Cambodia from 2012 to 2015. The results revealed that in the study period, Mekong plain which is the second-largest rice production region of Cambodia had highest TE score in almost all years from 2012 (0.860) to 2015 (0.878) among all regions, and the only one region have had increasing TE score during the study period 2012-2015 (by 2.2%). In 2015, all provinces in this region, except Svay Rieng province, had rice production TE
18 Tonle Sap plain region included the province of Banteay Meanchey, Battambang, Kampong Chhnang, Kampong Thom, Pailin, Pursat,
and Siem Reap. Total area: 61,510km² (accounted for 34.54% of the total area)
19 Mekong plain included the province of Kampong Speu, Kandal, Prey Veng, Svay Rieng, and Takéo. Total area:21,997 km² (12.35%)
20 Mekong plateau included the province of Kampong Cham, Kratié, Stung Treng, and Tbong Khmoum. Total area: 31,663 km² (17.78%)
21 Mountain region included the province of Mondulkiri, Ratanakiri, Preh Vihear, and Oddar Meanchey. Total area: 45,016 km² (25.28%)
22 Coastal region included the province of Kampot, Koh Kong, Kep, and Preah Sihanouk. Total area: 17,237 km² (9.68%) 0
5 10 15 20 25 30 35 40 45
Per
centa
ge
Efficiency level
more than 91%. Takeo province was the most effective province in this region with the highest TE score of 0.999, while Svay Rieng province’s TE score in 2015 was just 0.599. However, Tonle Sap plain which is the largest rice production region of Cambodia in production area had TE score of 0.814 in 2012, but decreased by 5.4% to 0.770 in 2015 as the results of natural disasters at the end of 2014 (flooded) and in 2015 (drought) that affected most provinces in this regions. The province with highest TE score in this region in 2015 was Kampong Chhnang province (0.914), while Banteay Meanchey was the province that had lowest TE score within the region.
4.3. Technical inefficiency model and affecting factors
Table 6. presents the parameters of the rice production’s technical inefficiency model estimated by FRONTIER version 4.1c. In the model specification, it is obvious that irrigation and production technique both had negative coefficient signs and significant at 1%, while agricultural supporting staffs had also negative coefficient signs but significant at 5%, indicated positively related of these three factors to TE of rice production in Cambodia. These results revealed that development of irrigation systems and good water management practices, development of rice production technique to the rural farmers, and increasing the number of agricultural supporting staffs in the provincial territory are the three core factors to cause rice production TE to increase. With the highest coefficient of 0.95 and 0.08, the factor of agricultural supporting staffs and production technique played as the first and second core affecting factors respectively. Provinces with more agricultural supporting staffs existing and higher rate of families using SRI tended to have higher TE score than provinces with less amount to supporting staffs and lower rate of families using SRI, which indicated the important of technical supporting services from agricultural staffs (both government officers and NGOs staffs) and new production techniques implementation in rice production. These coefficient values (0.95 and 0.08 for agricultural supporting staffs and production technique respectively) indicated that 1% increasing of the percentage of agricultural supporting staffs (to total farmers cultivating rice) within the provincial territory and the percentage of families cultivating rice under the SRI system to total rice cultivated families, could cause the increasing of rice production TE by 0.95% and 0.08% respectively.
Table 6. Rice production technical inefficiency model parameters estimation
Variables Coefficient Std. Error t-ratio
Constant 0.9241 *** 0.1484 6.2261
Disaster 0.0003 0.0005 0.5641
Irrigation -0.0119 *** 0.0026 -4.5368
Production technique -0.0841 *** 0.0283 -2.9688
Distant to information sources -0.0052 0.0060 -0.8703
Agricultural supporting staffs -0.9530 ** 0.4032 -2.3635
Dry-season production -0.0016 0.0016 -1.0549
Small-land farmers -0.0007 0.0036 -0.2056
Source: Estimated by FRONTIER 4.1c. * indicates significant at 10%, ** significant at 5%, and *** at 1%.
Rice production in Cambodia still seems to be vulnerable to natural disasters, such as floods and droughts. As being discussed previously, irrigation systems and good water management practices was not only the core factors for improving rice production in Cambodia, but also the main disaster prevention devices for protecting Cambodia from natural disasters. Although percentage of rice land area damaged by floods, drought, and insects was not significantly affect rice production TE during the study period, frequently-occurred natural disasters still indirectly affect the rice production due to lack of irrigation systems. For instance, disasters occurred in wet season of 2014 (flooded) and in 2015 (drought), had been destroyed thousand hectares of rice fields caused the result of decreasing in total rice actual harvested land which was the second core input factor for increasing rice output after capital investment in agricultural machineries. Although arverage rice yield and rice price still continued to increase between 2014-2015, frequently-occurred of natural disasters still leaded the production of rice to decrease gradually from 2014 to 2015. Irrigation systems, therefore, should be the core factor to be considered and bring into actions by RGC and the related agencies. Conversely, the study established that there was no significant relationship between the factors of distant from information sources, dry-season production, amount of small-land farmers and rice production TE. 5. Conclusions
The aim of this paper was to estimate the TE of rice production in Cambodian and determine its main influencing factors by using the SFA model. The present study utilized four-years dataset generated from the central government document “Profile on Economics and Social” of all 25 provinces between 2012-2015. The results indicated that the level of rice output in Cambodia varied according to the different level of capital investment in agricultural machineries, total rice actual harvested area, and technically fertilizers application within provinces. The mean TE of rice production is 0.784 which means that famers in this region produce 78.4% efficiently rice at best practice, at the current level of production inputs and technology. This means that rice output has the potential of being increased further by 21.6% at the same level of inputs if farmers had been technically efficient. However, during the study periods the TE of rice production recorded a 7% decreasing rate. Takeo province was the most effective province nationwide, while another 60% of provinces still had TE below the average mean efficiency in 2015.
India, US and Thailand. This revealed the lack of ability as well as local technical experts for Cambodia to be able to manufacture large heavy-scale agricultural machineries by itself. Financial institutions (microfinances and commercial banks) are the major sources of credit for making machinery purchases of farmers. Conversely, due of Cambodia haven’t had any agricultural bank to support credit scheme for buying farm machinery and equipment yet, hence, farmers have to use their own saving or borrow from existing financial institutions or dealers to buy new machines, where often provided relatively higher interest rate for loan (in average 24% per year) compared to its neighboring countries like Vietnam (less than 1% per year). Harvested area, on the other hand, had the highest elasticity among all input factors of rice production in Cambodia. It is clearly indicated that increasing in harvested area (i.e. land input) could cause the increasing of rice output in higher percentage than all other inputs. However, although the RGC had been trying to increase rice production by enlarging the total area of rice fields annually, this enlargement still remains far behind its enormous potential to increase rice productivity. Therefore, significant commitments and supported actions are required to address the problem.
Second, production techniques for rural farmers, technical skills and amount of agricultural supporting staffs are being as the most important influencing factors of rice production in Cambodia. Although SRI have been introduced since the prior of 2008, the percentage of farmers cultivating rice under this system still seemed to be low. Enlarging percentage of farmers cultivating rice under the SRI instead of traditional rice cultivating techniques by wider spread introducing of this system to rural farmers, altogether with the strengthening technical skills of agricultural supporting staffs, and building up stronger relationship between rural farmers and supporting staffs, as well as relationship between the related agencies, might be the great solution for this. Likewise, extra researches and developments in new production techniques of rice cultivation still always needed for improving rice productivity. Finally, agricultural sector as well as rice production in Cambodia always inevitably linked to development of irrigation systems and good water management practices. Nonetheless, several constraints in irrigation development still existing. Irrigation systems in Cambodia are still in development and not coverage for the whole country due to lack of supporting financial resources and technical experts. Moreover, most farmers’ paddy fields are small and lack of road access system for the paddy fields far from the road, and lack of drainage systems for paddy field and sometimes rainfall during harvesting still also remains as constrains. Development of irrigation systems and good water management practices, is therefore a relevant magnitude to be muscularly considered by policy-makers for developing strategical policies geared towards enhancing rice production.
Therefore, the main factors affecting the output level of rice production in Cambodia appear to be capital investment in agricultural machineries, actual harvested area, and fertilizers utilization while irrigation and good water management, production techniques, and technical supporting staffs serving as main factors affecting TE of rice production in Cambodia.
In conclusion, in addition to capital investment, and improving technical skills for both supporting staffs and rural farmers in order to improve rice productivity in Cambodia, the present study recommends the development of irrigation systems and good water management practices should be strongly considered and bring into more effective actions by the central government as well as related agencies for preventing frequently-occurred natural disasters and increasing actual harvested area, particularly in dry-season.
Author Contributions:
References
1. CDRI, Annual Development Review 2011-12. 2012, Cambodia Development Resource Institute (CDRI): Phnom Penh, Cambodia.
2. ADB, Improving rice production and commercialization in Cambodia. 2014, Asian Development Bank (ADB): Printed in the Philippines.
3. CIA. The World Factbook. 2014 June 23, 2014 [cited 2015 January 10]; Available from: https://www.cia.gov/library/publications/the-world-factbook/geos/cb.html.
4. World.Bank. GDP per capita, PPP (current international $). 2013 [cited 2015 January 10]; Available from: http://data.worldbank.org/indicator/NY.GDP.PCAP.PP.CD?order=wbapi_data_value_2013+wbapi_da ta_value+wbapi_data_value-last&sort=desc.
5. Yu, B. and X. Diao, Cambodia's Agricultural Strategy: Future Development Options for the Rice Sector. 2011, A policy discussion paper of Cambodia Development Resource Institute (CDRI): Phnom Penh, Cambodia.
6. Liu, M. and D. Li, An Analysis on Total Factor Productivity and Influencing Factors of soybean in China. Journal of Agricultural Science, 2010. 2(2): p. 158-163.
7. NIS. Cambodia General Population Census 2008. 2008 [cited 2015 January 10]; Available from: http://celade.cepal.org/redkhm/census/khm2008/.
8. NIS. Cambodia General Population Census 1998. 1998 [cited 2015 January 10]; Available from: http://celade.cepal.org/redkhm/census/khm1998/.
9. Nesbitt, H.J., Rice Production in Cambodia. 1997: Cambodia-IRRI-Australia Project.
10. Sawaneh, M., I.A. Latif, and A.M. Abdullah. Total Factor Productivity of Rice Farming in Selected Southest Asian Countries. in the International Conference on Social Science Research, ICSSR 2013. 2013. Penang, Malaysia.
11. FAO, FAO Statistical Yearbook 2010. 2010, Rome: Food and Agriculture Organization of the United Nations.
12. Fulginiti, L.E. and R.K. Perrin, Agricultural productivity in developing countries. Agricultural Economics, 1998. 19: p. 45-51.
13. Coelli, T.J., et al., An Introduction to Efficiency and Productivity Analysis (Second Edition). 2005: Springer. 14. Nin-Pratt, A., B. Yu, and S. Fan, The total factor productivity in China and India: new measures and
approaches. China Agricultural Economic Review, 2008. 1(1): p. 9-22.
15. Coelli, T.J., Recent Developments in Frontier Modeling and Efficiency Measurement. Australian Journal of Agricultural Economics, 1995. 39(3): p. 219-245.
16. Yang, W., et al., An Empirical Analysis on Regional Technical Efficiency of Chinese Steel Sector based on Network DEA Method. Procedia Computer Science, 2014. 31: p. 615-624.
17. Svitalkova, Z., Comparison and Evaluation of Bank Efficiency in Selected Countries in EU. Procedia Economics and Finance, 2014. 12: p. 644-653.
18. Detotto, C., M. Pulina, and J.G. Brida, Assessing the productivity of the Italian hospitality sector: a post-WDEA pooled-truncated and spatial analysis. Journal of Productivity Analysis, 2013. 42(2): p. 103-121. 19. Fu, P., Z. Zhan, and C. Wu, Efficiency Analysis of Chinese Road Systems with DEA and Order Relation
Analysis Method: Externality Concerned. Procedia - Social and Behavioral Sciences, 2013. 96: p. 1227-1238. 20. Cullmann, A. and C. von Hirschhausen, Efficiency analysis of East European electricity distribution in
transition: legacy of the past? Journal of Productivity Analysis, 2007. 29(2): p. 155-167.
21. Mayston, D.J., Analysing the effectiveness of public service producers with endogenous resourcing. Journal of Productivity Analysis, 2015. 44(1): p. 115-126.
22. Lin, B. and H. Long, A stochastic frontier analysis of energy efficiency of China's chemical industry. Journal of Cleaner Production, 2015. 87: p. 235-244.
23. Manlagñit, M.C.V., Basel regulations and banks’ efficiency: The case of the Philippines. Journal of Asian Economics, 2015. 39: p. 72-85.
24. Manlagñit, M.C.V., Cost efficiency, determinants, and risk preferences in banking: A case of stochastic frontier analysis in the Philippines. Journal of Asian Economics, 2011. 22(1): p. 23-35.
25. Zheng, S. and H. Bloch, Australia’s mining productivity decline: implications for MFP measurement. Journal of Productivity Analysis, 2013. 41(2): p. 201-212.
26. Ondrej, M. and H. Jiri, Total Factor Productivity Approach in Competitive and Regulated World. Procedia - Social and Behavioral Sciences, 2012. 57: p. 223-230.
27. Yao, S. and H. Li, Agricultural productivity changes induced by the sloping land conversion program: an analysis of Wuqi county in the Loess Plateau region. Environ Manage, 2010. 45(3): p. 541-50.
29. Meeusen, W. and J. Van den Broeck, Efficiency Estimation from Cobb-Douglas Production Functions with Composed Error. International Economic Review, 1977. 18(2): p. 435-444.
30. Coelli, T.J., A Guide to FRONTIER Version 4.1: A Computer Program for Stochastic Frontier Production and Cost Function Estimation, ed. N. 7/96. 1996, Armidale, NSW 2351, Australia.: University of New England. 31. Coelli, T., Estimators and hypothesis tests for a stochastic frontier function: A Monte Carlo analysis. The
Journal of Productivity Analysis, 1995. 6(3): p. 247-268.
32. RGC, Profile on Economics and Social in Year 2015, Based on Commune Databaes (CDB), December Year 2014 (Khmer language), in Provincial Profile on Economics and Social. 2015, The Royal Government of Cambodia (RGC), Ministry of Planning (MoP), Provincial Department of Planning (PDP): Cambodia.
33. RGC, Profile on Economics and Social in Year 2016, Based on Commune Databaes (CDB), December Year 2015 (Khmer language), in Provincial Profile on Economics and Social. 2016, The Royal Government of Cambodia (RGC), Ministry of Planning (MoP), Provincial Department of Planning (PDP): Cambodia.
34. Baldwin, K., et al., Southeast Asia's Rice Surplus. 2012, United States Department of Agriculture (USDA), Economic Research Service.
35. Wikipedia. Green Revolution. 2016 September 06, 2016 [cited 2016 September 08]; Available from: https://en.wikipedia.org/wiki/Green_Revolution.
36. CEDAC, Report on the Progress of System of Rice Intensification in Cambodia 2007. 2008, Cambodian Center for Study and Development in Agriculture (Centre d'Etude et de Dévelopment Agricole Cambodgien): Phnom Penh, Cambodia.
37. Smith, D. and J. Hornbuckle, A Review of rice productivity in Cambodia and water measurement using direct and indirect methods on a dry season rice crop. 2013, Technical Report to ACIAR, Canberra, CSIRO Sustainable Agriculture Flagship, Australia.
38. ADB, The Rice Situation in Cambodia. 2012, Technical Assistance Consultant‘s Report of Asian Development Bank (ADB).
39. Chan, S., Agricultural Mechanization in Cambodia: Challenges and opportunities, in Regional Forum on Sustainable Agricultural Mechanization in Asia and the Pacific. 2013, Ministry of Agriculture, Forestry and Fisheries (MAFF): Phnom Penh, Cambodia.
40. Chan, S. Agricultural Mechanization in Cambodia. in The 2nd Regional Forum on Sustainable Agricultural Machanization - Enabling Environment for Custom Hiring of Agricultural Machinery. 2014. Serpong, Indonesia.