doi: 10.11648/j.wjap.20190402.11
ISSN: 2637-5990 (Print); ISSN: 2637-6008 (Online)
The Study of the Parameters that Affect the Performance of
Suspension in HDD
Joompon Bamrungwong
Department of Industrial Physics and Medical Instrumentation, Faculty of Applied Science, King Mongkut’s University of Technology North Bangkok, Bangkok, Thailand
Email address:
To cite this article:
Joompon Bamrungwong. The Study of the Parameters that Affect the Performance of Suspension in HDD. World Journal of Applied Physics. Vol. 4, No. 2, 2019, pp. 17-23. doi: 10.11648/j.wjap.20190402.11
Received: June 10, 2019; Accepted: July 10, 2019; Published: July 26, 2019
Abstract:
The suspension in a hard disk drive is a component of hard disk drives (HDD(s)) that commonly consist of three main components; Baseplate, Loadbeam and Gimbal, which are welded together. The suspension is attached to a slider fly on the surface of a rapidly spinning disk. The suspension assembly and slider that is formed is called a Head Gimbal Assembly (HGA). If that assembly is not attached to the slider, that is called a Trace Gimbal Assembly (TSA). Defects in the suspension may occur from machining and assembly. The aim of this research is to study the effect of suspension defects on the performance of the suspension resonance using a finite element method, whereby the suspension was created by SolidWorks and imported into Ansys in order to conduct resonance analysis. The results from finite element analysis compared with laser doppler velocimetry (LDV) found that the trend is the same. The suspension bias was revealed, in that Delta RG, welding diameter, program asymmetry, program asymmetry, tip height and tip twist influence the performance of the suspension may possibly come from the suspension production process. Obviously, this process needs to be controlled with regard to certain aspects, such as laser power, fixtures and so on. However, the swaging process in the head stack assembly might also have an impact tin tip height and tip twist.Keywords:
Suspension, Resonance, Hard Disk Drive, HGA1. Introduction
A suspension assembly commonly consists of three main components that are welded to each other; these are: Baseplate, Loadbeam and Gimbal, as shown in Figure 1 [1]. The suspension in a hard disk drive is a component attached
to the slider that flies over the surface of a rapidly spinning disk. The primary role of the suspension assembly is to apply constant vertical force and position the read/write head above the rapidly spinning disks inserted into hard disk drives, thus helping to maintain a consistent "flying height".
The slider flying over the disk can be compared to a 747 flying at approx. 6.4 million kilometers per hour, 1.5 mm above the surface of the earth, counting grass 5 mm apart. At this speed, it takes 20.5 sec to circle the earth at the equator. An actual distance between the slider and the media is around 0.9 nm, thus, if the suspension is deformed or some parts are defected, it might have an influence on the read/write data and performance of the head gimbal assembly due to the signal from recording the head at around 0.3 mV. The performance of the suspension can be separated in terms of statics and dynamics; at statics counts on the gramload, the spring rate needs to be optimized with the requirement of the specification designer; at dynamics counts on the resonance via bode plot [2]. This study does not include the gimbal tail for connecting the TGA (Trace Gimbal Assembly), tail to PCCA (Printed Circuit Cable Assembly) that currently uses lap-bonding soldering with a hot bar in the reflow process.
2. Materials and Methods
This study used SolidWorks for creating the suspension part as 3D model. The model was created by sheet metal commands due to the fact that the part was unable to be bent. After it was assembled in the assembly module, a 3D model was created with solid command. The assembly 3D model from SolidWorks was imported into Ansys Workbench and the component names were defined for analysis. Initially, the 3D model cut the gimbal tail that did not have any impact to the obtained result. In the finite element software, the statics analysis was done first for optimization the suspension at z-ht 0.76 mm, gramload 2.5 grams, bend location angle of 13.0 degrees, and bend location 0.008 mm from base plate edge, all as shown in Figure 2. In statics analysis, the geometry nonlinear large defection was not used because the results were not different when compared with the large defection and linear statics analysis. The mesh size around bend area was made finer to capture the spring behavior, as shown in Figure 3.
Figure2. Suspension specification at statics analysis.
The linear material properties for the finite element analysis is shown in the Table 1.
Table 1. Linear material properties.
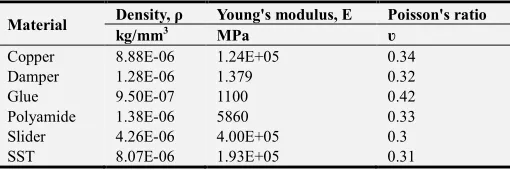
Material Density, ρ Young's modulus, E Poisson's ratio
kg/mm3 MPa ʋ
Copper 8.88E-06 1.24E+05 0.34
Damper 1.28E-06 1.379 0.32
Glue 9.50E-07 1100 0.42
Polyamide 1.38E-06 5860 0.33
Slider 4.26E-06 4.00E+05 0.3
SST 8.07E-06 1.93E+05 0.31
Dynamic structural analysis was used to determine the behavior of structures subjected to loads which varied with time and this also included the study of free vibrations. In this investigation, modal analysis was used to determine suspension vibration characteristics (frequencies and mode shapes); after that, harmonic analysis was used to determine the suspension response to harmonic loads.
Figure3. Finite element model with fine mesh on software.
In consideration of Figure 4, the spring mass damper system governing equation for the dynamic analysis is
) ( ) (u u F t K
u C u
Mɺɺ+ ɺ+ = (1)
Where
M is structural mass matrix C is structural damping matrix K is structural stiffness matrix F is load vector
uɺ
ɺ is nodal acceleration vector uɺ is nodal velocity vector
u is nodal displacement vector t is time
Figure4. Spring mass damper system.
(
i i)
i t
u=φ sinω +θ (2)
(
i i)
i
i t
uɺ=−
ω
2φ
sinω
+θ
ɺ (3)
Substituting uand uɺɺin the governing equation gives an eigenvalue equation
(
K−ω
i2M)
φ
i =0 (4) Equation (4) is satisfied if φi =0 or det(
K−ω
2M)
=0This is an eigenvalue problem which may be solved for up to n roots of ω
(
ω
12,ω
22,...,ω
n2)
where the roots are the eigenvalues of the equation called natural frequency. As for each root, there is a corresponding eigenvector(
φ1,φ2,...,φn)
called mode shape. As for harmonic of a linear structure spring mass damper, the governing equation can be written in the equation (1). Assume F and u are harmonic withfrequency Ω. It can be written in the form
(
i)
i te e F
F = max ψ Ω (5)
(
i)
i te e u
u= max ψ Ω (6) Take two time derivatives
(
)
i te iu u
u= 1+ 2 Ω (7)
(
)
i te iu u i
uɺ= Ω 1+ 2 Ω (8)
(
)
i te iu u
uɺɺ=−Ω2 1+ 2 Ω (9) Equation (7) to (9) substitute in equation (1) and simplify
(
)
(
1 2) (
1 2)
2 iF F iu u K C i
M+ Ω + + = +
Ω
− (10)
Equation (10) can be in the form
c c cu F
K = (11)
The parameters are of interest to study following: Baseplate were Tip height and Tip twist; Spring Variation was Pregram bend asymmetry; and Loadbeam were Loadbeam twist, Loadbeam rail angle, Delta RG, and welds diameter. All parameters degrade the suspension that is caused by machining and assembly process. In the study, the model is biased due to the statics analysis and then the model was imported continually to study in in terms of dynamics analysis and harmonic analysis.
3. Results
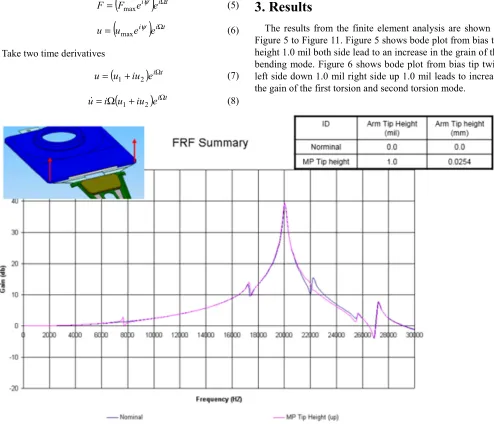
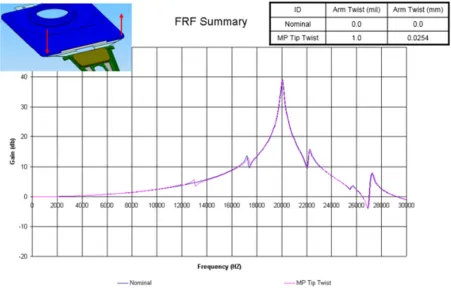
The results from the finite element analysis are shown in Figure 5 to Figure 11. Figure 5 shows bode plot from bias tip height 1.0 mil both side lead to an increase in the grain of the bending mode. Figure 6 shows bode plot from bias tip twist left side down 1.0 mil right side up 1.0 mil leads to increase the gain of the first torsion and second torsion mode.
Figure 6. Frequency response function for Tip twist.
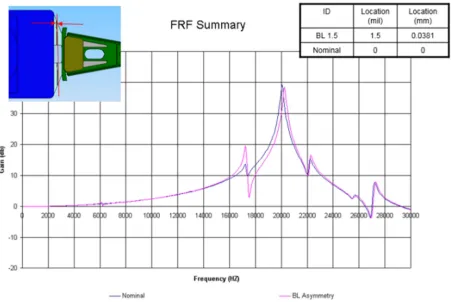
Figure 7 shows the bode plot of delta RG (Radius Geometry) program which found a high variation in all mode shapes. Figure 8 shows the bode plot of bias asymmetry program leads to increase in the gain of torsion mode shape.
Figure 9 show the result of Loadbeam twist left side up 1.0 mil right side down 1.0 mil found that there was a high variation in all mode shapes with frequency shift and equivalent to bias delta RG.
Figure 8. Frequency response function for program asymmetry.
Figure 9. Frequency response function for Loadbeam twist.
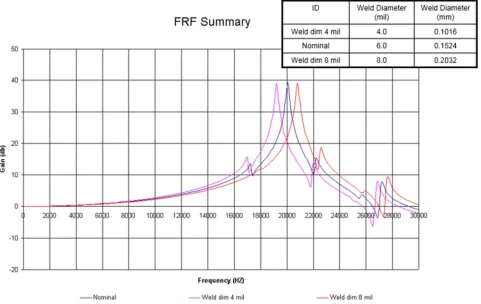
Figure 10. Frequency response function for weld diameter.
4. Conclusion and Discussion
The suspension was optimized with statics analysis prior to dynamic analysis and then the characteristics and performance of the suspension were studied by creating a 3D model and bias of the 3D finite element model using finite element method. The new design of the suspension still uses a basic suspension and the same simulation techniques. Therefore, the data from this study are able to be applied with the new design. The only value of mean and sigma which may be different depending on the weight of the component of the slider, such as laser on slider or microwave on slider, and increasing the size of the Loadbeam in this case may be required. Figures 7, 9 and 10 illustrate the bode plots of low performance. From the analysis of the results, it is found that the suspension production process needs to control Delta RG, and Welding diameter by controlling the power of laser welding. The Loadbeam should be perfect in terms of flatness without twist and this may possibly lead to media damage due to increasing the grain of the bending mode and torsion mode. However, the diameter of welding leads to the frequency shifting, although this may not cause severe damage. Figure 6 shows the grain of the bending mode that has been increased slightly due to the tip of the suspension being imperfect; this is possibly caused by using the tweezer on the suspension of the operator and this might have occurred after swaging process. Figure 8 illustrates the bode plot a low quality by torsion mode of the suspension due to program asymmetry; this issue might need to undergo maintenance with the forming tool as it needs to lay down the suspension in the correct position. Nevertheless, following the swaging process, this might be a key performance of the head stack assembly (HSA); although that is not a concern in this study, it is recommended to control the suspension tip twist and tip height after swaging process. Figure 11 shows that an increase in the rail angle or a decrease in the rail angle does not have an impact on the performance of the suspension so that new magnetic recording, like HAMR or MAMR that need to modify the Loadbeam, do not have an impact on the resonance performance. In future work, there needs to be a definition of the mean and control of the sigma via transfer function of the process used to make the suspension by Monte Carlo simulation.
Acknowledgements
I would like to thank the Department of Industrial Physics and Medical Instrumentation, Faculty of Applied Science, King Mongkut’s University of Technology North Bangkok for supporting every aspect of this research.
References
[1] Kazemi M. R. (2013) Suspension Assembly for Hard Disk Drive. In: Wang Q. J., Chung YW. (eds) Encyclopedia of Tribology. Springer, Boston, MA.
[2] B. Joompondej, N. Sarun, T. Suwut “Design the component of the suspension in HDD”, International Journal of Applied Computer Technology and Information Systems, Vol 1. [3] Reflow International. Solder Reflow Technology Handbook.
Take June, 09, 2013, from
http://www.conceptronic.com/products/solder-reflow-technology-handbook/
[4] B. Joompondej, W. Pattaraweerin, “Development of the hot bar for reflow process in presented at Joint Conference on Applied Computer Technology and Information Systems (ACTIS & NCOBA), Nakhon Phanom, Thailand, Jan. 30-31, 2015.
[5] Raymond A. Serway and John W. Jewett, Jr. “Physics for Scientists and Engineers with Modern Physics” 9th ed, Cengage Learning, 2014.
[6] Benson H. Tongue, “Principles of Vibration” 1st ed, Oxford University Press, 1996.
[7] Daryl L. Logan, “A First Course in the Finite Element Method” 4th ed, Cengage Learning, 2007.
[8] Robert D. Cook, “Finite Element Modeling for Stress Analysis” John Wiley and Son Inc., 1995.
[9] B. Joompondej, M. Mongkolwongrojn, “Improvement of Boss Tower for Single Ball Swaging in Hard Disk Drive”, International Journal of Scientific and Research Publications, Volume 2, Issue 11, November 2012.
[10] Bathe, “Finite Element Procedure”, Prentice Hall of India Private Limited, 2007.
[11] WAKATSUKI, Kousaku & TAKAHASHI, Haruhide & NAKAMURA, Shigeo & SAEGUSA, Shozo. (2003). Flow induced vibration of head gimbal assembly. The proceedings of the JSME annual meeting. 2003. 5. 259-260. 10.1299/jsmemecjo.2003.5.0_259.
[12] Arjan P. TEERHUIS, Sandra J. M. COOLS, and Raymond A. DE CALLAFON,” Reduction of Flow Induced Suspension Vibrations in a Hard Disk Drive by Dual-Stage Suspension Control”, IEEE Transactions on magnetics.
[13] Eric M. Jayson, Paul W. Smith, and Frank E. Talke, 2003. “Shock Modeling of the Head–Media Interface in an Operational Hard Disk Drive,” IEEE Trans Magn., vol. 39, NO. 5, pp. 2429–2432, Sep.
[14] Tawin Phonpai and Thira Jearsiripongkul, “FEA Simulation of Head Gimbals Assembly” DST-CON 2008.
[15] M. Rotunno, R. Oboe, R. A. de Callafon, "Modeling product variations in hard disk drive micro-actuator suspensions", Microsystem Technologies, vol. 12, pp. 803, 2006.