www.nonlin-processes-geophys.net/16/313/2009/ © Author(s) 2009. This work is distributed under the Creative Commons Attribution 3.0 License.
Nonlinear Processes
in Geophysics
How much does inclusion of non-linearity and multi-point pattern
recognition improve the spatial mapping of complex patterns of
groundwater contamination?
M. Chowdhury1, A. Alouani1, and F. Hossain2
1Department of Electrical and Computer Engineering, Tennessee Technological University, Cookeville, TN 38505-0001, USA 2Department of Civil and Environmental Engineering, Tennessee Technological University, Cookeville, TN 38505-0001, USA Received: 14 September 2008 – Revised: 2 April 2009 – Accepted: 2 April 2009 – Published: 15 April 2009
Abstract. In this brief communication, we discuss the impli-cation of the hypothesis that “non-linearity and multi-point pattern recognition can improve the spatial mapping of com-plex patterns of groundwater contamination”. The discus-sion is based on our recently published work in Stochastic Environmental Research and Risk Assessment. Therein we have found that the use of a highly non-linear pattern learning technique in the form of an artificial neural network (ANN) can yield significantly superior results under the same set of constraints when compared to the more linear two-point or-dinary kriging method.
1 Introduction
In the history of spatial mapping (or spatial interpolation), the technique with the longest heritage and widespread fa-miliarity among practitioners today is perhaps the “kriging” method (Matheron, 1971). Generally speaking, kriging can be considered as a class of methods used to interpolate the value of the random field at a non-sampled location using a weighting scheme applied to sampled values in the neigh-borhood. While the weighting scheme may be a combination of linear (i.e., ordinary kriging) or a non-linear (i.e. disjunc-tive kriging; Chiles and Delfiner, 1999) functions, all kriging methods assign weights according to a two-point spatial sta-tistical characterization called the “variogram” (Deutsch and Journel, 1998). Theoretically, the variogram is a variance functionγ (h)describing the spatial dependence of the ran-dom field separated by a distance lag ofh.
This two-point approach of the variography analysis com-bined with the linear combination of weights (for ordinary kriging) used in kriging methods often fails to recognize the
Correspondence to: F. Hossain ([email protected])
underlying spatial patterns manifested by the complex inter-actions between geology and fluid flow dynamics (Srinivasan and Caers, 2001). In these geostatistical methods, the spatial characteristics of the “random” function (contaminant con-centration) are described at most by the second order mo-ment (covariance). Hence, most kriging approaches are op-timum for representing multi-Gaussian random fields (per-haps with the exception of indicator kriging; Deutsch and Journel, 1998). In the presence of complex subsurface het-erogeneities and given the non-linearity of the contaminant transport process, it is highly unlikely that the contaminant distribution will exhibit a multi-Gaussian characteristic (Fay-bishenko, 2004).
For the case of groundwater contamination in resource-limited settings, a high level of uncertainty can hamper cost-effective management and remediation efforts. As an ex-ample, suppose the unbiased uncertainty (i.e., standard de-viation) of ordinary kriging (comprising only random error) for a contaminant variable is observed to be higher than the specified safe limit prescribed by the United States Environ-mental Protection Agency (USEPA). It is likely that many unsampled regions could be predicted as completely safe by kriging and hence, safe for public consumption. Sustainable water resources management in resource-poor settings (such as developing countries) therefore requires us to explore al-ternative approaches that seek to minimize these well-known limitations of linear and two-point geostatistical techniques.
In this brief communication, we discuss the implication of the hypothesis that “non-linearity and multi-point pattern recognition can improve the spatial mapping of complex pat-terns of groundwater contamination significantly”. Our dis-cussion is cast in perspective of a recently published work in Stochastic Environmental Research and Risk Assessment where the hypothesis was found to be valid. Herein, spa-tial mapping refers exclusively to the data-driven technique of spatial interpolation based on sampling data at finite loca-tions. Our purpose behind the discussion is to communicate
1 2 3 4 5 6 7
Figure 1. Mean arsenic concentration shown on a district basis in Bangladesh. Note that most district’s mean arsenic concentration in groundwater exceed the EPA safe limit of 10 µg/l. This map was reproduced from Rahman and Hossain (2008), “A Forensic Look at Groundwater Arsenic Contamination in Bangladesh”in Environmental Forensics, vol. 8(1). The numbers shown in each district are the number of wells that have been sampled in that district.
1
Fig. 1. Mean arsenic concentration shown on a district basis in
Bangladesh. Note that most district’s mean arsenic concentration in groundwater exceed the EPA safe limit of 10µg/l. This map was reproduced from Rahman and Hossain (2008), “A Forensic Look at Groundwater Arsenic Contamination in Bangladesh” in Environ-mental Forensics, vol. 8(1). The numbers shown in each district are the number of wells that have been sampled in that district.
to the public health community the impact of using a con-trasting (and non-linear) technique for water resources man-agement, one that is conceptually different from the gen-eral kriging approaches based on two-point statistics and lin-earity. Herein, we selected the assumption-free and non-linear multi-point pattern recognition (or “learning”) tech-nique based on artificial neural networks (ANN).
Using the well known example of extensive groundwater contamination by arsenic in Bangladesh, we demonstrated that the use of a highly non-linear pattern learning technique simultaneously trained on multi-point data in the ANN can yield significantly superior results under the same set of con-straints when compared to the ordinary kriging method (see Chowdhury et al. 2009). For the kriging method, we selected the simplest and most popular method of ordinary kriging to articulate our point on the impact of non-linearity and
multi-point pattern recognition (both of which are completely ab-sent in ordinary kriging). Later in the paper, we also discuss possible implications of using a more sophisticated variant of kriging such as disjunctive kriging or indicator kriging.
2 Arsenic contamination of groundwater in Bangladesh
Estimates show that about 103 million (70% of the Bangladesh rural population) depend on shallow wells that have been excavated at a depth of less than 150 m (Nahar et al., 2008), and more than half of the Bangladesh popula-tion may be at risk due to the high levels of arsenic in these groundwaters (Yu et al., 2003; see Fig. 1). Based on cur-rent literature, it seems that the actual causes of high arsenic concentration in the groundwater of Bangladesh have not yet been clearly pinpointed. Among the few hypotheses initially proposed to explain the possible mechanism of arsenic re-lease, the scientific community appears to have converged on two versions: i) Pyrite Oxidation Hypothesis (Kinniburg and Smedley, 2001) – oxidation of arsenic mineral “Arsenopy-rite” (FeAsS) or arsenic rich “Pyrite,” resulting in release of arsenic in groundwater and ii) Oxy-Hydroxide Reduction Hy-pothesis (Nickson et al., 1998) – reduction of arsenic rich iron-oxi-hydroxides leaching the arsenic that remain at ad-sorbed state on its surface. The prevailing lack of a unified theory behind the mobilization of arsenic in groundwater ap-pears to be delaying the achievement of a long-term struc-tural solution for policy planners in Bangladesh. Hence, spa-tial mapping of the field of arsenic contamination on the ba-sis of sparse in situ data is a prime candidate for promoting sustainable water resources management as an interim mea-sure. Because each one of the vast number of drinking wells (exceeding 10 million for Bangladesh) cannot be frequently and directly tested, a spatial mapping scheme based on lim-ited field measurements can bridge the gap between lack of adequate testing resources and the urgency of quarantining unsafe zones or identifying regions of the aquifer unaffected by contamination.
3 Artificial neural network versus ordinary kriging
modeling) and the training of the ANN scheme used the same data (i.e., spatial coordinates of the wells and the corre-sponding arsenic concentration). As part of pre-processing, data were grouped in 5×5 km2grids and then converted to a class-based numeric value for management (Fig. 2). Four classes were used as follows. Class One (Safe; colored blue): 0.0–5 ppb; Class Two (Possible Concern; colored cyan): 5– 10 ppb; Class Three (Unsafe-USEPA limit; colored orange): 10–50 pbb and Class Four (Unsafe-Bangladesh limit; colored red): >50 ppb (note: one ppb is equivalent to one µg/l). This preprocessing was performed for defining the classes of arsenic contamination for use as input in kriging or ANN model.
For the ANN, a 2 hidden layer (two input nodes for spa-tial coordinates) network was set up that was trained us-ing the back propagation algorithm (Govindaraju and Rao, 2000). For kriging, empirical variograms were modeled us-ing the exponential variogram function. Each mappus-ing tech-nique (ANN and kriging) was compared for two specific con-figurations. In the first configuration, it was assumed that one model was representative of the whole study region (i.e, for kriging this implied one variogram for the whole region of Bangladesh in Fig. 1). In the second configuration, the study region was divided into four quadrants in a manner that closely matched the administrative boundaries of divisions (i.e. a group of districts make up a division in Bangladesh in Fig. 2). The idea behind the first configuration was to iden-tify the technique that had better capabilities for generaliza-tion of pattern. The second configurageneraliza-tion was implemented to test each technique’s capability in deciphering the finer-scale features of the contamination pattern under a limited data scenario. Noise removal took place via preprocessing using the same filter for both techniques. Training and cal-ibration was performed on 50% of randomly selected wells in each region. Validation was performed on the remaining 50% of the wells (Fig. 2; Chowdhury et al., 2009).
Table 1 reproduces from Chowdhury et al. (2009) the com-parative performance of the ANN versus kriging for each configuration in terms of probability of successful detection (i.e, probability that the predicted class value matches with the in-situ class value), probability of false hope (probability that the predicted class value is underestimated significantly leading to an unsafe well being predicted wrongly as safe) and the probability of false alarm (probability that the pre-dicted class value is overestimated significantly leading to a safe well being predicted wrongly as unsafe).
ANN, by virtue of its ability to generalize the spatial pat-tern using a highly non-linear network, shows superior per-formance when compared to kriging. For the first configura-tion, the difference in performance between ANN and krig-ing (in terms of successful detection of wells) is around 17% (see Table 1, first row). However, this probability for suc-cessful detection magnifies considerably (by∼3 times) for the second configuration when the finer-scale features and limited data scenario are considered (see Table 1, bottom
1
Figure 2. Distribution of arsenic data in terms of the four management classes.
2
1
Fig. 2. Distribution of arsenic data in terms of the four management
classes.
four rows). More importantly, the probability of false hopes, which is a serious issue in public health monitoring, is signif-icantly lower for ANN (by around 50%) than that by kriging. Our findings reveal an interesting picture on the pitfalls of applying the kriging method for small-scale applications. When the whole study region is considered with adequate sampling data for calibration of models, kriging appears a reasonably comparable approximator of the contamination pattern with respect to the ANN. This may be attributed to an accurate generalization of the empirical variogram represen-tative of the whole study region. On the other hand, when a smaller region is considered with considerably lesser amount of sampling data for calibration of the models, kriging fails to capture the finer-scale features of contamination and yields significantly higher prediction error. This is possibly due to a grossly inaccurate variogram model which is known to be sensitive to the amount of sampling data and correla-tion structure. In both cases, the ANN technique manages to demonstrate superior performance and adapt accordingly to each situation without being influenced too negatively by the lack of adequate data for calibration. Clearly therefore, this superiority is a manifestation of the inclusion of non-linearity and multi-point pattern recognition in the ANN technique.
4 What should be the future of spatial mapping in resource-poor settings?
The use of ANNs or ANN-type tools for spatial mapping is not new (see for example Besaw and Rizzo, 2007). However,
Table 1. Comparative performance of ANN versus ordinary kriging for spatial mapping of arsenic concentration in Bangladesh (taken from
Chowdhury et al. (2009) in Stochastic Environmental Research and Risk Assessment). The correlation coefficient is between estimated and observed values of contamination.
Probability of Probability of Probability of Correlation
Successful False Hope False Alarms Coefficient
Detection
ANN Kriging ANN Kriging ANN Kriging ANN Kriging
Whole Region 67.23% 50.65% 14.39% 25.47% 18.38% 23.88% 0.6033 0.5590 (Bangladesh)
Region 1 71.22% 25.58% 14.82% 44.47% 13.95% 29.94% 0.7311 0.4925
Region 2 73.58% 22.74% 13.04% 34.45% 13.37% 42.81% 0.7663 0.4531
Region 3 65.64% 36.89% 18.37% 36.33% 15.99% 26.79% 0.6011 0.4070
Region 4 56.21% 20.05% 21.75% 39.83% 22.03% 40.11% 0.6253 0.4750
1
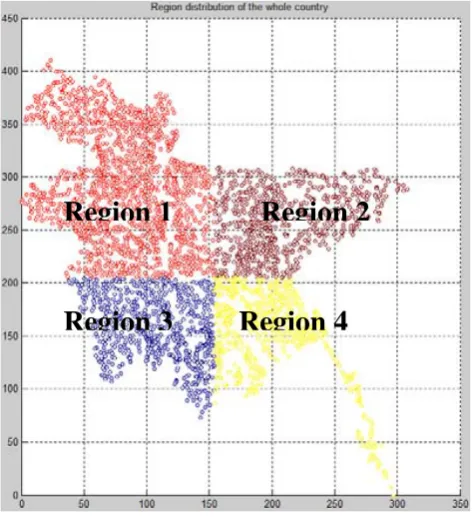
Figure 3.
Division of the study region in
four quadrants.
Region 1
Region 2
Region 3
Region 4
2
Fig. 3. Division of the study region in four quadrants.
successful applications reported in literature so far pertain mostly to the mapping of geophysical parameters. These parameters remain fairly static and exhibit spatially much smoother patterns in the timescales of interest (such as hy-draulic conductivity, soil porosity etc.), making them rela-tively easier to be modeled. Our study demonstrates that ANNs can also be confidently used to map with higher accu-racy than ordinary kriging the complex and seemingly erratic spatial pattern of groundwater contamination provided there is adequate data preprocessing performed.
It is not unreasonable now to argue that the use of more so-phisticated kriging techniques that account for non-linearity in spatial pattern could have provided more accurate results
on spatial mapping of arsenic contamination. One such po-tential candidate among the kriging group of methods is called disjunctive kriging (Chiles and Delfiner, 1999). Dis-junctive Kriging is a non-linear method wherein the original dataset is transformed using a series of additive non-linear functions (typically Hermite polynomials; Webster, 1991). However, this method, on account of requiring more restric-tive assumptions than ordinary kriging (Deutsch and Journel, 1998) has been found to fare more poorly for spatial map-ping of arsenic contamination in Bangladesh (Kinniburg and Smedley, 2001). The Hermite-transformed concentrations of arsenic were not found to follow a normal distribution, thereby resulting in more spurious estimates of arsenic con-centration at non-sampled locations. This may also be the reason why other reports using disjunctive kriging on arsenic data in Bangladesh have usually not been assessed of their limits on accuracy (Gaus et al., 2003).
One way to overcome the normality requirement of krig-ing could be to employ the method of indicator krigkrig-ing (Goovaerts, 1997). While the promise of this technique re-mains to be thoroughly tested for groundwater contamina-tion, we must note that it is essentially a linear technique and still relies on the two-point statistics of variograms. Fur-thermore, our experience with indicator kriging over arsenic data revealed that the technique is rather time consuming as it does not directly produce a map of estimates but functions on the basis of thresholds and exceedance probabilities. For all these reasons, the use of indicator kriging or disjunctive krig-ing would not have allowed us to comprehensively test our hypothesis that “non-linearity and multi-point pattern recog-nition can improve the spatial mapping of complex patterns of groundwater contamination significantly”. It is appropri-ate to mention herein that the problem of two-point statistics in ordinary kriging has also been perceived for a long time by the kriging community, and that a new approached has been developed, called “multipoint geostatistics” (Strebelle and Zhang, 2005).
The logical challenge now is to explore ways to leverage knowledge of the physics of the contamination process in non-linear mapping schemes used by tools like ANN. Tra-ditional ANNs are black-box tools and are often criticized as lacking in the ability to provide or ingest physical insights. However, using the theory of chaos, we have recently been able to demonstrate that the spatial randomness can indeed be deterministic (Hossain and Sivakumar, 2006) and there-fore has promise to be deterministically modeled (Hill et al., 2008). Our next steps should therefore be to find prac-tical ways to leverage the information gained from chaos analysis towards the robust design of ANN-type mapping schemes that can build upon kriging methods. Such an ef-fort can potentially blend the recently acquired knowledge on the physical factors governing contamination and act as a bridge between the data-based spatial mapping commu-nity and the process-based contamination commucommu-nity. So far, both communities have advanced their fields somewhat inde-pendently and we believe it is now time to explore competing paradigms simultaneously to minimize mapping uncertainty in resource-poor settings.
Edited by: O. Talagrand
Reviewed by: V. Kumar, G. de Marsily and two anonymous referees
References
Besaw, L. E. and Rizzo, D.E: Stochastic simulation and spatial esti-mation with multiple data types using artificial neural networks, Water Resour. Res., 43, W11409, doi:10.1029/2006WR005509. 2007
BGS-DPHE: Arsenic contamination of groundwater in Bangladesh, edited by: Kinnburgh, D. G. and Smedley, P. L., British Geolog-ical Survey Report WC/00/19, British GeologGeolog-ical Survey, Key-worth, UK, 1–4, (available at: http://www.bgs.ac.uk/arsenic, ac-cess: 20 September 2008), 2001.
Chiles, J. P. and Delfiner, P: Geostatistics: Modeling spatial uncer-tainty, Wiley, New York, 1999.
Chowdhury, M., Alouani, A. T., and Hossain, F.: Comparison of Or-dinary Kriging and Artificial Neural Networks for Spatial Map-ping of Arsenic Contamination of Groundwater in Bangladesh, Technical Note, Stoch. Env. Res. Risk A., doi:10.1007/s00477-008-0296-5, in press, 2009.
Deutsch, C. V. and Journel, A .G: GSLIB: Geostatistical software library and user’s guide, Oxford University Press, 369 pp., 1998. Faybishenko, B: Chaotic dynamics in flow through unsaturated
fractured media, Adv. Water Resour., 25(7), 793–816. 2002.
Gaus, I., Kinniburg, D. G., Talbot, J. C., and Webster, R: Geo-statistical analysis of arsenic concentration of groundwater in Bangladesh using disjunctive kriging, Environ. Geol., 44(8), 939–948, 2003.
Govindaraju, R. S. and Rao, A. R.: Artificial Neural Networks in Hydrology, Kluwer Academic Publishers, Amsterdam, 2000. Goovaerts, P: Geostatistics for natural resources evaluation, Oxford
University Press, 496 pp., (ISBN- 0195115384), 1997.
Hill, A. J., Hossain, F., and Sivakumar, B: Is Correlation Dimen-sion a Reliable Proxy for the Number of Influencing Variables required to Model Risk of Arsenic Contamination in Groundwa-ter? Stoch. Env. Res. Risk A., 22(1), 47–55, doi:10.1007/s00477-006-0098-6, 2008.
Hossain, F. and Sivakumar, B: Spatial Pattern of Arsenic Contam-ination in Shallow Tubewells of Bangladesh: Regional Geology and Non-linear Dynamics, Stoch. Env. Res. Risk A., 20(1–2), 66–76, doi:10.1007/s00477-005-0012-7, 2006.
Kinniburg, D. G., and Smedley, P. L. (Eds.): Arsenic contami-nation of groundwater in Bangladesh, Ministry of Local Gov-ernment, Rural Government and Cooperatives, Government of Bangladesh; BGS Technical Report WC/00/19, 1, 165–166, 2001.
Matheron, G: The theory of regionalized variables and its applica-tions, Cn. Centre Morphol. Math., 5, Ecole Nationale Superieure des Mines de Paris, Fontainebleau, France, 1971.
Nahar, N., Hossain, F., and Hossain, M. D: Health and Socio-economic Effects of Groundwater Arsenic Contamination in Ru-ral Bangladesh: Evidence from Field Surveys, International Per-spectives, J. Environ. Health, 70(9), 42–47, 2008.
Nickson, R. T., McArthur, J. W., Burgess, W., Ahmed, K. M., Ravenscroft, P., and Rahman, M: 1998: Arsenic poisoning of Bangladesh groundwater, Nature, 395, 338 pp., 1998.
Rahman, S. and F. Hossain: A Forensic Look at Groundwater Ar-senic Contamination in Bangladesh, Environmental Forensics, 9(4), 364–374, doi:10.1080/15275920801888400, 2008. Srinivasan, S. and Caers, J: Conditioning reservoir models to
dy-namic data: A forward modeling perspective, Soc. Petrol. Eng. J., SPIE 62941, 2001.
Strebelle, S. and Zhang, T.: Non-stationary multiple point geostatis-tics, in: Quantitative Geology and Geostatisgeostatis-tics, Geostatistics Banff, edited by: Leuangthong, O. and Deutsch, C. V., Springer Netherlands, 14, 235–244, doi:10.1007/978-1-4020-3610-1 24, 2005.
Webster, R: Local disjunctive kriging of soil properties with change of support, J. Soil Sci., 42, 301–318, 1991
Yu, W. H., Harvey, C. M., and Harvey, C. F: Arsenic groundwater in Bangladesh: A geostatistical and epidemiological framework for evaluating health effects and potential remedies, Water Resour. Res., 39(6), 1146, doi:10.1029/2002WR001327, 2003.