This special issue reviews the advances in tools for bird population monitoring in New Zealand. This issue is available at www.newzealandecology.org.nz/nzje/.
special issue:
Advances in tools for bird population
monitoring in New Zealand
Five-minute bird counts in New Zealand
Lynette J. Hartley
Department of Conservation, PO Box 11089, Christchurch 8441, New Zealand (Email: [email protected])
Published on-line: 30 July 2012
Abstract: The five-minute bird count (5MBC) method was developed in New Zealand in the early 1970s by the
DSIR for monitoring forest birds. The method has been undertaken consistently for nearly 40 years leading to a large resource of counts (over 200 000). These counts are valuable as they often provide our only historical baseline measure of multi-species bird populations in New Zealand forests. Over 120 000 counts are held in
the 5MBC database. The method was used between 1973 and 1992 by the DSIR, NZ Wildlife Service and NZ
Forest Service to investigate important ecological questions such as which forests are important for which bird species, and whether pest control operations affect bird populations. The method played a role in persuading the government to cease all logging of native forests on public land in New Zealand in 2002. Reviewing
5MBC studies suggests a number of features of the method that should be considered when designing a study
including that (1) it is an index not a census method, (2) observer, species behaviour, weather and season can
all affect the number of birds detected, (3) counts are habitat- species- and probably year- specific preventing
inter-species comparisons, and comparisons of species numbers at different sites if the counts were undertaken in different years. The method is suitable for investigating long term trends but there is likely to be considerable annual variability and a pilot study should be undertaken to investigate the number of counts needed to detect the difference of interest (i.e. power). The Department of Conservation website includes pages that provide resources for counters including standard data recording sheets. At present counters cannot enter their data into
the 5MBC database and there is a risk that data from counts will continue to be lost. Keywords: database;forest; index method; indices of abundance; monitoring; point count
Introduction
The five-minute bird count (5MBC) method, as described in Dawson & Bull (1975), has been the standard method for counting forest birds in New Zealand since the early 1970s.
The method involves an observer, who is stationary at a single point, counting every bird of every species that they see or hear
over a period of exactly 5 min. The method was developed and
fully described by the then Ecology Division of the Department
of Scientific and Industrial Research (DSIR) to provide an efficient index of numbers of birds in New Zealand forests,
‘accurate enough to detect major differences in abundance’
(Dawson & Bull 1975). It has now been used for nearly 40
years, and over 200 000 counts have been made across more than 260 studies. Here I describe both the development of the method and its history of use up until 1992, including use by three government agencies: the DSIR, the New Zealand
Forest Service, and the New Zealand Wildlife Service (initially known as the Wildlife Branch) of the Department of Internal Affairs. I also describe the Five-Minute Bird Count Database (5MBC Database), recently developed by the New Zealand
Department of Conservation (DOC) to preserve these datasets.
The database was funded by the Terrestrial and Freshwater Biodiversion Information System Programme (TFBIS).
The 5MBC method allowed quantitative information to
be collected on multi-species bird populations consistently
for the first time in forest. These datasets are, therefore,
historically and nationally important as they are often the only baseline measures we have of bird numbers and the only data available for investigating long-term trends (e.g. Smith
& Westbrooke 2004).
The 5MBC method has been the subject of much
unpublished debate in New Zealand and this account is, therefore, restricted to a description of studies that took place, the rationale for developing and using the method at the time, and a discussion on what has been learnt. The material for this paper was obtained by reviewing the published literature,
unpublished reports, and count data from the 5MBC Database.
There were also discussions with Dave Dawson, Eric Spurr
and Malcolm Harrison who were previously employed by the DSIR, Forest Service and Wildlife Service respectively. Studies
after 1992, the year by which all three organisations had been disbanded, are not included in this account as information about these studies (many of which are unpublished) is very scattered.
Origins of the five-minute bird count method
In 1971, the New Zealand Government announced the ‘South
Island Beech Utilisation Project’ (New Zealand Forest Service
1971). The project proposed large-scale milling of lowland
beech and beech–podocarp forests in Nelson, Southland and
the West Coast and the setting up of biological reserves that would remain unlogged (15% of the proposed 400 000 ha). To
advise on the best locations for these reserves, both the DSIR
and the Wildlife Service identified the need for a method to
count native birds in forest to investigate (1) which forests and forest-types were richest in bird species and preferred by key species, (2) whether birds’ use of forests changed seasonally, and (3) the size and nature of forest areas needed to provide an adequate network of reserves. There was no obvious nationally, or internationally, recognised method that was suitable. International literature at the time referred to bird ‘census’ techniques, using the term to refer to any quantitative study of bird numbers (Dawson pers. comm.). There was a large number of plot- and transect-based methods, including a
new distance sampling method (Emlen 1971), but few standards and little agreement (Dawson & Bull 1975). Dawson and Bull (1975) reviewed early quantitative work in New Zealand,
which started with Turbott’s (1940) study on Taranga Island,
finding that ‘three basic counting techniques have been used
though the details of each have varied. Breeding pairs have been counted on plots of known size; transect counts have been made while walking; and birds have been recorded in terms of their frequency of occurrence during some stated
interval’. The latter included a five-minute stationary count
(Dawson 1964). Dawson and Bull recognised the distinction between methods that ‘by mapping territories and nest sites, sought to establish the actual numbers of breeding birds’ and methods that ‘by some sampling procedure, sought merely an index of numbers’.
Method development and use at the DSIR
Dawson and Bull describe their reasons for favouring an index
method, and the DSIR trialled three methods in February 1973 (Dawson & Bull 1975): (1) walking counts at about 0.8 km
per hour, recording every bird seen and heard – sub-totalled
every 15 min (approx. 200 m), (2) five-minute stationary counts at points 200 m apart (the 5MBC method), and (3)
ten-minute stationary counts at points 200 m apart. In the analysis conducted, all three methods agreed closely with
each other and the variances did not differ significantly. The
counters preferred stationary counts as they could pay undivided
attention to the birds, while 5 min allowed more forest to be
sampled in a given time than 10 min and had less chance of erroneously recording the same individual bird twice. The
authors concluded that five-minute stationary counts were the most practical and efficient method trialled. The resulting paper described the method in sufficient detail for it to be repeated,
provided sample data-recording forms, and listed factors that could affect the number of birds recorded including observer ability, bird activity, topography and density of vegetation.
The first application of the 5MBC method to a practical question was in 1974–1975, when it was used to document
the broad habitat preferences and seasonal distribution of bird species in four different forests representing different proposed levels of logging under the Beech Utilisation Project (Dawson
et al. 1978). The study design also allowed examination of the various factors influencing the numbers counted. Counts
(480 in total) were made in each of the study areas at 2-month
intervals, and the authors concluded this was sufficient to
identify differences in counts in different habitats for 19 of the
most widespread species. Most species were more prevalent in
the forest type that was most actively targeted for logging and a proportion of the population of many species moved seasonally between forest types (both conclusions had implications for
reserve design). Observer bias was identified, particularly for
tomtit (Petroica macrocephala), chaffinch (Fringilla coelebs) and song thrush (Turdus philomelos), for which differences between observers were found to be greater than differences between areas.
The second DSIR application of the 5MBC method was in a long-term study initiated in 1974 at Mount Misery (Nelson
Lakes, New Zealand), to better understand beech forest ecosystems (Elliott et al. 2010). Counting stations were placed along a transect spanning the full range of altitudes up to the
treeline. This study became one of the longest running 5MBC datasets in New Zealand with 5355 counts conducted between 1974 and 1984. The same stations were adopted by DOC from
2002 onwards as the non-treatment area for the Rotoiti Nature Recovery Project (1229 counts as at January 2011). These two datasets have been reanalysed recently (Elliott et al. 2010). The authors considered confounding factors such as differences in observers between the two periods and potential differences in habitat structure, but concluded the changes in bird numbers
observed reflect actual population changes.
A third application of the 5MBC method by the DSIR was a 3-year study initiated in 1975 looking at the importance
of lowland forest in the Beech Utilisation Area for birds and, in particular, whether the forest had essential resources that
were needed seasonally (Wilson et al. 1988). The results
again suggested that many species move seasonally and reserve design needed to consider the welfare of
wide-ranging species such as tūī (Prosthemadera novaeseelandiae), bellbird (Anthornis melanura), New Zealand pigeon (kererū.
Hemiphaga novaeseelandiae) and kākā (Nestor meridionalis),
as well as resident species.
The 5MBC method was also employed by the DSIR to
investigate the impact of introduced predators on native bird
populations (Wilson 1988; Efford & Morrison 1991). Efford and Morrison (1991) counted at intervals of 2–3 weeks over three years (1977–1979) in sites with and without stoat (Mustela erminea) trapping, finding higher counts of several species
in the trapped areas. The authors concluded, however, that careful study design is needed in order to rule out observed differences in counts being due to unrelated factors such as
habitat difference between sites or irregular fluctuations in
bird populations. The data were also analysed for monthly correlations with a concurrent study by a University of
Canterbury student at Kowhai Bush, Kaikoura (Gill 1980),
but low (or even negative) correlations were found with 8 of the 10 species examined. These comparisons, and the
year-to-year variation observed by Efford and Morrison, showed
that it is not possible to apply simple adjustments to allow
comparison of 5MBCs made in different months as had been proposed by Dawson et al. (1978). Abrupt changes in numbers
were found to occur within 1- to 2-month periods, suggesting that counts at longer intervals may not adequately describe
seasonal patterns. Wilson (1988), also looking at the effect of
failed to increase as expected following pest control, and (2) numbers increased but the method did not detect the increase.
Starting in 1977, the DSIR undertook counts monthly for 2 years (5760 counts) to assess the effects on bird life of
replacing native forests with exotic conifer plantation forests
(Clout & Gaze 1984). The authors concluded such replacement
did not result in an overall reduction in numbers counted, or the diversity of species counted. Rather, it led to a change in avifaunal composition with counts of fruit- and nectar-feeding birds and obligate hole-nesters decreasing while counts of insectivores and seed-eaters (which do not nest in tree holes) being less affected and even increasing in some circumstances.
Between 1985 and 1986, Robertson and Hackwell (1995) used 5MBCs to investigate birds in different-aged stands of
contiguous kahikatea (Dacrycarpus dacrydioides) forest in
South Westland. Different species preferred different-aged
stands and the diversity of birds counted, particularly native species, was positively correlated with increasing structural complexity of the vegetation. Counts showed seasonal changes, most markedly increases in frugivorous birds during
kahikatea fruiting, very plausibly reflecting actual abundance
increases.
By 1992, when the DSIR was disbanded, there had been
19 studies amounting to 21 791 counts (Table 1).
Table 1. Five-minute bird counts undertaken between 1973 and 1992 showing the organisation, sites, number of counts,
and the years in which they were undertaken. Studies are presented in order of start date within each organisation category.
For studies that are not held in the Department of Conservation’s 5MBC Database, the minimum number of counts in each
study has been estimated from available information.
_________________________________________________________________________________________________
Organisation and study location
__________________________________________________________________________________________________________________________________________________________________
DSIR
__________________________________________________________________________________________________________________________________________________________________
Reefton 64
Reefton 2699
Mt Misery, Lake Rotoroa 5355
North Westland 1889
Eglinton Valley, Fiordland 2000
Cascade River 140
Nelson Forests 5760
Rimutaka 280 Haast-Arawata 80
Brown River, Marlborough 216 Mt Misery, Lake Rotoroa 216
North Egmont 148
Abel Tasman Islands 995
Titi & Trios Is, Marlborough 29
Orongorongo Valley 660 Cook & Karangarua rivers 960
Balls Clearing, Hawke’s Bay 100
Boundary Stream 100
Mohi Bush, Hawke’s Bay 100
__________________________________________________________________________________________________________________________________________________________________
Wildlife Service
__________________________________________________________________________________________________________________________________________________________________
Little Barrier Island 130
Kapiti Island 79
Rotoehu Forest 38
Westport Forests 648
Horohoro Forest 83
Kaimai Range 214
Lowland beech, West Coast 801
Hurakia Forest 101 Pureora 123
Kaimai–Mamaku 383
Pukepoto, Tongariro 66
Western Southland 461
North Westland 607
Okarito 82 Kowhai Bush, Kaikoura 22
King Country 706
South Westland 797
Karioi plantations 126
Rotoma 74
Rotoehu 39
Mapara 45
Horohoro 82
West Coast 211
Waipapa 6367
Catlins 95
Northland forests 278
North Westland 1479
Upper Wanganui 400
Whirinaki, Urewera 176
Hokonui & Catlins 440 Rangataua & Tongariro 230
South Westland 1799
Windbag Valley, Westland 615
Waitutu, Southland 738
Arthur’s Pass 472
__________________________________________________________________________________________________________________________________________________________________
Forest Service
__________________________________________________________________________________________________________________________________________________________________
Hope River, Lake Sumner 137
Hokonui Hills 480
Kaingaroa Forest 1895
Awakari River, Charleston 394 Charleston 640
Craigieburn, Broken River 9547
Taupo 120
Whirinaki 280
Rotoehu 160
Stewart Island 23
Ruahine Range 981
Haurangi, Rimutaka 440
Waimate 740
Stewart Island 4271
Stewart Island 1195
Maimai Ck, Westland 2160 Callery & Tatare, Westland 2881
Catlins 200 Rowallan Forests, Southland 8418
Maruia 8725
Northwest Nelson 700
Greenstone & Caples 100
Pureora 3062
Blue Mountains 5282
Waitangi, Westland 600
North Okarito 1500
Pureora 1440 Big Bush, St Arnaud 3360 Copland, Cook & Fox rivers 2960
Glendhu 7623
__________________________________________________________________________________________________________________________________________________________________
University
__________________________________________________________________________________________________________________________________________________________________
Regional Parks Wellington 90
Northwest Fiordland 146
Lake Sylvan, Routeburn 50 Kowhai Bush, Kaikoura 485
Banks Peninsula 240
Little Barrier Island 165
Golden Downs 287
Mamaku Plateau 2865
Ruamahanga, Tararuas 3840 Hawdon, Arthur’s Pass 116
Taranga Is, Hen & Chickens 50
Rangitoto Island 600
__________________________________________________________________________________________________________________________________________________________________
Private
__________________________________________________________________________________________________________________________________________________________________
Orongorongo 72
Western Paparoas 117
Little Wanganui, Karamea 86 Rakitu Island, Great Barrier 47
Ohau Gorge, Tararuas 82
_________________________________________________________________________________________________
Organisation and study location
__________________________________________________________________________________________________________________________________________________________________
Wildlife Service cont.
__________________________________________________________________________________________________________________________________________________________________
Little Wanganui, Karamea 81 Tuku Reserve, Chathams 150
North Okarito 2300
Auckland Domain 195
Rowallan, Southland 100
Korokoro, Wellington 175
__________________________________________________________________________________________________________________________________________________________________
Ornithological Society
__________________________________________________________________________________________________________________________________________________________________
Kapiti Island 600
Banks Peninsula 29
Tiritiri Matangi 500
Mana Island 3936
Botanic Gardens, Wellington 506
__________________________________________________________________________________________________________________________________________________________________
DOC
__________________________________________________________________________________________________________________________________________________________________
Matemateaonga District 40
Hawdon, Arthur’s Pass 484
Chathams 446
Windbag Valley, Westland 615
Boundary Stream 320
Pohangina, Ruahines 500
Eglinton, Fiordland 560
__________________________________________________________________________________________________________________________________________________________________
Lands and Survey
__________________________________________________________________________________________________________________________________________________________________
Secretary Island, Fiordland 70
Egmont 2000
__________________________________________________________________________________________________________________________________________________________________
_________________________________________________________________________________________________
Organisation and study location
__________________________________________________________________________________________________________________________________________________________________
Private cont.
__________________________________________________________________________________________________________________________________________________________________
Number of Counts
Method development and use at the New Zealand Wildlife Service
After the 1971 Beech Utilisation Project announcement the Wildlife Service was asked to investigate the suitability of the proposed reserves in the Beach Project Area, specifically
whether the proposed locations would allow representative populations of the existing birdlife to survive. The service
already had considerable experience with studying specific
native species and had experimented with a stationary-count
method lasting 5 minutes to investigate general forest birds in 1971 (Moynihan et al. 1979). It trialled Dawson and Bull’s
about-to-be-published method with initial practice counts
carried out on Little Barrier Island (Crook & Best 1973),
Kapiti Island and Rotoehu Forest in the North Island. The data and survey sheets from the Kapiti Island trial have survived,
making this the first 5MBC using the Dawson & Bull (1975)
method for which the raw data still exist.
A set of systematic surveys was then undertaken between
1974 and 1976 in the Beech Utilisation Area starting with
‘pilot surveys’ in 11 blocks in mainly unlogged forests, in
five main regions around Westport and Reefton (Crook & Best 1974). Counts were made at stations at 500-yard (475
m) intervals on a grid pattern based on the 1000-yard squares
of the then-standard NZMS 1 topographic maps, allowing
multiple points to be counted within each forest while ensuring systematic coverage. The intention was to detect major differences in counts between forests (Crook et al.
1977). The Wildlife Service then used this design to survey the lowland forests in the West Coast Beech Utilisation area
over 3 years visiting new forests each year (Crook & Best
1975; Best & Harrison 1976; Crook et al. 1977). These surveys
revealed that beech forests, contrary to their popular image as rather uniform and relatively lifeless, were a ‘rich mosaic’
of distinctly different habitats with bird species distributed unevenly. The forests were richer in birds than was previously
believed and Crook and Best (1974) expressed concern that
some of the areas already committed to utilisation, such as Hochstetter State Forest, had higher counts than the reserves of Little Barrier and Kapiti Islands. Counts were undertaken yearly for all 3 years in one forest and the relative abundance of species appeared to change between years (Crook et al.
1977), indicating that it is not possible to reliably compare
sites with counts undertaken in different years.
In 1976 the Wildlife Service started surveys in the Western
Southland forests, which were also part of Beech Utilisation
proposals (Best & Ogle 1979). Large differences in counts were
found between the eight blocks examined and these differences were greater than between the Southland forests and those on
the West Coast. In 1979–1980 the Wildlife Service returned
to eastern Southland and Otago to carry out counts in all large
areas of forest (>1500 ha) as part of a detailed wildlife and
habitat survey (Coker 1980). Surveys were also undertaken in
South Westland in 1977–1978 (Coker & Imboden 1980) and
again in 1983 (O’Donnell & Dilks 1986), with the latter counts suggesting good populations of several threatened species.
While the North Island state forests were not part of the
Beech Utilisation Project, many were either being logged or
designated for logging. Hence the Wildlife Service undertook 17 surveys (11193 counts) using 5MBC methodology in these areas between 1974 and 1980. Recommendations from these
surveys resulted in the setting aside of protected areas (e.g. the
1225-ha Mokaihaha Ecological area). The largest North Island study (during the period reviewed) was from 1978 to 1981 (6367 counts), but Harrison and Saunders (1981) found little
difference between the selectively logged and unlogged areas examined. They did note, however, that the precision achieved
with 5MBCs in this study was greater than expected; while the researchers expected to be able to detect a 30% difference in
only three or four species, in reality they were able to detect a
30% difference for at least 11 of the 15 species analysed, and a considerably smaller difference (<10%) for several species.
As with previous studies, analysis also showed there were differences between the main observer and the occasional observer, and Harrison and Saunders (1981) suggested that
tūī, bellbirds and riflemen Acanthisitta chloris could all be problematic for counters. Temperature and the Dawson &
Bull (1975) category ‘other noise’ (i.e. noise other than that
associated with wind and rain) were found to have a small effect, with noise varying from species to species and the direction of the temperature effect differing between species. This dataset
was reanalysed by Smith and Westbrooke (2004) comparing the counts from 1978–1981 with a set from 1997–1998 at a
comparable, but not the same, site. The counts of four out
of five native insectivorous species decreased significantly with bellbirds also showing a large significant decrease. The
authors were concerned by the apparent drop in numbers and suggested further study was needed to clarify whether the differences observed were actual differences and if the same declines had happened elsewhere. They suggest it is better to revisit the original count stations when repeating counts from earlier time periods to obtain more consistent data and allow more powerful analysis.
The Wildlife Service undertook many other 5MBC studies throughout New Zealand up to 1987 when it was disbanded. A total of 19007 counts are recorded across 35 studies (Table 1). This was the first time any organisation had systematically
attempted to study multi-species bird populations over large areas in New Zealand and it has not been attempted since.
The Service used 5MBC data to report on broad patterns of
relative abundance of birds in forests and its conclusions and recommendations contributed to the intense public debate at the time over whether logging of native forests should continue. The Service believed a systematic and consistent
approach using the 5MBC method meant its conclusions were reliable and defensible (M. Harrison pers. comm.). The
reports contributed to the establishment of new reserves such
as wildlife corridors in North Westland (New Zealand Wildlife Service 1986) and influenced government policy (e.g. Joint Campaign on Native Forests 1986). The Wildlife Service’s studies, using the 5MBC method, contributed to the process
that, ultimately, resulted in all logging on public land in New
Zealand being stopped in March 2002.
Method development and use at the New Zealand Forest Service
The Forest Service first used the 5MBC method in a small study in 1975, investigating bird populations relative to vegetation features (Wilkinson & Guest 1977). Then, in 1976 and 1977,
large numbers of a wide range of birds, including native species, were found dead after several aerial 1080-poisoning operations and research trials for brushtail possum (Trichosurus
vulpecula) control in the central North Island (Spurr 1981,
1991, 1994). This led to the implementation of the 5MBC
method in a BACI (Before-After Control-Impact) study design to assess the impacts of 1080-poisoning on bird populations, i.e. counts were made before and after 1080-poisoning in both poison and non-poison areas. In order to overcome diurnal, seasonal, and climatic biases, counts were made in the paired areas (poison and non-poison) at the same time on the same days (using two or more observers), and to overcome observer
bias, observers were switched between areas on subsequent days so that they counted an equal number of times in each area (Spurr 1981). Using this approach to monitor a series of
1080-poisoning operations and trials between 1977 and 1986,
researchers concluded that there was no evidence of deleterious long-term impacts on populations of any non-target bird species from 1080-poisoning for possum control that was adequately
monitored (Spurr 1981, 1989, 1991, 1994, 2000; Warren 1984; Calder & Deuss 1985). However, the limited detail in these reports makes it difficult to determine the degree of certainty
associated with these results.
The above reports and conclusions were considered, along with other evidence, in two government advisory reviews, both of which concluded that the risks of using 1080 were acceptable
in relation to the benefits (Parliamentary Commissioner for the Environment 1994; Environmental Risk Management Authority 2007).
Between 1978 and 1985 the 5MBC method was employed
by the Forest Service in several studies investigating seasonal and annual changes in bird populations. One of these studies,
at Craigieburn Forest from April 1978 to December 1982, is New Zealand’s largest 5MBC study in terms of the number of counts (9547). However, as with many Forest Service 5MBC
studies, it has yet to be written up. A second study, in the Blue
Mountains, counting in four seasons for 2 years (1983–1985), is the largest study in terms of counts (5282) undertaken by a single observer (Foord 1987). The 5MBC method was also used in a BACI design during 1979–1982, to monitor impacts of
other pest control methods on bird populations. One, on Stewart
Island from 1979 to 1982, assessed the non-target impacts of
1080-gel used for control of white-tailed deer (Odocoileus
virginianus) (New Zealand Forest Service 1982, 1983). In
addition to daytime counts, counts were also made at night for nocturnal species (Stewart Island kiwi Apteryx australis
lawryi and morepork ninox novaeseelandiae); this is the only
known example of five-minute counts being made at night. Other notable uses of the 5MBC method by the Forest Service, between 1981 and 1987, included assessing the impacts
on bird populations of coupe-logging where the forest was logged in blocks and allowed to regenerate naturally on a
120-year rotation (Spurr 1987). Spurr reported that the populations
of some species (yellow-crowned parakeet Cyanoramphus auricaps, New Zealand pigeon, kākā, rifleman, and yellowhead
Mohoua ochrocephala) were substantially adversely affected
by the logging, with considerably lower counts in the forest logged 1 year previously than in unlogged forest, fewer still
in the forest logged 5 years previously, and fewer again in the forest logged 15 and 25 years previously (Spurr 1987). Only
silvereye (Zosterops lateralis) and seven introduced species had higher counts in the logged areas. Two species, bellbird
and tūī, had similar counts in all logged stands regardless of age, and Spurr (1987) concluded this lack of differentiation
was probably a consequence of not applying the 200-m cut-off
rule prescribed in Dawson & Bull (1975); calls of these two
species carry a long way and calls from surrounding unlogged forest could have been recorded as coming from within logged forest. Similarly, Spurr et al. (1992) used the method to assess the seasonal abundance of birds in small podocarp
forest patches undergoing logging, but noted that the 5MBC
method was not useful in estimating bird abundance in such patches because birds that were heard, and not seen, could not be accurately allocated to small units of forest.
The Forest Service, through its research branch the
Forest Research Institute, was the most prolific bird-counting
between 1977 and 1992 amounting to over 70708 counts
(Table 1). The Service was disbanded in 1992.
Method development and use at other organisations
Universities, private individuals, the Ornithological Society of
New Zealand, and others undertook studies using the 5MBC method between 1975 and 1992. University researchers adopted the Dawson & Bull (1975) method shortly after it
was published, using it to investigate bird diversity in relation
to habitat structure (e.g. Dodgshun 1976), recolonisation of regenerated beech forest by birds (e.g. Willoughby 1976) and the seasonal use of different forest habitats (e.g. Gill 1980). Other notable studies included a large study (2865 counts) on the Mamaku Plateau (Taylor 1985), and Moffat and Minot’s
(1994) 3-year study looking at the relationships between
forest structure and avian communities. Moffat and Minot used a variant on the 5MBC method introducing a ‘near/far’ split to permit binomial distance sampling (Buckland 1987),
which they used to derive indices of relative abundance. They concluded the near/far ratio was very useful in assessing the distribution of common bird species but was inadequate for rarer species.
Developing the 5MBC Database
Developing and populating the 5MBC Database cost over
$200,000 and took more than 3 years, with one full-time and
numerous part-time DOC staff. As the first step, a list of New
Table 2. Percentage of 5MBC studies for which the raw
datasets are lost, not lost, or of unknown status (1964–2006).
____________________________________________________________________________
Years Lost (%) Not lost (%) Unknown (%)
____________________________________________________________________________
1964–1976 22 68 10
1977–1986 24 72 4
1987–1996 4 88 8
1997–2006 1 98 1
____________________________________________________________________________
Zealand studies that followed the Dawson & Bull (1975) 5MBC method was collated. Metadata including the names of
researchers, details of the study and the location and form of the data were collated for 266 studies amounting to over 200400 counts. A database was then developed, and priority given to
securing and entering the older (pre-1987) and larger 5MBC
datasets. These sets had become inaccessible and vulnerable to los, due to changes in both government organisations and storage technologies over time.
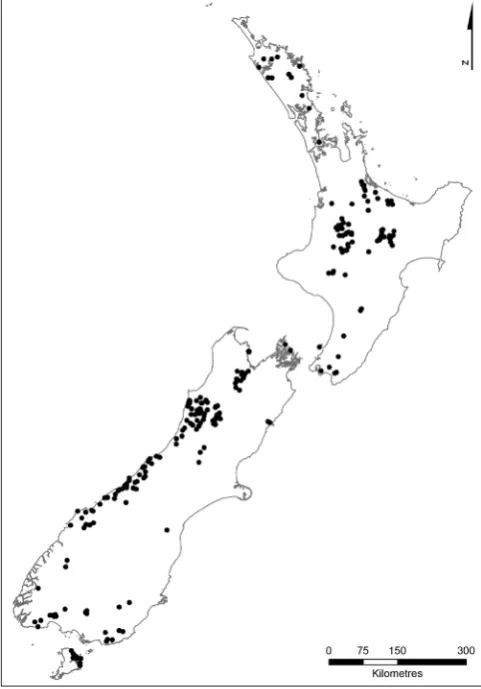
The 5MBC Database currently holds over 120000 counts from 75 studies (Figure 1; Department of Conservation 2011).
This equates to over 14 years of full-time bird counting
(assuming 15 min per count, 8 h per day, 5 days a week and 52 weeks per year). At least another 19 studies (representing a minimum of 86504 counts) are known to exist but are not in the database. Approximately 33% of the 266 identified studies
were found to be published or otherwise accessible, another
27% were written up in internal reports of variable quality and
accessibility, while the remainder were either not written up or
difficult to find. The raw data from 84% of the studies are still stored somewhere but the rest are either lost (11%; > 18 500 counts) or their status is unknown (5%; Table 2). Irreplaceable,
older data are particularly vulnerable, and more datasets would have continued to be lost over time if the database had not been developed. For poorly-documented studies, important metadata could not be found, including information about the
exact method used in the field, the locations of the stations,
and the reason for the study.
The 5MBC Database, designed in Microsoft Access,
stores three levels of information about each study: (1) level one is metadata about the study including where and why it was undertaken and by whom; (2) level two has information
about the specific locations of each count, i.e. station details
such as height above sea level and grid reference; and (3) level three contains the data recorded during each count including the observer identity, the time and date, the number of birds, their species, whether they were seen or heard, and auxiliary information about the weather during the count. Not all information is known for all studies. As slightly different auxiliary information was collected by different researchers historically, the database does not restrict the form in which this data can be entered (e.g. numbers or letters) but allows
the units or scale (and any associated category definitions) to be specified in level one. Weather, for example, was often recorded using a numerical scale (from 1 to 5) or codes (such
as r for rain, s for snow, etc.) and this information can be recorded for each study.
All researchers who were approached were willing to have their datasets entered and stored in the database. However, some were reluctant to make their data publicly available until their studies are written up and permission is required from the owners of these sets before they can be released. I suggest the
Figure 1. Map of New Zealand showing the locations of the
status of such access restricted datasets is reviewed regularly as these data were collected with public money, some over 20 years ago, and are nationally important.
Discussion
Proposed changes to the method
Five-minute bird counters have remained remarkably faithful
to the original Dawson & Bull (1975) 5MBC method.
However, one change that was made almost immediately was the abandonment of the recommended 200-m cut-off beyond
which birds are not recorded; counters found it difficult to
estimate 200 m in forest and it became routine to include all birds regardless of distance from the observer. Ninety percent of the known datasets are of this form (i.e. unbounded). Removing the cut-off, however, introduced other problems for species that can be heard at great distances such as bellbird
and tūī (e.g. Spurr 1987; Spurr et al. 1992). Researchers have
subsequently, and independently, made up their own rules on whether and how they record very distant birds.
There is considerable interest in replacing Dawson and
Bull’s (1975) categories of seen and heard by a near/far split
at a chosen break point. Both Dave Dawson (pers. comm.) and the author support this change as seen/heard has rarely been analysed, the task of determining and recording two distance categories seems comparable to the seen/heard category that is being replaced, and two categories would enhance the options
for analysis (e.g. Moffat & Minot 1994) while preserving
comparability with the large body of historical data. DOC
is currently trialling a new 5-minute bird count method for the national Tier 1 Inventory and Monitoring programme which has three distance categories <25 m, <100 m and >100
m (MacLeod et al. 2012). The rationale is that the >100 m
category replaces the original 200 m cut off and allows distant
birds to be removed during the analysis, and the 25 m break
replaces the original seen/heard split. It remains to be seen whether this new method is practical and whether it results in the same number of birds being recorded as the Dawson and Bull method; there is a risk that counters, preoccupied with the distance categories, fail to record some birds. As discussed, it is essential that any new method results in data comparable with historical data.
Designing a five-minute bird count study
Over the years, several things have been learnt, or confirmed, about the 5MBC method and these should be considered when designing a study. First, 5MBCs are an index, not a census
method. One of the remaining unresolved questions is the nature of the relationship between the numbers of birds counted and the real populations. The often-unstated assumption is that the relationship is positive and linear (i.e. the more birds there are,
the more a counter records). While changes in the numbers counted do appear to reflect real changes in some studies (e.g. Pierce et al. 1993; Murphy & Kelly 2001; Elliott et al. 2010),
this has rarely been tested and there are situations where this relationship could plausibly break down in a way that cannot be covered by study design. Possible failures include if birds call more vigorously following a drop in numbers as they search for new mates (Dawson 1981), if male-biased populations are more
conspicuous (Smith & Westbrooke 2004), and if counters reach
a saturation point as the numbers of a given species increase or if changes in one species ‘drown out’ the calls of another.
Greene & Pryde (2012) may be the only New Zealand study
that has investigated this relationship as few researchers are
in a position to know the true number of individuals present
in a study area. More work is needed and researchers should
always consider the possibility that any changes (or lack of changes) observed might not be real.
Second, a balanced study design is very important for
5MBC studies as there are sources of variability that can
be confounded with the abundance of a species, including observer effects, weather and hourly and monthly changes in detectability. Researchers should spend time on observer training and testing to minimise observer differences and use matched non-treatment areas to control for weather and season effects. Experience has shown that there are severe limitations on the ability of statistical models to deal with lack of balance in design.
Third, the apparent relative abundance of species can differ from year to year at a site for reasons that are not understood, and the covariates recommended for recording by Dawson
and Bull (1975) may explain little of the variation. It is not
valid therefore to compare two areas that were counted in
different years (Crooke et al. 1977; Efford & Morrison 1991),
even for the same season, unless an appropriate study design has been used. Seasonal changes in counts can be sudden and comparisons between years could be compromised if annual counts happened to take place on differing sides of such
changes from year to year (Efford & Morrison 1991). The
observed seasonal changes may be due to real changes, e.g. birds moving into an area or changes in the conspicuousness
of a resident population. For example kākā and New Zealand
pigeon are known to move seasonally to food sources (e.g.
Robertson & Hackwell 1995). Blackbirds (Turdus merula) and other bird species are known to be less conspicuous in winter (Dawson 1981; Harrison & Saunders 1981).
Fourth, although 5MBCs can be suitable for investigating
long-term changes (as they require few resources and can be repeated seasonally and annually); many years of counting may be required to detect a trend underlying the annual ‘noise’. Unfortunately there are few long-term datasets; however, sets from two distinct time periods have been successfully
analysed (e.g. Pierce et al. 1993; Smith & Westbrooke 2004;
Elliott et al. 2010). Revisiting exactly the same stations in the two time periods is recommended if a study is being repeated.
Fifth, using the method to compare the same species in different areas may be misleading due to differences in habitat.
For example, Moffat and Minot (1994), using a modified 5MBC, found that inconspicuous species varied little in their
mean radius of detection between habitats but the detection of conspicuous species varied markedly with changes of habitat. Likewise, as each species is measured on its own index scale there are serious questions over the validity of totalling counts across species or calculating species ‘diversities’ (Johnson 2008). Other bird-counting methods are becoming available,
such as distance-sampling techniques, where species-specific
detection functions are constructed and the use of these should be considered where appropriate (e.g. Broekema & Overdyck 2012; Spurr et al. 2012). One approach to analysis is to treat
5MBC data as detection/non-detection data rather than counts. Sixth, the power of a 5MBC study to detect differences
is critical, and preliminary pilot studies are recommended to determine whether the proposed regime of counts will have
sufficient power to answer the question of interest. Reports
(including for studies that did not detect a change in numbers) should provide estimates for the change or other parameters
of interest together with confidence intervals.
Finally, flocking species such as silvereyes are problematic
counted is violated. The 5MBC method is usually restricted
to diurnal birds although it has been used, on at least one occasion, for nocturnal birds.
Database information and recommendations for five-minute bird counters
Advice and resources are now available online for people
planning 5MBC studies (Department of Conservation 2011). Information about the 5MBC method is also available internally within DOC’s Inventory and Monitoring Toolbox, which should
be publicly available on the Department’s website in the near
future. DOC also runs 5MBC training courses for staff and
the public (Department of Conservation 2011).
To encourage good data management it is recommended
that five-minute bird counters ensure that they:
(1) Print the methods on every field sheet (see standardised
examples provided online; Department of Conservation 2011). This will ensure that both observers and future researchers have ready access to the method description and do not deviate from the method over time.
(2) Enter metadata about the study at the same time as the data and store the two together (e.g. on separate worksheets within the same spreadsheet). There is a standard Excel spreadsheet in a suitable format available online (Department of Conservation 2011). All raw data (i.e. the counts at each station) should be stored, not just derived data such as averages.
(3) Record the grid references using GPS for each counting
station, with this information entered on the same spreadsheet
as the raw data and the metadata, ensuring that the GPS grid system used is specified.
(4) Ensure that electronic datasets are stored where they are safe and can be found in the future, and updated as electronic storage formats change.
(5) Analyse and write up the data collected.
Future improvements to the 5MBC Database
Unlike the National Vegetation Survey Database (which stores data collected using the Recce sampling protocol; Hurst &
Allen 2007), there is currently no single national repository for 5MBC data in New Zealand. The 5MBC Database is only
accessible by the database administrators (Department of Conservation 2011), so neither members of the public nor DOC
staff can access the data directly. Ideally the 5MBC Database
should be further developed to make it accessible online for
internal and external parties to enter and store 5MBC data efficiently and securely. Systems also need to be developed
for checking and validating the data in the database as well as any new data added to it. Priority to date has been given to data entry rather than validation, relying on data users to inform the database administrator of any errors they identify. The integrity and value of the database remains compromised until data validation is completed.
Conclusions
The consistent use of the 5MBC method in New Zealand since the 1970s has facilitated several major advances in our
understanding of bird ecology, allowing (1) comparisons of bird populations in different forests and in different seasons, (2) comparisons of forest areas and an understanding of
the species composition of each area, (3) understanding of which particular forests were important for which species and groups of species, and (4) investigation into whether and how birds move between forests seasonally and attitudinally. The information gained allowed organisations to make
scientifically-based and justifiable recommendations on
the optimal location and attributes of reserves. The method also allowed bird populations to be monitored through 1080
operations for the first time (providing evidence that 1080
had no detectable adverse effect on bird populations), and the
identification of the adverse effects of logging and conversion
of native forest to conifers. Additionally, the method was
employed in many informative specific studies, for example
demonstrating that coupe-logging is detrimental in the short,
medium and long term to native birds, and allowing the first
research into the effect of stoats on birds at a population level.
Over 200 000 5MBCs have been undertaken since the method was developed in 1975. These data are often the only
available measure of historical bird numbers in New Zealand forests and therefore our only way of determining population trends over time. These data present opportunities for (1) reanalysis using recently developed statistical techniques, (2) repeating earlier studies to investigate changes over time, (3) adding information to historical presence/absence distributions, and (4) investigating changes in areas where there has been on-going conservation work relative to other areas. The large body of data also presents an opportunity to investigate which variables such as observer, noise, weather, etc., have substantial effects on the counts.
The 5MBC Database is a valuable resource as it contains over 120 000 counts. More work is needed before the
database can be accessed directly so contemporary data can be added by interested parties. It is fortunate that many of the
historical 5MBCs were undertaken by well-trained counters
for government agencies and that there was a clear description of the method right from the start. These methodological consistencies meant large quantities of data could be added to
the database relatively easily. However, post-1987 the number of different formats in which 5MBCs were collected and stored
increased dramatically, making the collating and entering of
these data a daunting task. People conducting 5MBCs are
encouraged to follow the standard method and enter their data into the standard spreadsheet provided on the DOC website until such time as a publically accessible database is available.
Together with the National Vegetation Survey Database,
the 5MBC data are one of the very few indexes of biodiversity
in New Zealand forest that was collected using a consistent methodology. As the data span decades they provide a unique data source for assessing long-term trends for birds in New Zealand forests. Five-minute bird counts have a place in the history of ecological research in New Zealand and the data from them have made a difference for conservation in New Zealand.
Acknowledgements
Both Dave Dawson and Eric Spurr have been generous with their time commenting on drafts for this paper. Any historical
mistakes are mine, not theirs. Peter Dilks, Peter Gaze, Malcolm
Harrison, Rod Hay, Colin O’Donnell and Keith Owen have also patiently answered numerous questions. In addition this
Dan Tompkins, Ian Westbrooke and an anonymous referee. The
Terrestrial and Freshwater Biodiversity Information System Programme (TFBIS) and the Department of Conservation
funded development of the 5MBC Database, and the collection of metadata and data from 5MBC studies.
References
Best HA, Harrison M 1976. An assessment of the proposed biological reserves in the West Coast Beech Project
Area with respect to the avifauna of the region. Fauna
Survey Unit Report 7. Wellington. New Zealand Wildlife
Service. 38 p.
Best HA, Ogle CC 1979. Birdlife of the Western Southland
Beech Project Area. Fauna Survey Unit Report 16.
Wellington, New Zealand Wildlife Service. 31 p.
Broekema I, Overdyck O 2012. Distance sampling to estimate densities of four native forest bird species during multi-species surveys. New Zealand Journal of Ecology 36:
353-364.
Buckland ST 1987. On the variable circular plot method of
estimating animal density. Biometrics 43: 363–384.
Calder B, Deuss F 1985. The effect of 1080 poisoning on bird populations in Motere, Pureora State Forest Park, winter
1984. Auckland, New Zealand Forest Service. 39 p.
Clout MN, Gaze PD 1984. Effects of plantation forestry on
birds in New Zealand. Journal of Applied Ecology 21:
795–815.
Coker PM 1980. Wildlife values of the forested areas of
Hokonui and Catlins. Fauna Survey Unit Report 23.
Wellington, New Zealand Wildlife Service. 23 p. Coker PM, Imboden C 1980. Wildlife values and wildlife
conservation in South Westland. Fauna Survey Unit Report 21. Wellington. New Zealand Wildlife Service. 109 p. Crook IG, Best HA 1973. Distribution of honeyeaters
(Meliphagidae) on Little Barrier Island. Fauna Survey Unit Report 1. Wellington, New Zealand Wildlife Service. 9 p. Crook IG, Best HA 1974. Diversity and numbers of bush-birds
in some forests in the West Coast Beech Project Area. Fauna Survey Unit Report 2. Wellington, New Zealand Wildlife Service. 15 p.
Crook IG, Best HA 1975. An assessment of the impact on
native vertebrate wildlife of large-scale utilisation of lowland beech and beech-podocarp forests on the west coast of the South Island. Fauna Survey Unit Report 6.
Wellington, New Zealand Wildlife Service. 45 p. Crook IG, Best HA, Harrison M 1977. A survey of the native
bird fauna of forests in the proposed Beech Project Area
of North Westland. Proceedings of the New Zealand
Ecological Society 24: 113–126.
Dawson DG 1964. Heaphy Track survey. Notornis 11: 127–129. Dawson DG 1981 Counting birds for a relative measure (index)
of density. In: Ralph CJ, Scott JM eds Estimating numbers
of terrestrial birds. Studies of Avian Biology 6. Cooper Ornithological Society. Pp. 12–16.
Dawson DG, Bull PC 1975. Counting birds in New Zealand
forests. Notornis 22: 101–109.
Dawson DG, Dilks PJ, Gaze PD, McBurney JGR, Wilson PR 1978. Seasonal differences in bird counts in forests near Reefton, South Island, New Zealand. Notornis 25: 257–278.
Department of Conservation 2011. Five-minute bird counts. http://www.doc.govt.nz/conservation/native-animals/
birds/five-minute-bird-counts/
Dodgshun PS 1976. Response of bush-bird diversity to habitat
structure in Northwest Fiordland. Unpublished BSc (Hons) project in Zoology, University of Canterbury, Christchurch,
New Zealand. 56 p.
Efford MG, Morrison K 1991. Counts of forest birds in the
Hollyford and Eglinton valleys, Fiordland: the possible
effects of stoat trapping. DSIR Land Resources Scientific Report 20. Lower Hutt, Department of Scientific and
Industrial Research. 43 p.
Elliott GP, Wilson PR, Taylor RH, Beggs JR 2010. Declines in
common, widespread native birds in a mature temperate forest. Biological Conservation 143: 2119–2126.
Emlen JT 1971. Population densities of birds derived from
transect counts. Auk 88: 323–342.
Environmental Risk Management Authority 2007. The
reassessment of 1080: an informal guide to the August
2007 decision of the Environmental Risk Management Authority. Wellington, New Zealand Environmental Risk Management Authority. 28 p.
Foord M comp. 1987. Birds of the Blue Mountains, South
Island New Zealand: a report on the bird survey of
1983-1985. Invercargill, New Zealand Forest Service, Southland Conservancy. 65 p.
Gill BJ 1980. Abundance, feeding and morphology of passerine
birds at Kowhai Bush, Kaikoura, New Zealand. New
Zealand Journal of Zoology 7: 235–246.
Greene TC, Pryde MA 2012. Three population estimation
methods compared for a known South Island robin population in Fiordland, New Zealand. New Zealand
Journal of Ecology 36: 340-352.
Harrison M Saunders AJ 1981. A comparison of bird
populations in logged and unlogged indigenous forest
areas within Pureora and Whirinaki forests, North Island, New Zealand. Wellington, New Zealand Wildlife Service, Department of Internal Affairs. 159 p.
Hurst JM, Allen RB 2007. The Recce method for describing
New Zealand vegetation: field protocols. Lincoln, Landcare Research. 29 p.
Johnson DH 2008. In defense of indices: the case of bird
surveys. Journal of Wildlife Management 72: 857–868. Joint Campaign on Native Forests, New Zealand Wildlife
Service, Ecology Division DSIR 1986. North Westland
forest management area reserve proposals: joint submission
to Protected Area Scientific Advisory Committee PASAC.
123 p.
MacLeod CJ, Greene T, MacKenzie DI, Allen RB 2012. Monitoring widespread and common bird species on New
Zealand’s conservation lands: a pilot study. New Zealand Journal of Ecology 36: 300-311.
Moffat M, Minot EO 1994. Distribution and abundance of
forest birds in the Raumahanga Ecological Area, North Island, New Zealand. New Zealand Journal of Zoology
21: 135–150.
Moynihan K, 1979. Native wildlife of Whirinaki Forest. Fauna Survey Unit Report 17. Wellington, New Zealand Wildlife Service. 18 p.
Murphy DJ, Kelly D 2001. Scarce or distracted? Bellbirds
(Anthornis melanura) foraging and diet in an area of
inadequate mistletoe pollination. New Zealand Journal
of Ecology 25(1): 69–81.
New Zealand Forest Service 1971. Utilisation of South Island
beech forests. Presented to the House of Representatives
New Zealand Forest Service 1982. Stewart Island studies: An example of integrated FRI research. Report of Forest Research Institute for 1 January to 31 December 1981.
Wellington, New Zealand Forest Service. Pp. 54–58.
New Zealand Forest Service 1983. Stewart Island studies: First year assessment of the deer poisoning operation. Report of Forest Research Institute for 1 January to 31 December
1982. Wellington, New Zealand Forest Service. Pp. 68–72. New Zealand Wildlife Service 1986. Habitats, reserves and
corridors for wildlife in North Westland. Wellington, New Zealand Wildlife Service, Department of Internal Affairs. 59 p.
O’Donnell CFJ, Dilks PJ 1986. Forest Birds in South Westland:
status, distribution and habitat use. Occasional publication
10. Wellington, New Zealand Wildlife Service, Department of Internal Affairs. 179 p.
Parliamentary Commissioner for the Environment 1994.
Possum management in New Zealand. Wellington, Office
of the Parliamentary Commissioner for the Environment. 196 p.
Pierce RJ, Atkinson R, Smith E 1993. Changes in bird numbers
in six Northland forests 1979 - 1993. Notornis 40: 285–293. Robertson HA, Hackwell KR 1995. Habitat preferences
of birds in serial kahikatea Dacrycarpus dacrydioides (Podocarpaceae) forest of South Westland, New Zealand. Biological Conservation 71: 275–280.
Smith ANH, Westbrooke IM 2004. Changes in bird conspicuousness at Pureora Forest. Notornis 51: 21–25.
Spurr EB 1981. The effect of 1080-poisoning operations
on non-target bird populations. What’s New in Forest
Research No. 94. Rotorua, Forest Research Institute. 4 p.
Spurr EB 1987. Beech management — its effects on bird populations. What’s New in Forest Research 146. Rotorua,
Forest Research Institute. 4 p.
Spurr EB 1989. Bird populations before and after
1080-poisoning of possums in Westland National Park.
FRI contract report for the Department of Conservation. Christchurch, Forest Animal Ecology Section, Forest Research Institute. 9 p.
Spurr EB 1991. Effects of brushtail possum control operations on non-target bird populations. Proceedings of the
International Ornithological Congress 20: 2534–2545.
Spurr EB 1994. Review of the impacts on non-target species
of sodium monoflouoroacetate (1080) in baits used for
brushtail possum control in New Zealand. In: Seawright AA, Eason CT eds Proceedings of the science workshop
on 1080. Royal Society of New Zealand Miscellaneous
Series 28: 124–133.
Spurr EB 2000. Impacts of possum control on non-target
species. In: Montague TL ed. The brushtail possum:
biology, impact and management of an introduced
marsupial. Lincoln, Manaaki Whenua Press. Pp. 175–186. Spurr EB, Borkin KM, Drew KW 2012. Line-transect distance
sampling compared with fixed-width strip-transect counts
for assessing tomtit (Petroica macrocephala) population
trends. New Zealand Journal of Ecology 36: 365-370. Spurr EB, Warburton B, Drew KW 1992. Bird abundance in
different-aged stands of rimu (Dacrydium cupressinum)—
implications for coupe-logging. New Zealand Journal of Ecology 16: 109–118.
Taylor GA 1985. The effects of logging on forest bird communities on the Mamaku Plateau, New Zealand. Unpublished Masters thesis, University of Canterbury,
Christchurch, New Zealand.
Turbott EG 1940. A bird census on Taranga (the Hen). Emu 40: 158–161.
Warren A 1984. The effects of 1080 poisoning on bird
populations in Tihoi, Pureora State Forest Park, winter 1983. Auckland, New Zealand Forest Service. 34 p.
Wilkinson GB, Guest R 1977. Forest birds of the Hope
catchment, Lake Sumner State Forest Park, North Canterbury. Notornis 24: 161–166.
Willoughby HBG 1976. Bird recolonisation of regenerated
beech (Nothofagus) Forest. Unpublished dissertation for
Diploma in Wildlife Management, University of Otago,
Dunedin, New Zealand.
Wilson PR 1988. Effects of stoat control on bird populations of
Adele Island, Abel Tasman National Park, Nelson. DSIR Ecology Division report prepared for the Department of
Conservation, Wellington. 5 p.
Wilson PR, Taylor RH, Thomas BW 1988. Effect of topography
on seasonal distribution of forest birds in the Ohikanui,