© 2013 Electronic Journal of Science Education (Southwestern University) Retrieved from http://ejse.southwestern.edu
Documenting Residential Environmental Education Program Impact with
Concept Maps
Nicholas Bourke
Auburn University Montgomery Connie Buskist
Auburn University Montgomery Steven LoBello
Auburn University Montgomery
Abstract
Residential environmental education centers are important providers of science curriculum, offering students learning experiences outside the traditional classroom. One major criticism of these centers and other nonformal science centers is that they often do not include student outcomes in the evaluation of their programs. The purpose of this study was to examine the effectiveness of the use of concept maps as a means of documenting changes in student knowledge in order to include students in the program evaluations of residential environmental education centers. In this mixed-method study, 3rd and 6th grade elementary students created concept maps before and after a field trip to a residential environmental education center. Analyses of the maps revealed a significant increase in the number of unique ideas represented on the posttest maps. Interviews with stakeholders revealed that the maps provided center stakeholders with valuable information regarding program impact. Results of the study suggest that concept maps can be used effectively to document changes in student knowledge and may contribute to improvement in program evaluations of residential environmental education centers.
Correspondence concerning this manuscript should be addressed to: Nicholas Bourke, PO Box 244023, Montgomery, AL 36124-4023, [email protected]
Key words: Environmental Education, Program Evaluation, Concept Maps
Introduction
trips and an increased emphasis on accountability of student learning, teachers and schools must be able to document the value in spending two to five days at an environmental center away from their normal school work.
However, REECs have been criticized for their lack of quality program evaluation (Carleton-Hug & Hug, 2010; McDuff, 2002). Like many nonformal science centers, REECs face unique challenges in conducting evaluation. REECs provide many different types of programs for a diverse set of participants. The multiple goals of the center as well as the competing goals of the participants can interfere with quality evaluations (Christensen, Nielsen, Rogers, & Volkov, 2005). Often REECs do not have a clear set of program objectives (Carleton-Hug & Hug, 2010). In addition, REECs often lack the money and expertise needed to conduct and interpret quality evaluations (Powell, Stern, & Ardoin, 2006; Norland, 2005).
One particular area of weakness often noted for REECs is the lack of student outcomes as part of their program evaluation (Carleton-Hug & Hug, 2009). REEC directors understand that documenting changes in student understanding is vital to their survival. Schools and funding sources want to know that the time spent in a program is worthwhile. However, finding effective ways to evaluate student understanding can be a challenge. Center staff are reticent to give up the short amount of time they spend with students in the outdoor classroom in order to complete student assessment. Center directors are hesitant to ask visiting teachers to give up their own class time before and after a visit to conduct assessment. When student assessment is included, it is most often conducted at the end of the program and is not used as formative assessment (Carleton-Hug & Hug, 2010).
Many in the EE community have called for more research to be conducted in the area of evaluation and/or for improvements to evaluation practices to be made (National Environmental Education Advisory Council (NEEAC, 2005). This study explored the use of concept maps as a method of documenting changes in student understanding of environmental topics taught at one REEC in the Southeast region of the United States. A concept map is a type of graphic organizer commonly used in classroom settings to organize information or knowledge about a topic. Concept maps have been shown to enhance learning in many academic disciplines (Quinn, Mintzes, & Laws, 2004). Concept maps also have been utilized in previous studies to document program impact of student visits to museums and similar nonformal center sites (Gregg & Leinhardt, 2002).
At the REEC involved in this study, student participation in program evaluation was limited to a student suggestion box located in the cafeteria and informal discussion with the students at the conclusion of their visit. The Program Director was concerned there was no systematic or formal method of collecting information about what students were actually taking away from their visits at the center. The center’s need for better student assessment data was driven by a desire to understand if the program increases students’ understanding of environmental topics so that they could 1) build on the areas that are successful and make changes in deficient areas; 2) provide stakeholders, most importantly school officials, with documentation that the center did have a positive impact on the students who visit.
Methodology
Electronic Journal of Science Education ejse.southwestern.edu stakeholders then participated in semi-structured interviews in which they shared their perspective as to the utility of concept maps as an assessment of student learning and as a program evaluation tool.
Participants
Participants were a sample of convenience. The REEC utilized in the study was located in the same geographical area (the Southeastern United States) as the researchers. Student participants were 3rd and 6th graders from two elementary schools located in the Southeast United States. Students in four classrooms were already scheduled to visit the residential environmental education center as a school field trip and the teachers and school officials agreed to be part of the study. Four adult stakeholders, each with 5 to 20 years of classroom teaching experience, participated in the semi-structured interviews: three classroom teachers, one principal, the center’s Program Director, and the center's Program Coordinator.
Procedures
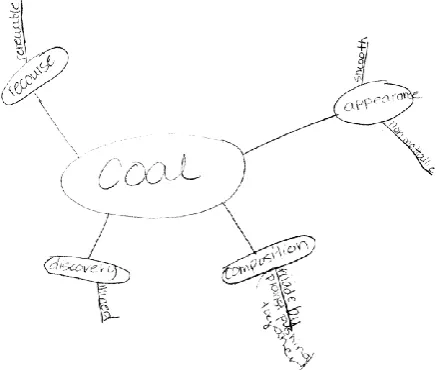
Pre and post paired concept maps were created by students visiting a residential environmental education center (n=60). The day prior to the students' field trip, the researchers visited the participating classrooms. Prior to this visit, the researchers verified that participating teachers utilized concepts maps as an instructional strategy in their classrooms, so students were familiar with how to create one. As a review of this instructional technique, researchers first created a sample map with the students on a topic that would not be covered during the visit to the center. The students then created their own concept maps related to a curriculum topic predetermined by the classroom teachers and the environmental center staff (See Figure A for an example of a student created map). Topics included "habitat", "coal", "energy", and "respect". As Gregg & Leinhardt (2002) point out this activity also is a way of preparing students for what they will be learning about during their camp visit. Maps were coded with student numbers known only to the school principal so that pre-visit maps could be matched with post-visit maps.
Figure A: Emily's pre visit map.
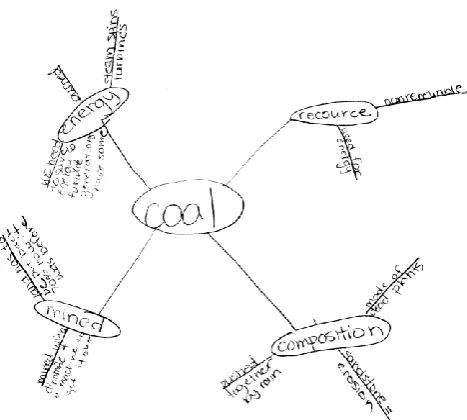
classroom teachers based on their curriculum needs were presented to the students. The school day following the field trip, the researchers asked the students to create a post-visit concept map related to the same topic as their first concept map (See Figure B for an example). Concept maps were analyzed quantitatively to determine changes in the number of unique ideas presented as well as qualitatively to determine differences in depth of understanding. Analyses were shared with the camp stakeholders including the Program Director, Program Coordinator, a visiting school principal, and the visiting school teachers. Semi-structured interviews were conducted with these stakeholders following the sharing of data.
Figure B: Emily’s post visit map.
Data Analysis and Results
Concept maps were analyzed as suggested by Gregg and Leinhardt (2002). The researchers counted unique and accurate concepts listed or described on the maps. Pre and post visit maps were compared to look for both individual and group changes. Two researchers independently analyzed student created pre and post visit maps. Analyses were compared and discussed so that a consensus could be reached relating to the ideas represented in each map. Data from the pretest-posttest design were analyzed with a repeated measures analysis of variance. The dependent variable was the difference in the number of unique ideas generated by participants before and after participation to the REEC programing. Because the topics covered varied between the visiting schools, program topic was included in the analysis to determine if the dependent variable was influenced by this variable. In this study, there were four different program topics: Habitat, Energy, Coal, and Respect. Analyses were based on a sample of 60 participants.
Statistical analysis revealed that there was a significant increase in the mean number of correct and unique ideas generated by participants after participating in the REEC programing. The pretest mean was 5.1 (s = 2.1, range = 1 – 10) and the post-test mean was 8 (s = 3.5, range = 1 -17). Univariate repeated measures analysis of variance for within-subjects effects indicated that this was a statistically significant difference (F[1,56]= 71, p <
.0001), but the interaction between number of ideas generated and topic was not significant (F[3, 56 = 2.2, p =n.s.). Given this latter result, it is not surprising that there were no significant
Electronic Journal of Science Education ejse.southwestern.edu Differences in depth of understanding were determined by examining the content of the ideas represented on both pre- and post-visit maps Analysis of individual maps revealed that students had more vocabulary related to the topic and a better ability to describe specifics of the different topics after the camp visit. Specific examples are presented in the discussion section.
A summary of these results, along with copies of the maps that the students created, was shared with the REEC stakeholders. After the maps and statistical findings were shared with the center stakeholders, the researchers conducted semi-structured interviews with visiting classroom teachers, a visiting school principal, the REEC Program Director, and the REEC Program Coordinator. Interviews were digitally recorded and transcribed. Interviews were coded and analyzed for themes using the constant comparative method suggested by Merriam (2001). Results of the interviews are shared in the following discussion section.
Discussion of Findings Students
In planning a visit to the REEC, classroom teachers decide which of many course offerings they want presented to their students. Center courses are aligned to state and national standards including science, social studies, and character education standards. Teachers choose courses based upon the curriculum, standards, and learning goal requirements of their particular grade level. In this study, 3rd grade students studied wildlife habitats while the 6th grade students learned about coal and energy. The REEC tailors programming to the needs of each visiting class, teaching or reinforcing specific learning goals. In addition, the REEC includes character development and reinforcing the concept of “respect for the earth and its beings” as one of its major objectives for all visiting students. Character development and the concept of respect are infused in all activities and instructional programs throughout the camp visit. Assessment of student learning is important for both the classroom teachers and the center staff. The present study found that the use of concept maps could be an effective approach for measuring student learning.
Statistical analysis revealed significantly more unique ideas on the post-visit maps indicating an overall shift in understanding of specific concepts for the visiting students as a whole. The differences between what individual students put on their initial maps versus what they put on their final maps were often quite dramatic. Although the statistical information is useful in program evaluation that is aimed at funding and or providing evidence of effectiveness for schools, analysis of the individual and group changes can be especially helpful for teachers and administrators at the REEC. Studying the changes in student responses allowed teachers to see what content students were retaining and what might not have been adequately learned. It also gives insight into misconceptions that students might have at the end of their visit. In some instances there was not a change in the number of unique ideas represented on the post-visit maps, but there was a significant change in understanding of concepts. In the next few paragraphs, we provide more information about some of these changes.
desert, ocean, or forest. Some maps included things that would be eaten by animals in various habitats and included terms such as shelter and environment.
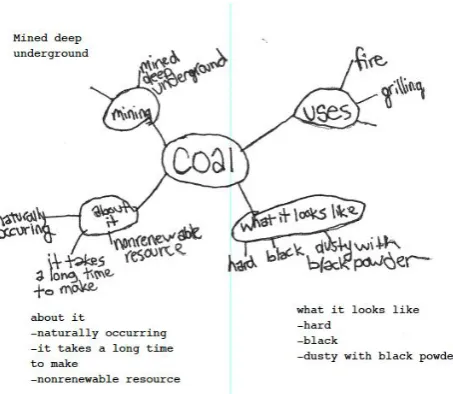
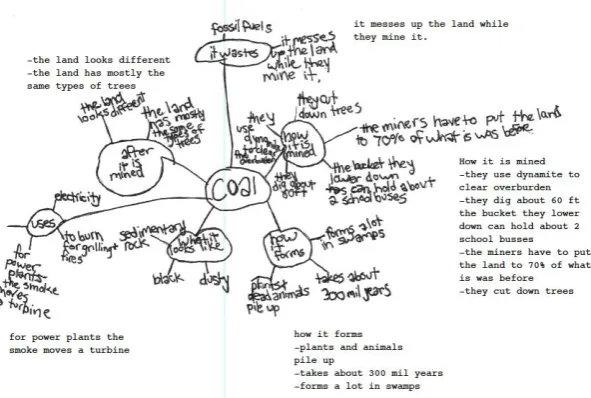
Similar gains in understanding were shown through qualitative analysis of the coal maps. In their pre-visit maps of coal, 6th grade students provided evidence of prior knowledge by listing things such as black and rough, it takes years to form under heat and pressure, composed of carbon, used to create electricity, and nonrenewable resource. Post-visit maps revealed a depth of understanding not present in the pre-Post-visit maps. Students added details regarding the formation of coal including the fact that it takes hundreds of millions of years to form and that it comes from ancient swamps. Students also noted how the coal was mined and the effects of the mining. Maps included information related to strip mining and reclaiming the strip mine after mining operations have ceased at a site. One student went into great detail noting the use of dynamite in the mining process and the fact that miners need to remove 60 feet of overburden to reach the coal underground. These are all topics that are covered in the REEC programming and mapping provided evidence of student understanding to both the visiting teachers and the REEC staff. See Figure C and D for an example of pre and post-visit coal maps.
Electronic Journal of Science Education ejse.southwestern.edu Figure D: Phillip’s Post-visit map
Concept maps on the topic of energy also showed greater depth of understanding. The REEC lists natural resources, including the idea of conversation of these resources to help the environment, and electricity as key concepts covered in the course programing. Qualitative analysis of concept maps revealed that students were familiar with the term energy before their visit to the center. Most students remembered kinetic and potential energy, topics in the 5th grade science curriculum. Most maps included concepts related to the forces used to produce energy including the wind, sun, and water. Noticeable differences in the post-visit maps included the prevalence of the term conservation and ideas about the importance of conserving energy. Post-visit maps included the terms renewable and nonrenewable and examples of each.
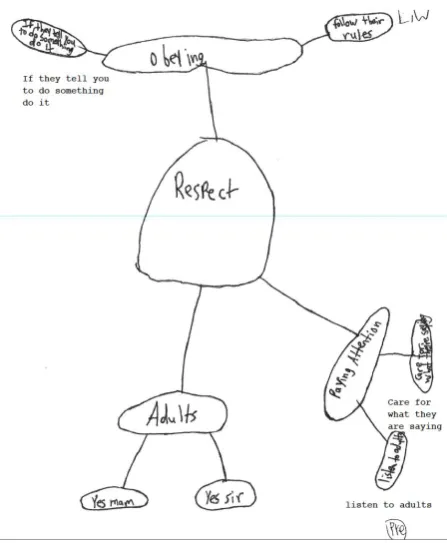
Perhaps some of the most interesting changes were revealed on the maps about respect. On their initial maps students used terms such as manners, obeying, and paying attention as descriptors of respect. Many pre-visit maps revealed an understanding of respect related to following instructions of adults and paying attention. In many instances, respect was described as having proper classroom behavior and following rules.
Figure E: Natalie’s pre-visit map.
Figure F: Natalie’s post-visit map.
Stakeholders
Once stakeholders had an opportunity to study the statistical analysis and the individual pre- and post-concept maps, researchers held interviews with several of them. Center stakeholders participating in interviews all had teaching experience ranging from 5 years to over 20 years as classroom teachers. Each interview respondent indicated that they were familiar with concept maps and had utilized them in their own classrooms. They described concept maps as useful teaching tools and excellent graphic organizers.
Electronic Journal of Science Education ejse.southwestern.edu Stakeholders were asked about their perceptions regarding the use of concept maps for assessment purposes. Several characteristics of concept maps stood out during the interviews in regards to their utility as an assessment tool to meet teacher, school, and center needs in this area. Each of these is discussed below.
1) The visual nature of the concept maps was considered particularly beneficial. In the past, the primary means of documenting the impact of a REEC visit on students had been anecdotal with little concrete evidence of student growth. The concept maps provided a quick and accurate method to document change in student understanding, as well as an easy format to show that change to others. The Program Coordinator described her ability to "use the maps as a graphic for the person considering a trip to our center." The visiting school principal stated that the student-created maps helped her to actually see growth of ideas in the students after the center field trip. A visiting classroom teacher described the student-created maps as "evidence" and "more real-life” than typical assessments. This format seems to be particularly suited to the nonformal learning environment of the REEC.
2) The quantitative information derived from the maps was considered to be helpful. The quantitative data analysis was seen by the stakeholders as documentation that learning was taking place and is the type of information that the center needs. The Program Director stated that the combination of the actual graphic and the statistics would provide her with documentation of program impact as she visits funding sources for the center.
3) The open-ended nature of the concept maps was seen as meeting the needs of the learners, and creating the maps was seen as more engaging for students than typical assessments. The maps reveal students’ prior knowledge about a topic, which can be helpful for center staff as they plan their lessons. Because students are not being asked specific questions, as would typically be done in a written pretest, they can reveal what students know or do not know about a topic. The Program Coordinator shared her assessment of the student-created maps.
When I see what kids write on the maps, it really reveals the way they are thinking. It helps me understand where they are. It helps me know what their prior knowledge is, what they are taking away, and how impactful or effective our teaching is with the kids. It is a measure of growth. They are fluid, and there isn't a right concept map. They evolve.
4) Concept maps fulfilled the center’s need for an assessment that did not require a substantial amount of time and did not take precious time away from their daily schedule. The Program Director shared:
We are with the students for three days, and our schedule keeps them busy from the moment they arrive to the moment they leave. Our center has a magical appeal to the students. They have activities and outdoor classes from breakfast until 9:00 PM. Finding time to add an evaluation instrument to the day has proved very challenging. Utilizing pre/post concept maps seems a perfect way to accurately evaluate knowledge and understanding gained at our center.
Conclusions
In a time when many schools have eliminated or curtailed field trips, teachers, schools, and school districts need to show that field trip content is linked to state or national standards and serves an educational purpose for the students. Results of this study suggest that concept maps can be used effectively to document changes in student knowledge meeting required teaching of state or national science standards as a result of a visit to a REEC and may contribute to improvement in program evaluations and future effectiveness of these centers. As stated by the REEC Program Director:
We need to be able to justify having a residential environmental education program versus doing the learning in the classroom. Those of us who have been teachers and have brought our students (to the REEC) know the significance of a visit to the center. But quite often, when you are trying to justify it to an administrator or a school that has never visited, they don't see the significance. We want to be able to prove to school administrators and center funders the impact of what is happening in those three days. A pretest/posttest kind of evaluation is powerful.
The present study was limited to a single residential environmental education center. Further research is needed involving student-created concept maps at other residential environmental education centers. Other nonformal science centers may benefit from the incorporation of student centered concept maps into their program evaluations.
Note: This study was originally presented at the New Perspectives in Science Education conference in March 2013.
References
Carleton-Hug, A., & Hug, J. (2010). Challenges and opportunities for evaluating
environmental education programs. Evaluation and Program Planning, 33(2), 159-164.
Christensen, L., Nielsen J., Rogers, C., & Volkov, B. (2005). Creative data collection in nonformal settings. New Directions for Evaluation, 2005(108), 73-79.
Coyle, K. (2005). Environmental Literacy in America. The National Environmental Education and Training Foundation. Washington, D.C.
Gall, M., Gall, J., & Borg, W. (2003). Educational research. Boston, MA: Pearson Education, Inc.
Gregg, M. & Leinhardt, G. (2002). Learning from the Birmingham Civil Rights Institute: Documenting teacher development. American Educational Research Journal, 39(2), 553-587.
McDuff, M. (2002). Needs assessment for participatory evaluation of environmental education programs. Applied Environmental Education and Communication, 1(1), 25-36.
Merriam, S. (2001). Qualitative research and case study applications in education. San Francisco: Jossey-Bass.
National Environmental Education Advisory Council (2005). Setting the standard, measuring results, celebrating successes: A report to Congress on the status of environmental education in the United States. Washington, DC: Author.
Electronic Journal of Science Education ejse.southwestern.edu Powell, R., Stern, M., & Ardoin, N. (2006). A sustainable evaluation framework and its
application. Applied Environmental Education and Communication, 5, 231-241. Quinn, H., Mintzes, J., & Laws, R. (2004). Successive concept mapping. Journal of College
Science Teaching. 33(3), 12-16.