Does Removing/Replacing Missing
Values Improve The Models'
Classification Performances?
Jozef Zurada, University of Louisville, USAABSTRACT
The paper explores the effect of removing/replacing missing values on the classification performance of several models. The original data set, which contains a relatively large number of missing values, comes from the credit scoring context. This data set was not used to build the models, but it was converted to five other data sets with missing values either removed or replaced using different techniques. The models were built and tested on the five data sets. Preliminary computer simulation showed that the models created and tested on the four data sets in which missing values were replaced exhibited significantly better predictive performance than the model built and tested on the data set with missing values removed.
Keywords: Classification Models; Credit Scoring Context; Missing Values Replacement/Removal; Improved Predictive Accuracy
INTRODUCTION
issing values for one or more attributes in large data sets are quite common. They can be a byproduct of data collection errors or incomplete customer responses, to name a few. Past research and multiple experimentations have shown that data reduction and transformation such as sampling, feature elimination, and value reduction such as binning or smoothing the values that each feature takes, may improve the prediction accuracy of the models and makes them simpler to interpret (Berry and Linoff, 2004; Frank and Witten, 2005; Giudici, 2003; Han and Kamber, 2001; Hand et al., 2001; Kantardzic, 2011; Larose, 2005; Olson and Shi, 2007; Pyle, 1999).
This paper examines the effect of removing and replacing missing values on the global classification performance of several models. The models examined are logistic regression (LR), neural networks (NN), support vector machines (SVM), k-nearest neighbor (kNN), and decision trees (DT). The areas under ROC charts are used as the criterion of the models' performances. The larger the areas, the better the models.
The original data set was drawn from the credit scoring context and contained 5,960 records and 13 variables, as well as significant number of missing values. The original data set was not used to build and test the models. However, from this data set, five other data sets were created. In the first data set, all records, which had at least one missing value for any variable, were removed. In addition, four other data sets were created by using different missing values replacement techniques. Initial computer simulation shows that the models built and tested on the data sets, with missing values replaced, perform significantly better than the model built and tested on the data set from which missing values were removed.
MISSING VALUES IMPUTATION METHODS
Modelers have to make assumptions about the missing data to select the best missing value replacement algorithm. For example, modelers often replace a missing value with the arithmetic average, median, mode or another measure of the central tendency of the attribute for the given class. These techniques assume that the
variables' data distributions follow a bell-shaped curve and are pretty straightforward, but they can significantly alter an attributes' sample distributions. Therefore, one should use these replacement techniques with caution and only when the effect on the distribution is minimal.
If a record contains a missing value, then that record is not used for modeling by LR, NNs, SVM, k-NN, and attribute reduction techniques. The only models which tolerate missing values quite well are DTs. They may actually create a separate split/branch on the variable's missing value. There are several strategies for handling missing values. The first one is to discard every record which contains at least one missing value. It is the desired approach when the data set is very large. The second one is to use some algorithm to replace missing values. The third technique analyzes the data to see if the missing values occur in only a few attributes. If those attributes are determined to have small prediction power, the attributes can be rejected from the analysis. The first two approaches have drawbacks. First, the substituted value is not a correct value, and second, rejecting all incomplete cases ignores useful information which still may be contained in the non-missing attributes. Replacing missing values, however, may be advantageous for smaller data sets as there are more records to build and test the models.
The approaches for dealing with missing values include:
eliminating all samples with missing values (possible with large data sets and small amount of data samples having missing values)
having the domain expert to plug in a probable value for a missing value based on the domain experience treating them as "do not care" values (it may significantly increase the number of artificial samples in the
data set)
applying automatic replacement
creating a predictive model to predict each of the missing values replacing all missing values with a single global constant
replacing all missing values with its feature mean, mode or median for the given class using tree imputation methods
In this paper, we chose to use the following four missing values imputation techniques offered by SAS Enterprise Miner software (www.sas.com). The replacement method, based on the mean for the given class, is the preferred one to use if the attribute values roughly follow a bell-shaped normal distribution. The method based on the median is recommended when one wants to impute missing values for attributes that have skewed distributions as well as for attributes measured on the ordinal scale. The distribution-based replacement is based on the random percentiles of the attribute's distribution. As the replacement of missing values is based on the probability distribution of the non-missing records, this method typically does not significantly change the distribution of the data. Finally, the fourth method is based on the tree imputation technique. Imputed values are estimated by analyzing each input attribute as a target and the remaining input attributes are used as predictors. Because the replacement value for each input attribute is based on the other input attributes, this imputation method may be more accurate than the mentioned four.
CHARACTERISTICS OF THE DATA SETS
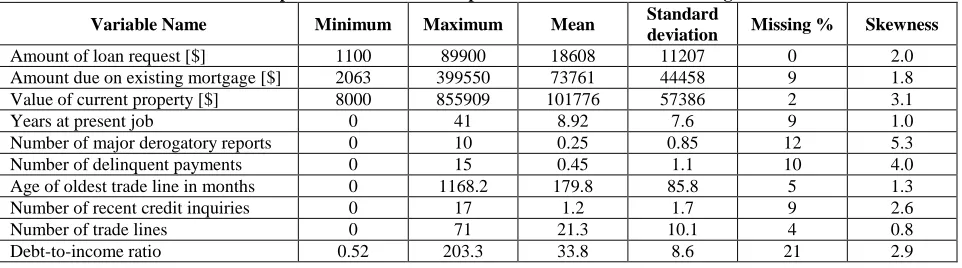
Table 1: The Descriptive Statistics for the Input Numeric Variables in the Original Data Set
Variable Name Minimum Maximum Mean Standard
deviation Missing % Skewness
Amount of loan request [$] 1100 89900 18608 11207 0 2.0
Amount due on existing mortgage [$] 2063 399550 73761 44458 9 1.8
Value of current property [$] 8000 855909 101776 57386 2 3.1
Years at present job 0 41 8.92 7.6 9 1.0
Number of major derogatory reports 0 10 0.25 0.85 12 5.3
Number of delinquent payments 0 15 0.45 1.1 10 4.0
Age of oldest trade line in months 0 1168.2 179.8 85.8 5 1.3
Number of recent credit inquiries 0 17 1.2 1.7 9 2.6
Number of trade lines 0 71 21.3 10.1 4 0.8
Debt-to-income ratio 0.52 203.3 33.8 8.6 21 2.9
Table2: The Statistics for the Nominal/Categorical Variables in the Original Data Set
Variable name Values taken Frequency Missing [%]
Reason for loan Debt consolidation Home improvement Missing 3928 1780 252 4 Job category Managerial Office Professional Other Sale Self-employed Missing 767 948 1276 2388 109 193 279 5 Loan status (Target variable) No Yes 4771 1189 0
The original data set was transformed. The first data set was created by removing all missing values. This operation led to a smaller and very unbalanced data set containing 3,364 records, representing 300 and 3,064 customers who defaulted upon the loan and paid off the loan, respectively. The ratio of bad loans to good loans was approximately 10:1 and it may closely reflect the real percentage of defaulters in an exemplary bank loan portfolio. The second, third, fourth, and fifth data sets were created by using the missing values replacement techniques described earlier in this paper; i.e., the mean, the median, distribution-based, and tree imputation, respectively. None of the four replacement techniques have significantly changed the distribution of the variables in the data sets used for analysis.
RESULTS FROM COMPUTER SIMULATION
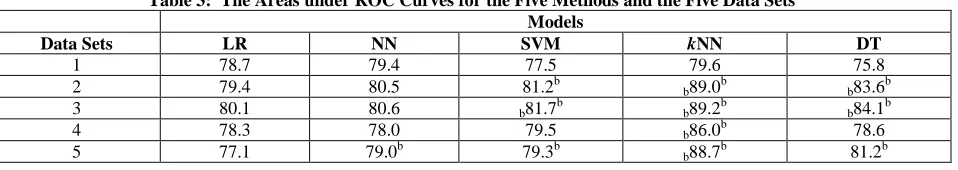
Table 3: The Areas under ROC Curves for the Five Methods and the Five Data Sets Models
Data Sets LR NN SVM kNN DT
1 78.7 79.4 77.5 79.6 75.8
2 79.4 80.5 81.2b b89.0b b83.6b
3 80.1 80.6 b81.7b b89.2b b84.1b
4 78.3 78.0 79.5 b86.0b 78.6
5 77.1 79.0b 79.3b
b88.7b 81.2b
The baselines are the LR model and data set 1. The superscript b indicates that the method to the right performs better than LR at α=0.05, and the subscript b indicates that the data set below performs better than data set 1 at α=0.05. Data sets are:
1 – missing values removed
2 –missing values replaced with the mean for the given class for the numeric variables and the mode for the categorical variables
3 –missing values replaced with the median for the given class for the numeric variables and the mode for the categorical variables
4 – missing values replaced by the distribution-based algorithm 5 – missing values replaced by the tree imputation method
In analyzing the results across the rows, one can see that for data set 1 there are no statistically significant differences in the performance of the models. For data sets 2 and 3, the SVM, kNN, and DT significantly outperform the LR model. For data set 4, only kNN outperforms LR, whereas for data set 5, all models are better than LR. Thus, tree imputation method appears to be the most effective as it improves the classification performance of all models compared to LR, whereas the distribution-based method produces the worst results. Looking at the results down the columns, one can notice that none of the five missing values replacement method improves the performance of the LR and NN models. However, the replacement techniques work quite well for SVM and DT, and exceptionally well for kNN, by improving their overall classification performances.
CONCLUSION
Computer simulation showed that replacing missing values significantly improves the overall classification performance of the SVM, kNN, and DT models when compared to LR. The tree imputation appears to be the most effective method, whereas the distribution-based method seems to be the worst. One needs to point out that data set 1, used as the baseline, has the 1:10 ratio of bad loans to good loans than the four other data sets. More studies on more data sets drawn from credit scoring context are recommended to examine the overall classification accuracy rates as well as the rates for "good" and "bad" loans at specific cut-off points.
AUTHOR INFORMATION
Jozef Zurada earned his M.S. degree in Electrical Engineering at the Gdansk University of Technology, Gdansk, Poland, in 1972; and Ph.D. degree in Computer Science and Engineering from the University of Louisville, Louisville, Kentucky, USA, in 1995. Currently, he is professor in the Department of Computer Information Systems in the College of Business at the University of Louisville. He teaches knowledge discovery in databases and infrastructure technologies courses. His research interests include applications of data mining methods for solving challenging business problems. E-mail: [email protected]
REFERENCES
3. Giudici, P. (2003). Applied Data Mining: Statistical Methods for Business and Industry. Wiley.
4. Han, J, and Kamber, M. (2001). Data Mining: Concepts and Techniques. Morgan Kaufmann Publishers. 5. Hand, D., Mannila, H., Smith, P. (2001). Principles of Data Mining. The MIT Press, Cambridge, MA. 6. Kantardzic, M. (2011). Data Mining: Concepts, Models, Methods, and Algorithms. IEEE Press/Wiley. 7. Larose, D.T., (2005). Discovering Knowledge in Data: An Introduction to Data Mining. Wiley. 8. Olson, D., and Shi, Y., (2007). Introduction to Business Data Mining. McGraw-Hill.
9. Pyle, D., (1999). Data Preparation for Data Mining. Morgan Kaufmann, San Francisco, CA. 10. www.sas.com – web site for Statistical Analysis System (SAS).