doi:10.5194/nhess-10-2507-2010
© Author(s) 2010. CC Attribution 3.0 License.
and Earth
System Sciences
Experimental study on the rheological behaviour of debris flow
A. Scotto di Santolo, A. M. Pellegrino, and A. Evangelista
Department of Hydraulic, Geotechnical and Environmental Engineering, University of Naples “Federico II”, Italy Received: 27 December 2009 – Revised: 29 August 2010 – Accepted: 30 August 2010 – Published: 7 December 2010
Abstract. A model able to describe all the processes
in-volved in a debris flow can be very complex owing to the sudden changing of the material that turns from solid into liquid state. The two phases of the phenomenon are analysed separately referring to soil mechanics procedures with regard to the trigger phase, and to an equivalent fluid for the post-failure phase. The present paper is devoted to show the exper-imental results carried out to evaluate the behaviour assumed by a pyroclastic-derived soil during the flow. A traditional fluid tool has been utilized: a standard rotational rheometer equipped with two different geometries. The soils tested be-long to deposits that cover the slopes of the Campania region, Italy, often affected by debris flows. The influence of solid concentrationCvand grain size distribution was tested: the
soils were destructurated, sieved and mixed with water start-ing from the in situ porosity. All material mixtures showed a non-Newtonian fluid behaviour with a yield stressτythat in-creases with a solid volumetric concentration and dein-creases for an increase of sand fraction. The experimental data were fitted with standard model for fluids. A simple relation be-tweenCvandτywas obtained. The yield stress seems to be a key parameter for describing and predicting the post-failure behaviour of debris flows. These results suggest that in the field a small change in solid fraction, due to rainfall, will cause a slight decrease of the static yield stress, readily in-ducing a rapid flow which will stop only when the dynamic yield stress is reached, namely on a much smoother slope. This can explain the in situ observed post-failure behaviour of debris flows, which are able to flow over very long dis-tances even on smooth slopes.
Correspondence to: A. Scotto di Santolo
1 Introduction
Debris flows represent serious hazards on the slopes of the North-western Campania region (southern Italy). Therefore, the evaluation of constitutive laws for the material involved represents a key requirement for the hazard mitigation. Tra-ditionally, debris flows have been regarded as homogeneous fluids and flow behaviour has been considered to be con-trolled by the properties of the “matrix”, a mixture of fine sediment and water in which coarse particles are dispersed (Costa and Williams, 1984; Johnson, 1984). Existing physi-cal theories to describe flow and depositional process of de-bris flows are mainly divided into theories which are based on the treatment of the material as one single phase (rheological approaches) (O’Brien and Julien, 1984; Phillips and Davies, 1991; Major and Pierson, 1992; Coussot and Piau, 1994) or as two or more phases (Coulomb mixture approaches) (Sav-age and Hutter, 1989; Iverson, 1997). The Coulomb mix-ture approach specifies distinct constitutive equations for the solid phase, the liquid phase and the interaction forces phase. Conversely, using a rheological approach, the bulk mixture behaviour can be characterised by a limited number of pa-rameters, relating shear stress and viscosity to shear rate. The present study focuses on the results obtained by means of a rheological point of view.
1.1 Debris flow rheology
20 1
Figure 1. 2
3
4
5
6
7
8
9
10
. 11
12
13
14
15
(1) Newtonian fluids behaviour;
(2) Shear thinning behaviour (Pseudoplastic fluids); (3) Shear thickening behaviour (Dilatant fluids); (4) Shear thinning yield stress fluids (viscoplastic fluids); (5) Bingham plastic fluids.
a) b)
(1) Newtonian fluids behaviour;
(2) Shear thinning behaviour (Pseudoplastic fluids); (3) Shear thickening behaviour (Dilatant fluids); (4) Shear thinning yield stress fluids (viscoplastic fluids); (5) Bingham plastic fluids.
a) b)
Fig. 1. (a) Flow curves; (b) Viscosity curves.
fluid. They are also called time-independent fluids and are subdivided into several groups (Fig. 1). Generally, the de-bris flow mixtures behave like viscoplastic fluids, as indi-cated in curve (4), Fig. 1. It is considered that, for such a fluid, an abrupt change in flow behaviour exists around a given shear stress value, the yield stressτy, which needs to be overcome before flow takes place. The viscoplastic char-acter of debris flow mixtures has often been reported in liter-ature (O’Brien and Julien, 1984, 1988; Phillips and Davies, 1991; Major and Pierson, 1992; Coussot and Piau, 1995; Contreras and Davies, 2000; Ancey and Jorrot, 2001; Schatz-mann, 2005; Kaitna et al., 2007). Phenomenological laws like the Bingham generalized model (or Herschel & Bulk-ley model) are usually used to describe the rheological be-haviour of such mixtures (Major and Pierson, 1992; Nguyen and Boger, 1992; Coussot, 1997). The mathematical expres-sion can be written as:
τ=τy+k· ˙γn (1)
In Eq. (1),τyis the yield stress,γ˙ is the shear rate,kis the consistent coefficient [Pa sn] andnis the pseudoplastic index. When the indexnis equal to the unity, the Eq. (1) becomes the Bingham model and the coefficientkbecomes the Bing-ham viscosityηB(curve (5) in Fig. 1).
2 Experimental setup and procedures
2.1 Rheometer apparatus
In order to ensure the validity of rheometrical measurements and to reduce the risk of misinterpretation, the rotational rheometer AR 2000ex (TA Instruments) equipped with two different geometry systems (parallel plates – PP, and vane rotor – VR) has been utilized (Fig. 2). The parallel plates geometry is composed of a lower stationary steel plate and an upper rotational one with a 4 mm diameter. The distance
between two plates (the gapH) must be at least ten times the
21
1
Figure 2
2
3
4
5
6
7
8
9
10
11
12
13
14
15
16
Ω
Ω
Ω
Ω
Fig. 2. The rotational rheometer AR 2000ex (TA Instruments) and
the two rheometrical system used: parallel plates and vane rotor system.
maximum particles diameter,dmax(Chhabra and Richardson,
1999). Because of the variability in the grain size distribution of the material, the gap has been fixed (Hequal to 1 mm) and the maximum diameter has been established according to the previous relation (dmax≤0.1 mm). The shear rate and the
shear stress are evaluated with the following equations:
˙
γR= ˙γ (R)=·R
H (2)
τ γ˙R= 3T
2π R3+ ˙
γR 2π R3·
dT
dγ˙R (3)
whereR is the upper plate radius, H is the gap, is the rotation velocity (rad/s) andT is the torque (Coussot, 1997). The vane rotor geometry consists of four thin blades ar-ranged at equal angles around a small cylindrical shaft: the blades radius is 14 mm and the blades height is 42 mm. It is immersed in the sample contained in a cylindrical cup with 15 mm in radius. The vane is rotated around its axis at a given rotational speed, and the torqueT is measured. Dur-ing the test the material is trapped in the blades and the shear is achieved around a fictitious cylinder within the mixture. The shear stress and shear rate are:
˙
γ= ·R1
R2−R1
(4)
τ= 3·T
2·π·R12·L (5)
whereR1andR2are, respectively, the blades radius and the
cup radius,Lis the material depth. The Eqs. (4) and (5) are usually applied when the ratio R1/R2 is close to the unity
1
Figure 3
2
3
4
5
6
7
8
9
10
11
12
13
14
Gulf of Naples
Gulf of Salerno
Volcanic Systems
Calcareous bedrock covered by pyroclastic materials
Bedrock covered by ashes pyroclastic materials Bedrock covered by ashes and pumices pyroclastic materials Bedrock on flysch
Somma - Vesuvio Island of Ischia Phlegrean Fields Roccamonfina
Piedmont Plans
Plans on pyroclastic Plans on Ignimbrite
B A C
Campania Gulf of Naples
Gulf of Salerno
Volcanic Systems
Calcareous bedrock covered by pyroclastic materials
Bedrock covered by ashes pyroclastic materials Bedrock covered by ashes and pumices pyroclastic materials Bedrock on flysch
Somma - Vesuvio Island of Ischia Phlegrean Fields Roccamonfina
Piedmont Plans
Plans on pyroclastic Plans on Ignimbrite
B A C Campania 0 10 20 30 40 50 60 70 80 90 100
0,000 0,001 0,010 0,100 1,000 10,000 100,000
Particle diameter d (mm)
P e rc e n t fi n e r (% ) Material A Material B Material C
Clay Silt Sand Gravel
a)
b)
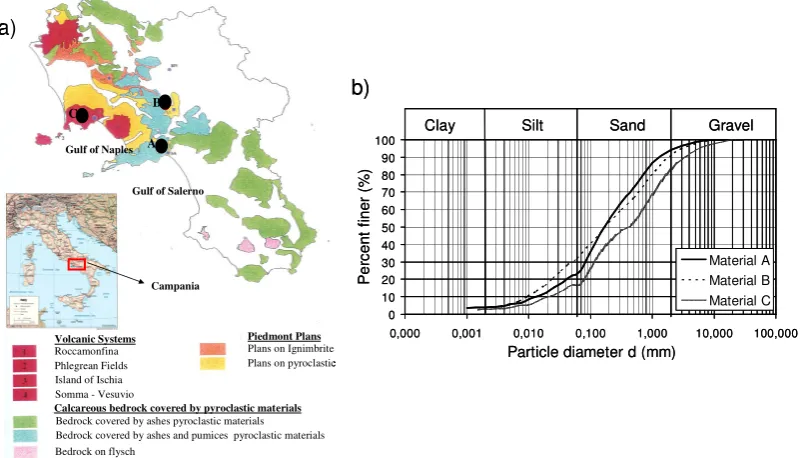
Fig. 3. (a) Location of the studied debris flows and distribution of the main deposits (Modified from di Gennaro et al., 1998); (b) Grain size
distribution of the tested debris flow materials.
2.2 Materials
The materials tested have been collected from the source area of three debris flows, which are originated in pyroclastic-derived terrains, occurred in Campania region (southern Italy), Fig. 3a. Material A has been sampled in Nocera, Salerno (event of March 2005); material B in Monteforte Ir-pino, Avellino (event of May 1998); material C in Astroni, Naples (event of December 2005). The soil type derived from the most recent deposits produced by the volcanic activ-ity of mount Somma/Vesuvius for materials A and B and by the volcanic activity of the Phlegrean Fields for material C. The grain size distributions of the undisturbed samples are reported in Fig. 3b. Soil A and soil B are sandy silt with a small clay fraction, while soil C is gravely silty sand. The clay part is slightly plastic though only in the Vesuvian de-posits. The gravel part mainly consists of pumices and, to a minor extent, of scoriae and lapilli. The particles are mainly siliceous. Their structure is amorphous and porous; there is a double porosity system inter- and intra-particle (the latter not connected to the surface). Porosity exceeds 70% for Vesu-vian deposits while it is lower for the Phlegrean deposits. The cover is partially saturated; the level of saturation varies according to weather conditions. Mean physical properties are reported in Table 1 (GSis the specific gravity of soil
par-ticles,γd andγ are the dry and total weight of soil per unit volume, respectively,nis the porosity andSr is the degree of saturation). The geotechnical properties of such materials are well documented in literature (e.g. Scotto di Santolo, 2000a, b; Ruopolo, 2006; Papa, 2007; Picarelli et al., 2007). The nature of the substratum underlying the soil is volcanic for material C, and carbonatic for materials A and B (Fig. 3a).
2.3 Laboratory procedures
The analysed debris flow mixtures have been tested in rate-controlled mode at a constant temperature (20±0.5◦C). The flow curves (τ,γ )˙ have been determined by applying a suc-cessive shear rate level, ranging from 0.014 to 1400 1/s.
For each level of shear rate the duration of the experi-ment has been imposed long enough to obtain a simple shear steady regime. In order to certify the reproducibility of the experiment, each test has been repeated at least three times and the averaged values of the experimental results have been considered. Due to the geometry dimension of the used rheometer, only the flow curves of fine material with grain sizes smaller than 0.1 mm have been derived. The experi-ments have been carried out with mixtures of different water content. The solid volumetric concentrationCv, i.e., the ratio
of the amount of solids to the total mixture, has been consid-ered. The total solid volumetric concentrationCvis defined
as:
Cv=
Vs
Vs+Vw
(6)
whereVwandVsare, respectively, the volumes of water and
solid in the sample. In order to consider a significant range of the sediment concentration for the material tested, mix-tures withCv changing from 20% to 40% have been
Table 1. Main physical properties of the tested debris flow materials.
Debris flow Substratum Material GS γd γ n Sr
(1) (kN/m3) (kN/m3) (1) (1)
Nocera Carbonatic A 2.62 9.08 11.35 0.66 0.35
Monteforte Irpino Carbonatic B 2.57 7.11 12.11 0.71 0.71
Astroni Pyroclastic C 2.54 8.99 9.84 0.67 0.24
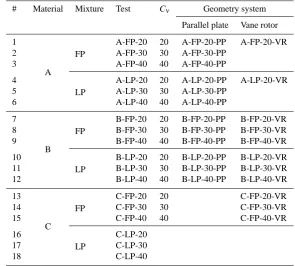
Table 2. Experimental program.
# Material Mixture Test Cv Geometry system
Parallel plate Vane rotor
1
A FP
A-FP-20 20 A-FP-20-PP A-FP-20-VR
2 A-FP-30 30 A-FP-30-PP
3 A-FP-40 40 A-FP-40-PP
4
LP
A-LP-20 20 A-LP-20-PP A-LP-20-VR
5 A-LP-30 30 A-LP-30-PP
6 A-LP-40 40 A-LP-40-PP
7
B
FP
B-FP-20 20 B-FP-20-PP B-FP-20-VR
8 B-FP-30 30 B-FP-30-PP B-FP-30-VR
9 B-FP-40 40 B-FP-40-PP B-FP-40-VR
10
LP
B-LP-20 20 B-LP-20-PP B-LP-20-VR
11 B-LP-30 30 B-LP-30-PP B-LP-30-VR
12 B-LP-40 40 B-LP-40-PP B-LP-40-VR
13
C
FP
C-FP-20 20 C-FP-20-VR
14 C-FP-30 30 C-FP-30-VR
15 C-FP-40 40 C-FP-40-VR
16
LP
C-LP-20
17 C-LP-30
18 C-LP-40
(FP maximum diameter 0.1 mm; LP maximum diameter 0.5 mm;−= not investigated.)
fine (FP) and coarse (LP) in the following. The experimental programme performed is shown in Table 2.
3 Experimental results
3.1 Preliminary evaluations
The choice of the measurement geometry depends on the expected rheological properties of the mixture. Because the rheological properties are unknown a priori, preliminary measurements are absolutely necessary.
Disturbing effects due to material properties and rheomet-rical geometry features could lead to erroneous data inter-pretation (Major and Pierson, 1992; Coussot and Piau, 1995; Coussot, 1997; Kaitna et al., 2007). Depending on the ge-ometry apparatus, shear conditions (related to samples vol-ume) and disturbing effects (related to geometry features and fluid types) change in a different way. Data obtained by
dif-ferent facilities should be in agreement only if the material tested has been homogeneously sheared as predicted by the-ory (Major and Pierson, 1992; Coussot, 1997).
23 1
2
3
Figure 4 4
0 0,5 1 1,5 2 2,5 3
0 20 40 60 80 100
S
h
ea
r
st
re
ss
(
P
a)
Shear rate (1/s) Parallel Plates
Vane Rotor
0,001 0,01 0,1 1
0 20 40 60 80 100
V
is
co
si
ty
(
P
a
s)
Shear rate (1/s)
Parallel Plates Vane Rotor a)
b)
b)
23 1
2
3
Figure 4 4
0 0,5 1 1,5 2
0 20 40 60 80 100
S
h
ea
r
st
re
ss
(
P
a)
Shear rate (1/s) Vane Rotor
0,001 0,01 0,1 1
0 20 40 60 80 100
V
is
co
si
ty
(
P
a
s)
Shear rate (1/s)
Parallel Plates Vane Rotor b)
b)
Fig. 4. Liquid paraffin on sale. Comparison of parallel plates results
and vane rotor results.
For a Non-Newtonian fluid, like the mixtures tested, quan-titative and qualitative differences have been observed. In Fig. 5 for material A withCvequal to 20%, the flow curves
obtained with the two geometric facilities have been re-ported. At a small shear rate, a minimum in the flow curves attained by the tests carried out using the vane rotor system has been noted: the shear stress decreases with shear rate, followed by a subsequent increase at larger shear rate values. Such behaviour for concentrated suspensions, with a mini-mum to low shear rate, has been reported by several authors (Nguyen and Boger, 1985; Alderman et al., 1991; Major and Pierson, 1992; Pignon et al., 1996; Coussot, 1997; Ancey and Jorrot, 2001; Kaitna et al., 2007) and only the increas-ing part of the flow curves has been considered. Moreover, the vane rotor response is higher than the parallel plates re-sponse after a shear rate value equal to 50 1/s. Regardless of the solid volumetric concentrations considered, after this value of shear rate the mixtures analysed behave like a Non-Newtonian fluid. In the following, only these experimental results have been analysed.
Probably, some disturbing effects have occurred during the tests like the changing of the material free surface, edge/crack effects, heterogeneities in particle distribution (particle settling and migration due to particle inertia and secondary flow) and the phenomenon of wall slip. The oc-currence of some disturbing effects has been evaluated. In static experiments gravity forces are in competition with the Brownian forces. To estimate the sedimentation of the sam-ples of spherical particles, the ratio between gravity (set-tling) and Brownian forces (thermal) should be greater than 1 (Macosko, 1994):
0,01 0,1 1 10 100
0 200 400 600 800
Shear stress
(Pa)
Shear rate (1/s)
Parallel Plate Vane rotor
Critical Shear rate Yield Stress
0,01 0,1 1 10
0 20 40 60 80 100
Shear s
tress
(Pa)
Shear rate (1/s)
Parallel Plate Vane rotor
Fig. 5. Material A,Cv=20%. Comparison between the
experi-mental results obtained with the parallel plates and the vane rotor system.
gravity·force Brownian·force=
(ρd−ρc)·g·a3
kB·T /a
(7) whereρdandρcare the densities of the disperse and
contin-uous phase,gis the acceleration of gravity,a is the particle radius,kBis the Boltzmann’s constant,T is the absolute
tem-perature.
As shown by Larson (1999) sedimentation certainly oc-curred for1ρ, difference between the densities of the dis-perseρdand the continuous phaseρc, equal to 103kg m−3
and particles or aggregates larger than 1 µm radius. For our mixtures these differences are equal to 1600; the experimen-tal flow condition should be adjusted so that during the ex-perimental time the sedimentation does not play an impor-tant role. It is possible to estimate the influence of settling through the calculation of the experimental timetexprequired
for a single sphere of radiusato migrate over a lengthl(lis equal toH, the gap height) as in the following:
texp=
9 2·
ηc·l
1ρ·g·a2 (8)
whereηcis the viscosity of the continuous phase (for water
10−3Pa s),1ρis the difference between the densities of the disperseρdand the continuous phaseρc,gis the acceleration
Particle inertia can also influence the results of experi-ments. With the particle Reynolds number ReP an estimation of the inertial effects is possible:
ReP=ρc· ˙γ·a 2
ηc
(9) In this equationγ˙ andηcare the shear rate and the viscosity
of the continuous phase, respectively. For a maximum diam-eter used (radiusaequal to 0.05 mm and 0.25 mm), and for a shear rate equal to 50 1/s particle inertia occurred because the ReP is 0.125 and 3.125 greater than 10−1(Macosko, 1994).
In the following, due to the presence of these phenomena, the flow curves for the shear rate more than 50 1/s have been shown and interpreted.
3.2 Experimental results and model fitting
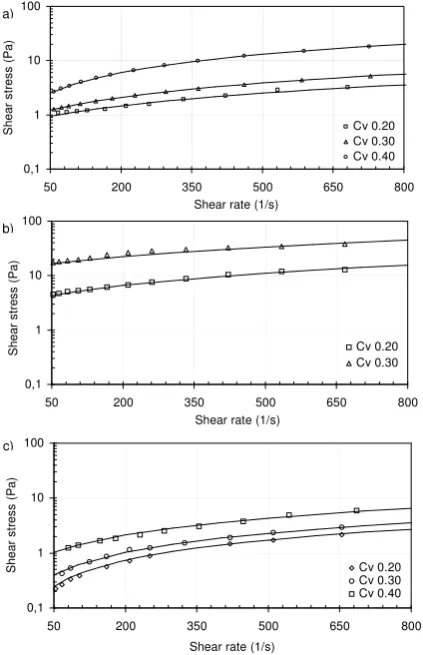
The flow curves for each analysed material have been re-ported in Fig. 6. It is noted that all the investigated debris flow mixtures behave like a non-Newtonian fluid and, in par-ticular, like yield stress fluids: shear stress non-linearly in-creases with the increase of shear rate after a yield stress that represents the value ofτ required to initiate the flow (value ofτ asγ˙ goes to zero).
The influence of the solid volumetric concentrationCvon
the rheological behaviour of fine debris flow material mix-tures tested has been evaluated. Proportionally higher values of shear stress with the increasing of the solid volumetric concentration have been noted. Moreover, at equal solid vol-umetric concentration, the shear stresses of material B are higher than materials A and C. The rheological parameters of C mixtures are the lowest due to the different volcanic particle nature (Phelegrean Field) and the higher grain size (Fig. 3b).
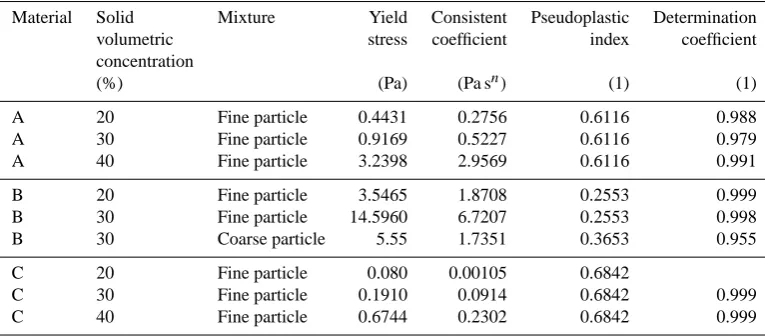
The best fitting model of the experimental data is the Bing-ham generalized (Eq. 1). The theoretical flow curves are re-ported as a solid line in Fig. 6. Table 3 shows the relative rheological parameters. The obtained yield stressτy is plot-ted versus the solid volumetric concentration Cv in Fig. 7.
It can be observed that the yield stressτy exponentially in-creases with the increase of solid volumetric concentration Cv. According to some previous study (O’Brien and Julien,
1984, 1988; Phillips and Davies, 1991; Major and Pierson, 1992; Coussot and Piau, 1995; Coussot, 1997; Kaitna et al., 2007), the following relation can be used:
τy=α·eβ·Cv (10)
whereαandβ are material parameters. Their values, for all the tested material mixtures, have been reported in Table 4.
In order to evaluate the influence of larger particles, mix-tures with the same solid volumetric concentration and with a maximum diameter of 0.5 mm were tested using a vane ro-tor. Figure 8 shows, for instance, the comparison between fine and coarse particle mixtures of the materials B for a solid volumetric concentration equal to 30%. A decrease of
25 1
Figure 6 2
0,1 1 10 100
50 200 350 500 650 800
Shear rate (1/s)
S
h
e
a
r
s
tr
e
s
s
(
P
a
)
Cv 0.20 Cv 0.30 Cv 0.40
0,1 1 10 100
50 200 350 500 650 800
Shear rate (1/s)
S
h
e
a
r
s
tr
e
s
s
(
P
a
)
Cv 0.20 Cv 0.30
0,1 1 10 100
50 200 350 500 650 800
Shear rate (1/s)
S
h
e
a
r
s
tr
e
s
s
(
P
a
)
Cv 0.20 Cv 0.30 Cv 0.40 a)
b)
c)
Fig. 6. Experimental data and theoretical flow curves at different
volumetric concentrationCv: (a) material A; (b) material B; (c)
ma-terial C.
1
Figure 7 2
3
Figure 8 4
5
1 10 100
50 200 350 500 650 800
sh
ea
r
st
re
ss
(
P
a)
shear rate (1/s)
Fine particle mixture Cvf 0.3, CvL 0.0 Large particle mixture Cvf 0.2, CvL 0.1
0,01 0,1 1 10 100
10 100
Solid volumetric concentration (%)
Y
ie
ld
s
tr
e
s
s
(
P
a
)
Material A Material B Material C
20 30 40
Fig. 7. Yield stressτyvs. solid volumetric concentrationCv.
yield stress is observed. This reduction may be justified by a decrement of finer content, the yield stress tends to disappear due to a reduction of the fine fraction (clean water).
This behaviour is in agreement with the experimental re-sults of Ancey and Jorrot (2001) on coarse particles within a clay dispersion with a parallel plates system. When the large particle fraction is small compared to the amount of fine particle fraction, the colloidal fine fraction determines the rheological features of the mixture.
Table 3. Bingham generalized model parameters.
Material Solid Mixture Yield Consistent Pseudoplastic Determination
volumetric stress coefficient index coefficient
concentration
(%) (Pa) (Pa sn) (1) (1)
A 20 Fine particle 0.4431 0.2756 0.6116 0.988
A 30 Fine particle 0.9169 0.5227 0.6116 0.979
A 40 Fine particle 3.2398 2.9569 0.6116 0.991
B 20 Fine particle 3.5465 1.8708 0.2553 0.999
B 30 Fine particle 14.5960 6.7207 0.2553 0.998
B 30 Coarse particle 5.55 1.7351 0.3653 0.955
C 20 Fine particle 0.080 0.00105 0.6842
C 30 Fine particle 0.1910 0.0914 0.6842 0.999
C 40 Fine particle 0.6744 0.2302 0.6842 0.999
26 1
Figure 7 2
3 Figure 8 4
5
1 10 100
50 200 350 500 650 800
sh
ea
r
st
re
ss
(
P
a)
shear rate (1/s)
Fine particle mixture Cvf 0.3, CvL 0.0 Large particle mixture Cvf 0.2, CvL 0.1 0,01
0,1 1 10 100
10 100
Solid volumetric concentration (%)
Y
ie
ld
s
tr
e
s
s
(
P
a
)
Material A Material B Material C
20 30 40
Fig. 8. Material B: effect of maximum particle diameter forCv
equal to 30%.
Instead, as observed in different studies led using non-conventional rheometers on material mixtures, rheological properties are altered by addiction of larger particles (up to several centimeters) to the viscous fluid (Coussot and Piau, 1995; Contreras and Davies, 2000; Schatzmann 2005). Thus, rheological parameters determined by debris flow material of limited grain size with a conventional rheometer do not rep-resent the bulk rheological behaviour of the complete natu-ral material. Therefore, further tests are necessary on mix-tures including sand and gravel fraction according to the nat-ural grain size distribution. This activity is being undertaken through the development of a new type of equipment that is presently being tested.
4 Conclusions
In order to evaluate the rheological behaviour of debris-flow material, laboratory tests involving soils taken in the source areas of three debris flows occurred in Campania region (southern Italy) were carried out. Mixtures with varying con-centration of fine sediment with maximum diameter less than 0.1 mm (fine particle mixture) and less than 0.5 mm (coarse
Table 4. Material parameters.
Material α β
A 0.2464 0.1215
B 0.1333 0.1909
C 0.0089 0.1066
particle mixtures), and distilled water were prepared. Such mixtures were investigated in a standard rheometer with two different geometries, the parallel plates system and the vane rotor system, in order to distinguish disturbing effects. The vane geometry seems to be an appropriate rheometrical tool for quantitative evaluation of the rheological behaviour of de-bris flow materials. Instead, by using the parallel plates sys-tem, only some qualitative ideas about their behaviour can be obtained. The comparison between the results of the two ge-ometry configurations allows checking the range of shear rate where there are no disturbing effects and misleading evalua-tions. In this range of shear rate all the tested debris flow mix-tures behave like a non-Newtonian fluid with a yield stress τythat increases with solid volumetric concentrationCvand
decreases for sand fraction increase. The experimental data were fitted with the theoretical Bingham generalized model, in the range of the evaluated shear rate. A simple relation betweenCvandτywas obtained.
These results suggest that in the field a small change in solid fraction, due to rainfall, will cause a slight decrease of the yield stress, inducing a flow rapidly reaching a shear rate larger than the critical shear rate associated with a rapid flow. Then, the flow will stop only when the material reaches a much smoother slope. This might explain the in situ ob-served post-failure behaviour of debris flows, which are able to flow over very long distances even over smooth slopes.
the bulk rheological behaviour of the complete natural mate-rial. Further tests are necessary on mixtures including sand and gravel fraction reflecting the natural grain size distribu-tion. This activity is being undertaken through the develop-ment of a new equipdevelop-ment under test. The yield stress seems to be a key parameter for describing and predicting the post-failure behaviour of debris flows, but further experimental validation is required.
Acknowledgements. We thank Renzo Pepi for assisting in carrying
out rheometer tests at the Dept. of Chemical Science and Technol-ogy and Biosystems, University of Siena and the TA Instruments for having lent the Rheometer AR 2000EX.
Edited by: G. G. R. Iovine
Reviewed by: A. Bartosik and two anonymous referees
References
Alderman, N. J., Meeten, G. H., and Sherwood, J. D.: Vane rheom-etry of bentonite gels, J. Non-Newton. Fluid. 39, 291–310, 1991. Ancey, C. and Jorrot, H.: Yield stress for particle suspensions
within a clay dispersion, J. Rheol., 45(2), 297–319, 2001. Bagnold, R. A.: Experiment on a gravity-free dispersion of large
solid sphere in a Newtonian fluid under shear, Proc. of The Royal Society London, Series A, 49–63, 1954.
Chhabra, R. P. and Richardson, J. F.: Non-Newtonian Flow in the Process Industries, Butterworth-Heinemann, Oxford, 436 pp., 1999.
Contreras, S. M. and Davies, T. H. R.: Coarse-Grained Debris Flows, Hysteresis and Time-Dependent Rheology, J. Hydraul. Eng.-Asce, 126, 938–941, 2000.
Costa, J. E. and Williams, G. P.: Debris flow dynamics (videotape), US Geological Survey Open file 84–606, 22 min, available at: http://www.pubs.usgs.gov/of/1984/ofr84-606/, 1984.
Coussot, P. and Piau, J. M.: On the behaviour of fine mud suspen-sions, Rheol. Acta, 33, 175–184, 1994.
Coussot, P. and Piau, J. M.: A large-scale field cylinder rheometer for the study of the rheology of natural coarse suspensions, J. Rheol., 39(1), 105–123, 1995.
Coussot, P.: Mudflow Rheology and Dynamics, IAHR Monograph Series, A. A. Balkema, Rotterdam, 1997.
di Gennaro, A., Terribile, F., Basile, A., Aronne, G., Buonanno, M., De Mascellis, R., and Vingiani, S.: I suoli delle aree di crisi di Quindici e Sarno: propriet`a e comportamenti in relazione ai fenomeni franosi, 2◦Rapporto informativo dell’Unit`a Operativa 4.21N del C.N.R. – G.N.D.C.I., L’instabilit`a delle coltri piroclas-tiche delle dorsali carbonati che in Campania, Primi risulatati di uno studio interdisciplinare, 1998.
Iverson, R. M.: The physic of debris flow, Rev. Geophys., 35, 245– 296, 1997.
Johnson, A. M.: Debris flow, Topics in Slope Instability, edited by: Brunsdenm, D. and Prior, D. B., Wiley, New York, 257–361, 1984.
Kaitna, R., Rickenmann, D., and Schatzmann, M.: Experimen-tal study on rheological behaviour of debris flow material, Acta Geotech., 2, 71–85, 2007.
Larson, R. G.: The Structure and Rheology of Complex Fluids, Ox-ford Univ. Press, New York, 1999.
Major, J. J. and Pierson, T. C.: Debris flow rheology: experimen-tal analysis of fine – grained slurries, Water Resour. Res., 28(3), 841–857, 1992.
Macosko, C. W.: Rheology. Principles, Measurements and Appli-cations, Wiley-VCH, Inc., 1994.
Nguyen, Q. D. and Boger, D. V.: Direct yield stress measurement with the vane method, J. Rheol., 29, 335–347, 1985.
Nguyen, Q. D. and Boger, D. V.: Measuring the flow properties of yield stress fluids, Annu. Rev. Fluid Mech., 24, 47–88, 1992. O’Brien, J. S. and Julien, P. Y.: Physical properties and mechanics
of hyperconcentrated sediment flow: Proc. of the Specialty Con-ference on Delineation of landslide, flash flood and debris flow hazard in Utah, Utah Water Research Laboratory, General Series, UWRL/G-85/03, 260–278, 1984.
O’Brien, J. S. and Julien, P. Y.: Laboratory analysis on mudflow properties, J. Hydraul. Eng.-Asce, 144, 877–887, 1988. Papa, R.: Indagine sperimentale di una copertura piroclastica di un
versante della Campania, PhD thesis, University of Naples “Fed-erico II”, 2007.
Phillips, C. J. and Davies, T. R. H.: Determining rheological pa-rameters of debris flow material, Geomorphology, 4, 573–587, 1991.
Picarelli, L., Evangelista, A., Rolandi, G., Paone, A., Nicotera, M. V., Olivares, L., Scotto di Santolo, A., Lampitiello, S., and Rolandi, M.: Mechanical properties of soils in Campania Re-gion. Proc. Int. Int. Workshop on Characterisation & Engineer-ing Properties of Natural Soils, edited by: Tan, Phoon, Hight and Leroueil, Singapore, 29 November–1 December 2006, Taylor & Francis Group, London, 4, 2331–2383, 2007.
Pignon, F., Magnin, A., and Piau, J. M.: Thixotropic colloidal sus-pension and flow curve with a minimum: identification of flow regimes and rheometric consequence, J. Rheol., 40, 573–587, 1996.
Ruopolo, S.: Analisi dei fenomeni franosi nella coltre piroclastica non satura del cratere degli Astroni, Graduate thesis, Department of Geotechnical Engineering, University of Naples “Federico II”, 2006.
Savage, S. B. and Hutter, K.: The motion of a finite mass of granular material down a rough incline, J. Fluid Mech., 199, 177–215, 1989.
Schatzmann, M.: Rheometry of large particle fluids and debris flows, PhD Dissertation No 16093, ETH, Z¨urich, Switzerland, 2005.
Scotto di Santolo, A.: Analisi geotecnica dei fenomeni franosi nelle coltri piroclastiche della provincia di Napoli, PhD thesis, Univer-sity of Naples “Federico II” and Rome “La Sapienza”, 2000a. Scotto di Santolo, A.: Analysis of a steep slope in unsaturated
soils. Proc. Asian Conference on Unsaturated Soils, Singapore, Balkema, Rotterdam, 569–574, 2000b.
Scotto di Santolo, A. and Evangelista, A.: Some observations on the prediction of the dynamic parameters of debris flows in deposits in the Campania region of Italy. Int., J. Nat. Hazards, 50, 605– 622, 2009.