www.nat-hazards-earth-syst-sci.net/10/1759/2010/ doi:10.5194/nhess-10-1759-2010
© Author(s) 2010. CC Attribution 3.0 License.
and Earth
System Sciences
The GITEWS ocean bottom sensor packages
O. Boebel1, M. Busack2, E. R. Flueh3, V. Gouretski1,*, H. Rohr2, A. Macrander1, A. Krabbenhoeft3, M. Motz4, and T. Radtke4
1Alfred Wegener Institute for Polar and Marine Research, Bussestr. 24, 27570 Bremerhaven, Germany 2OPTIMARE Sensorsysteme AG, Am Luneort 15a, 27572 Bremerhaven, Germany
3IFM-GEOMAR, Leibniz Institute for Marine Sciences, Wischhofstr. 1–3, 24148 Kiel, Germany 4develogic GmbH, Eiffestr. 598, 20537 Hamburg, Germany
*now at: Institut f¨ur Meereskunde, Bundesstr. 53, 20146 Hamburg, Germany
Received: 7 April 2010 – Revised: 19 July 2010 – Accepted: 28 July 2010 – Published: 31 August 2010
Abstract. The German-Indonesian Tsunami Early Warn-ing System (GITEWS) aims at reducWarn-ing the risks posed by events such as the 26 December 2004 Indian Ocean tsunami. To minimize the lead time for tsunami alerts, to avoid false alarms, and to accurately predict tsunami wave heights, real-time observations of ocean bottom pressure from the deep ocean are required. As part of the GITEWS infrastructure, the parallel development of two ocean bottom sensor pack-ages, PACT (Pressure based Acoustically Coupled Tsuname-ter) and OBU (Ocean Bottom Unit), was initiated. The sensor package requirements included bidirectional acous-tic links between the bottom sensor packages and the host-ing surface buoys, which are moored nearby. Furthermore, compatibility between these sensor systems and the overall GITEWS data-flow structure and command hierarchy was mandatory. While PACT aims at providing highly reliable, long term bottom pressure data only, OBU is based on ocean bottom seismometers to concurrently record sea-floor mo-tion, necessitating highest data rates. This paper presents the technical design of PACT, OBU and the HydroAcoustic Mo-dem (HAM.node) which is used by both systems, along with first results from instrument deployments off Indonesia.
Correspondence to: O. Boebel
1 Introduction
After the 26 December 2004 Indian Ocean tsunami, the de-velopment of the German-Indonesian Tsunami Early Warn-ing System was initiated (Rudloff et al., 2009). To provide tsunami alerts as quickly and precisely as possible, GITEWS pursues a multi-sensor approach in combination with a high resolution, predictive modelling component. Arguably, the fastest data channel is provided by land-based seismome-ters (Hanka et al., 2010) and GPS instruments, which mea-sure horizontal and vertical tectonic movements from which (earthquake) source models are derived. These, in turn, are used to select pre-calculated numerical ocean models, which provide detailed tsunami inundation predictions. However, not every earthquake causes a tsunami, nor is every tsunami caused by an earthquake. To improve quantitative inunda-tion predicinunda-tions and to also protect against tsunamis caused by landslides, direct oceanic sea-level measurements offer a second in-situ data channel (faster than 10 min), though at slower response times than achieved by the land-based in-struments (<5 min). Overall, GITEWS aims at providing re-liable warning bulletins within at least 10 min of the earth-quake (Behrens et al., 2010).
The provision of such infrastructure is the task of the GITEWS work package 2000 “Ocean Instrumentation”1. It
1The GITEWS work package “Ocean instrumentation”
comprises the following sub-work packages relevant to the projects described herein: “Coordination” (Konsortium Deutsche
Meeresforschung, KDM); “GPS surface buoy” (Deutsches
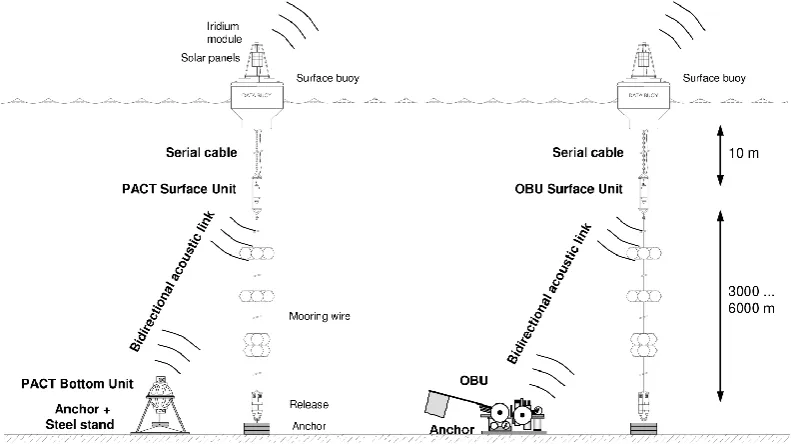
Fig. 1. Sketch of the PACT (left) and OBU (right) bottom sensor packages together with their hosting surface buoy moorings. Note that
figure elements are not to scale.
aims for data reliability and redundancy by deploying a suite of instruments based on quite diverse measurement tech-niques, which – amongst other parameters – capture the sea-level both at the coast on islands off Indonesia (tide gauges), and offshore in the deep ocean using bottom pressure gauges and seismic data.
Two independent projects have been commissioned in GITEWS to provide in-situ, real-time data from the sea-floor: PACT, a custom designed, highly integrated and cost-efficient bottom sensor package collecting bottom pressure data, and OBU, which collects bottom pressure and seismic data employing off-the-shelf instruments which are mechan-ically integrated into a single platform.
Both PACT and OBU represent the far outpost of the GITEWS data acquisition system. Designed as autonomous, free-fall landers, these systems’ bottom units (BU) are placed on the sea-floor in the immediate vicinity of host-ing surface buoys (Fig. 1), which are provided by the Geo-ForschungsZentrum Potsdam, GFZ (Sch¨one et al., 2008, 2010). A bidirectional communication channel is established between each BU and its hosting buoy by means of a pair of hydroacoustic modems. For PACT and OBU, the hosting surface buoys serve as data relay stations, providing a satel-lite communication link to the GITEWS Decision Support System (DSS) in the Early Warning and Mitigation Centre (EWMC) in Jakarta. With the GFZ surface buoys being also the host to multiple additional sensors (GPS, weather, buoy acceleration) and systems (energy management, communica-tion links), PACT and OBU data streams had to be integrated with the overall data flow and control architecture as imple-mented on the surface buoy’s onboard computer.
GITEWS operates under the presumption that in most in-stances, the land-based seismic array will provide the first indication of a possible tsunami. Rather than wait for a BU to automatically detect the tsunami wave, GITEWS priori-tizes a top-down approach as soon as any sensor indicates an anomaly. In this case, all available relevant sensors (or sen-sor groups) would be toggled to temporally high-resolution
capturing tsunami mode via a single remote command from
the EWMC. This switching of temporal sensor resolution be-tween a low capturing normal mode (active most of the time) and a high capturing tsunami mode is a necessary conse-quence of the energetic constraints of autonomously oper-ating off-shore instrumentation.
Unavoidably, each entering of a capturing tsunami mode, results in a competition of the various sensors for energy and communication bandwidth, which requires careful bal-ancing of available resources. These external requirements necessitated the implementation of complex, hierarchical communication protocols, which, in the projects described herein, are implemented through specific software modules, PACT-daemon (pactd) and OBU-daemon (obud), respec-tively. Hence, the PACT and OBU systems comprise the fol-lowing components:
– Bottom unit (BU): data acquisition, automated detec-tion of pressure anomalies, acoustic telemetry of data telegrams, acoustic reception of commands;
– Surface unit (SU): acoustic reception and buffering of telegrams, acoustic telemetry of commands;
Decision Support System (DSS)
Integration platform Tsunami Service Bus (TSB)
Commands via Sensor Planning Service
Commands via Web Services Descript. Language
BU-controller composes message and submits message to BU-modem
BU-modem composes telegram, splits telegram into packets, and transmits packets
SU-modem receives packets, reconstructs telegram and informs PACT-daemon of telegram availability
PACT-daemonretrieves message, saves message in allocated directory and informs buoy-demon of message availability or tsunami alert
Buoy-daemon arranges for transfer of message to Upload Area (FTP)
PACT-Postprocessor recalculates sea level heights and anomalies (time correction, barometric correction,
recalculate anomalies)
hydroacoustic transmission with handshake
underwater cable RS 232 with hardware handshake
IP based point to point communication RS 232 with hardware handshake
Messages via Joint Management System(JMS)
Messages via Sensor Alert / Web Notification Serv.
Command and Control Demon (CoCod) commands the buoy-daemon
Satellite Link, TCP/IP Satellite Link, TCP/IP
P
ACT
-BU
P
AC
T
-SU
H
ost
-buo
y
c
om
put
er
EW
M
C
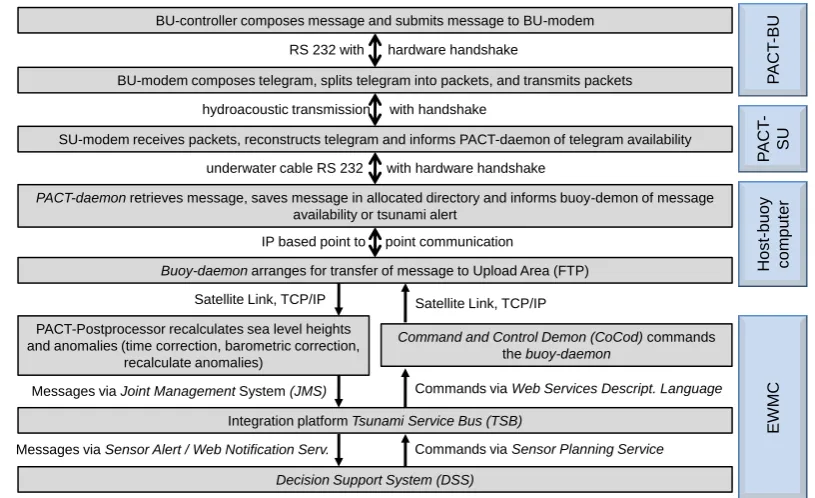
Fig. 2. Schematic of data flow of PACT system. Messages are transferred top-down, i.e. originate at the PACT-BU (top level) and terminate
at the data support system (DSS) of the tsunami early warning centre (TEWC). Commands may be issued in the TEWC and are transferred bottom-up to the PACT-BU, where they might toggle the BU’s state. All communication links are secured via handshake protocols.
Additional software and hardware modules, developed inde-pendently of this workpackage, complete the data transfer to the EWMC and the data management, display and evaluation there (Fleischer et al., 2010). A similar architecture applies for the return route, i.e. the transfer of commands issued at the EWMC to the BU (Fig. 2).
At the time of initiation of these projects, three issues were identified as most critical to a successful integration of ocean bottom sensors into the GITEWS sensor system: 1) The availability of an energetically efficient hydroacous-tic modem that allows long distance and/or high data rate communication; 2) The implementation of an enduring elec-tromechanical integration of the surface modem in the sur-face buoy mooring, and 3) the unknown effect of the ambient soundscape including mooring induced noise and rain on the success rate of acoustic transmissions, particularly from the bottom to the surface modem. Possible problems with data acquisition and instrument deployment and recovery were initially thought to be less likely, as instrument designs were based on existing hardware or components, but turned out as (remediable) weak spots later in the project.
The geographic locations of the planned GITEWS moor-ings (Fig. 3), were optimized for minimal alert delays using tsunami scenarios numerically modelled at AWI (Behrens, 2008). PACT was chosen to occupy five of the ten pro-posed surface buoy sites (Sumatra 1–4) and Java 1, including the deepest locations, while three OBUs shall be distributed among the remaining sites.
Fig. 3. Proposed (and partially occupied) GITEWS mooring
de-ployment positions off Indonesia. Triangles mark two test moorings deployed in 2005. In April 2009, surface buoys were deployed at Sumatra 1–5 and Java 1–5 (blue dots). Red dots indicate the two positions where PACT already provided bottom pressure data.
Fig. 4. Spectrograms of transmitted (electrical output, top) and
re-ceived (acoustic in-water, bottom) signals of a of HAM.node mo-dem in incoherent frequency shift keying (hopping n-of-m-FSK) modulation mode. The record was taken in 2007 during tests in the Bergen Fjord across at least 500 m of horizontal transmission distance with the transmitter at 20 m and the receiver at 10 m depth. The x-axis shows sample number (linearly related to time), the y-axis the signal frequency in Hz. Colour indicates spectral intensity (blue = low to red = high).
the design of PACT and results from the first deployments of five systems in Indonesia before proceeding with a de-scription of the design of the OBU and its first results, before giving a brief outlook of planned activities.
2 HAM.node acoustic modems 2.1 General description
The HAM.node (Hydro Acoustic Modem with network ca-pabilities) was selected on the basis of its flexible modular approach and transmission protocols, which provide com-munication and high level system management functionality for a wide range of subsea data acquisition systems. With GITEWS featuring two possible bottom sensor packages, PACT and OBU, it seemed particularly appealing to main-tain the flexibility of using either of these at any hosting sur-face buoy, necessitating the use of compatible modems which preferably could remotely be tuned to the sensor package op-tion selected. However, at project start, HAM.node modems were at a prototype stage and modem developments contin-ued throughout and as part of the PACT and OBU workpack-ages with particular attention to the specific requirements of these applications. HAM.node modems are now
com-Normalized spectral energy
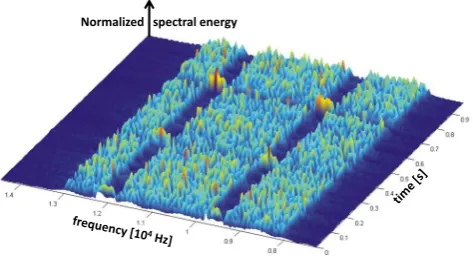
Fig. 5. Spectrogram of transmitted (electrical output) signals of a
HAM.node modem in coherent DPSK (differential phase shift key-ing) OFDM (orthogonal frequency division multiplex modulation) mode for communication in near vertical channels.
mercially available from develogic GmbH since 2008 (see www.develogic.de for further details).
Within GITEWS, the HAM.node modems are used in two different communication modes (high reliability/low speed versus high speed/high power). Besides communication ser-vices, the modems also provide customizable, application specific functionality to expand the functionality of stan-dard, off-the-shelf instruments. The OBU implementation for example makes use of this feature: tsunami detection algorithms and seismic data access are integrated into the modems firmware which executes GITEWS specific com-mands on the seismic data recorder.
2.2 Modulation, coding and transmission scheme The HAM.node operating software implements a multi-layer system interconnection model similar to the OSI (Open Systems Interconnection) reference model (Interna-tional Telecommunication Union, 1998). The uppermost layer is represented by the user and application interface re-ceiving commands and data from a host, whereas the low-est layer is the hardware interface layer handling the sig-nal transmission and reception via the system’s high voltage transmit power amplifier and the receive amplifier with ad-justable gain interfacing to an acoustic transducer through a transmit/receive-switch.
Data coding and modulation algorithms are implemented on a floating point digital signal processor (DSP). The system provides two different configurable modulations schemes, which both incorporate algorithms for Doppler correction for relative motion up to 10 ms−1.
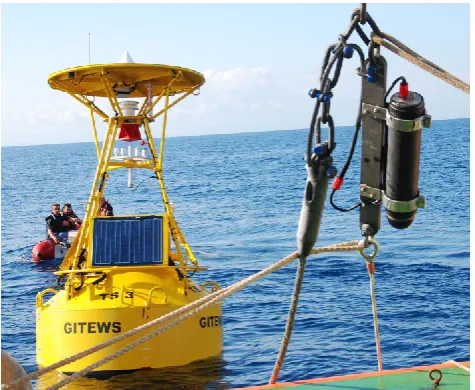
Fig. 6. HAM.node modem (dark cylinder, right) and hosting
sur-face buoy (yellow, left) during tests in the Mediterranean offshore Toulon. The HAM.node modem is attached to a steel girdle in-line with the mooring line.
suitable for transmissions in vertical or near vertical chan-nels with limited amounts of multi-path-propagation, when high data throughputs are required. With the OBU units re-quiring the transmission of large amounts (typically 50 kB to 500 kB) of seismic data, m-DPSK was selected for those units.
The data link layer implements convolutional forward er-ror correction (Shu Lin and Costello, 2004), data compres-sion and checksum verification. A fractionally spaced de-cision feedback equalizer (Benvenuto and Cherubini, 2002) can optionally be enabled for more complex channels when using m-DPSK to partially compensate the time variable properties of the acoustic channel.
CRC (cyclic redundancy check) checksums based hand-shaking and automatic data packet retransmission between bottom and surface modems ensure that each message is re-ceived without any bit errors.
2.3 The HAM.node modem as used in GITEWS surface moorings
To reduce acoustic disturbance from wind waves and air bub-bles, the modems (Fig. 6) are mounted approximately 10 m below the sea-surface to a stainless steel girder integrated in the hosting surface buoy’s mooring line. (Based on at-sea ex-perience, this depth seemed to best balance improved acous-tic conditions and increasing cable costs with increasing depth while avoiding the need for long guard intervals dur-ing DPSK transmissions in response to late surface echoes. Due to the near vertical communication axis, thermocline ef-fects showed negligible influence on the transmission loss, as confirmed through sound propagation modelling.) The
modems are housed in a corrosion-resistant shallow water composite cylinder with a depth rating of 750 m and are con-nected electrically to the hosting buoy by a reinforced under-water cable. Powered periodically from the hosting buoy, the modem is equipped with a set of rechargeable batter-ies (nominal voltage of 25.2 V) to buffer peak power de-mands during acoustic communication. Modems produced in 2009 (for both PACT and OBU) are equipped with NiMH LR20 Acculoop 8.5 Ah cells (providing 214 Wh total), with low self-discharge. These battery packs were substituted by NiCd cells (5.1 Ah each, providing 129 Wh total) for PACT modems produced in 2010. These cells are less susceptible to damage due to deep discharging, which appeared to have oc-curred when the umbilical cord between the hosting surface buoy and the modem broke, causing unrecoverable damage to the NiMH cells used in modems deployed 2009.
2.4 The HAM.node modem as PACT surface unit The HAM.node modems as used in the PACT-SU trans-mit in the 9–12.8 kHz carrier band and are equipped with omnidirectional transducers. In the PACT bottom unit, the HAM-node is integrated as OEM (Original Equipment Man-ufacturer) module in the PACT-BU’s Vitrovex glass pressure housing.
For communication along the near-vertical direction be-tween PACT BU and SU, n-m-FSK modulation is used. The operation profile of PACT’s HAM.node modems is opti-mized for a highly reliable, yet energy-efficient transmission of moderate amounts of data (about 100 Byte per message). At a data rate of 200 bps, each message takes a few seconds for transmission; if necessary, transmission attempts are re-peated up to 3 times at intervals of about 25 s.
This repetition cycle represents a balance between data ef-ficiency and conservation of energy under the following as-sumption: If an acoustic transmission is obstructed by short term noise (e.g. rattling of a shackle), a second or third at-tempt some tens of seconds later, is likely to result in a suc-cessful transmission. However, if increased ambient noise prevails for longer periods (i.e. due to rain or passing of a ship), the likelihood of successful transmission decreases in the short term. In this case additional transmission attempts are unlikely to significantly increase the transmission success rate, but merely would drain the batteries of the BU.
At Sumatra 3 and 4, the respective PACT-BUs entered the
capturing normal mode as scheduled and transmitted status messages every 4 h for several weeks (cf. Sect. 3.6.1).
Table 1. PACT-BU deployment depths [m according to pressure record], acoustic power settings [%], nominal source level (SL), estimated
transmission loss (TL) and received levels (RL, all levels in dBrmsre. 1 µPa ). Success rates are given according to:a22 April to 12 May
(137 of 140 status messages plus 30 of 32 tsunami messages after initial modem adjustment and before cable problems of hosting surface
buoy);b22 April to 2 May (57 of 59 status messages after initial modem adjustment and before surface buoy failure) .
Location Depth Power SL TL RL Success [%]
Sumatra 3 5655 m 90% 184 dB 75 dB 109 dB 98%a
Sumatra 4 5975 m 90% 185 dB 76 dB 109 dB 97%b
After this adjustment, transmissions proved highly reli-able, with 98% (135 of 138 status and tsunami messages) and 97% (57 of 59 status messages) of all messages received at locations Sumatra 3 and Sumatra 4, respectively (Table 1). This is particularly noteworthy, as these sites represent the deepest locations within the GITEWS array (5655 m and 5975 m), emphasizing the robustness of the acoustic trans-mission scheme as selected for PACT.
2.5 The HAM.node as OBU surface unit
The OBU surface unit is similar to the PACT surface unit, except for the installed acoustic transducer. Instead of the aforementioned omnidirectional transducer, a model with di-rectional characteristic (−3 dB@+/−35◦) and a carrier band from 11.2 kHz to 19.2 kHz is installed here to optimize trans-mission performance.
In the bottom unit, the HAM.node modem is housed in a composite deep water housing with a depth rating of 6000 m and is connected via SubConn underwater connectors to the seismic data recorder and external battery housings.
During extensive system tests in the Mediterranean off-shore Toulon at a water depth of about 2400 m, continu-ous bottom pressure data measurements and frequent seismic data recordings were transmitted to the hosting buoy. The configuration and especially the output power setting were selected as to reflect conditions to be expected in Indonesia.
The transmission success (Fig. 7) reveals nominal system operation from 8 October 2008 to 24 November 2008 with 4 transmissions per day. On 7 November, the transmission schedule was reconfigured to 12 data transmissions daily. Of a total of 338 triggered transmission sequences, only 4 failed. Reliability during that test period was better than 98.8% de-spite several periods of severe weather, which resulted in in-creased ambient conditions. By the end of November, the power supply of the OBUs bottom unit was depleted, termi-nating any further data transmissions.
In addition, low level logging information recorded by the acoustic modems was evaluated in order to gain experience about bit error rates during changing environmental noise due to weather conditions and bypassing vessels as well as at different transmission distances due to the changing po-sition of the buoy. Resulting from this evaluation, the
maxi-0 2 4 6 8 10 12 0 7 .1 0 .0 8 0 9 .1 0 .0 8 1 1 .1 0 .0 8 1 3 .1 0 .0 8 1 5 .1 0 .0 8 1 7 .1 0 .0 8 1 9 .1 0 .0 8 2 1 .1 0 .0 8 2 3 .1 0 .0 8 2 5 .1 0 .0 8 2 7 .1 0 .0 8 2 9 .1 0 .0 8 3 1 .1 0 .0 8 0 2 .1 1 .0 8 0 4 .1 1 .0 8 0 6 .1 1 .0 8 0 8 .1 1 .0 8 1 0 .1 1 .0 8 1 2 .1 1 .0 8 1 4 .1 1 .0 8 1 6 .1 1 .0 8 1 8 .1 1 .0 8 2 0 .1 1 .0 8 2 2 .1 1 .0 8 2 4 .1 1 .0 8 2 6 .1 1 .0 8 2 8 .1 1 .0 8 3 0 .1 1 .0 8 0 2 .1 2 .0 8 0 4 .1 2 .0 8 0 6 .1 2 .0 8 0 8 .1 2 .0 8
Fig. 7. Number of successfully received transmissions of initially
4, later 12 initiated transmissions per day (plus additional manually triggered transmissions). Energy supply problems of the OBU-BU lead to decreasing success after 1 December.
mum reliable transmission range with the tested OBU system based on 90% transmission success was calculated to approx-imately 8000 m.
3 PACT2
3.1 General description
To detect the approach of a tsunami as early as possible, sea level recordings taken in the deep ocean far off the coast are indispensible. At water depths of thousands of meters, how-ever, a tsunami wave is only some centimetres to decime-tres high and approximately one hundred kilomedecime-tres long while travelling at several hundred km/h. Being able to reli-ably and precisely detect these slight changes in sea level re-quires the use of high-precision bottom pressure sensors. In-stalled on the seafloor, these instruments register the weight of the water column above and are able to detect passing tsunami waves due to the corresponding change in water height and hence weight. However, with this information be-ing recorded at the seafloor, a communication link needs to be established to relay the data to the EWMC ashore in quasi real-time.
Such a system provides the DART® (Deep-ocean Assess-ment and Reporting of Tsunamis) buoys (Meinig et al., 2005, 2007; Mofjeld, 1997), which have been developed and oper-ated by the US NOAA for the past decade. DART® bottom sensor packages record ocean bottom pressure, perform on-board tsunami detection and acoustically relay the data to the surface buoy. PACT employs a similar data acquisition and relaying approach; however, for its integration into the GITEWS data system several adaptations and a customized solution were needed (primarily concerning data flow con-trol and command structure). In addition, employing the latest advances in computational power and communication technologies, PACT (Pressure based, Acoustically Coupled Tsunameter) integrates the entire sea-floor package (pressure gauge, data logger and analyzer, acoustic modem, acoustic release and relocation aids) into a single unit, i.e. a stan-dard borosilicate glass sphere rated for a deployment depth of 6000 m. The design of PACT thereby pursues a set of goals considered particularly attractive in the context of min-imizing logistic demands for the long-term maintenance of such a system, i.e. to (1) minimize the deployment and re-covery effort, (2) maximize deployment intervals, (3) min-imize investment and maintenance costs, and (4) maxmin-imize data reliability and hardware robustness. Specifically, PACT was designed to make the system deployable and recoverable from small ships and even helicopters, to realize deployment intervals of at least 2 years, to restrict investment costs per system to less than 50 000 C and to achieve a system uptime of>99% (a maximum of one lost status message per month).
2PACT was developed under the auspices of the Alfred
We-gener Institute (AWI) in collaboration with two German small and medium-sized enterprises, SMEs, (OPTIMARE Sensorsysteme AG and develogic GmbH), the MARUM – Zentrum f¨ur Marine Umweltwissenschaften der Universit¨at Bremen, and the Graduate School of Oceanography (University of Rhode Island, USA).
Similar to DART®, PACT monitors ocean bottom pres-sure, automatically detects pressure anomalies possibly caused by tsunamis, and transmits the data in near real-time from the sea floor to the hosting surface buoy. This is achieved by two sub-systems (Fig. 1): The bottom unit, PACT-BU, is a free falling lander, which rests at the seafloor (OPTIMARE Sensorsysteme AG, 2008). It continuously measures bottom pressure and performs onboard tsunami de-tection. The data are transmitted via a bidirectional acoustic link to the surface unit (PACT-SU) (develogic GmbH, 2008). The PACT-SU is located at a depth of about 10 m below the hosting GITEWS surface buoy (Sch¨one et al., 2010) and is attached to the latter by an underwater communication and power cable. Communication between the PACT-SU and the host buoy’s computer is facilitated by the PACT-daemon soft-ware, which is installed on the host buoy’s computer. Any data received from the PACT-BU are saved on the buoy and eventually relayed by the surface buoy via satellite to the EWMC, where the entire set of GITEWS observations and modelled tsunami scenarios are processed (Fleischer et al., 2010).
The bi-directional communication link also offers the op-tion of remotely changing detecop-tion thresholds and other pa-rameters without the need to recover the system from the seafloor, which helps to fine-tune a system to its specific de-ployment location while deployed.
3.2 Data flow, command, and control
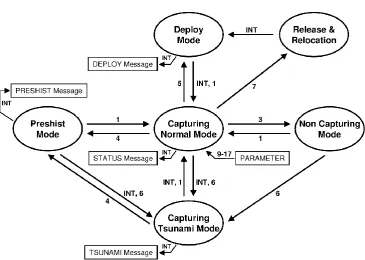
The PACT system (i.e. BU, SU and PACT-daemon) operates in six different modes (Fig. 8), which are either activated through the BU’s internal program or re-motely through the EWMC. Four of these operating modes mirror the EWMC’s overall system modes which apply to the entire suite of GITEWS sensors, while two additional modes are specific to PACT for instrument deployment and recov-ery.
Capturing normal mode is the default mode during in-strument operation. Pressure is averaged over and polled every 15 s. Every 4 h, a status message containing a set of 24 10-min pressure averages of the last 4 h is generated and transmitted to the surface unit. The status message also contains engineering data (battery voltages, tilt and internal pressure), time stamp and message ID which permit monitor-ing and forecastmonitor-ing the operational state of the bottom unit.
Capturing normal mode is entered whenever the BU is reset
(command “1” in Fig. 8), or automatically, when a capturing
tsunami mode (see below) has expired. Status messages are
not forwarded immediately upon their reception by the buoy, but in combination with status information from the buoy’s other sensors at externally determined times.
Fig. 8. PACT operating modes and command structure. Ellipses symbolize the six operating modes. Arrows indicate possible transitions
between these modes, which may be initiated either by external commands # 1, 3, 4, 5, 6 and 7, or internally via firmware control (INT). Rectangles indicate the four messages types that are generated by the firmware and a set of parameters with may be uploaded to the PACT-BU via commands 9–17.
first tsunami message is immediately issued with subsequent messages following every 2 min. After 30 min, the PACT-BU automatically returns to capturing normal mode. The
captur-ing tsunami mode can also be commanded manually from the
EWMC, allowing the detection of smaller tsunamis not ex-ceeding the pre-set anomaly threshold. For the duration of the capturing tsunami mode the internal, automatic tsunami detection algorithm is deactivated, regardless of how the
cap-turing tsunami mode initially had been triggered (manually
or automatically). However, a capturing tsunami mode may be re-triggered, immediately after the system’s return to
cap-turing normal mode if the actual pressure readings still
de-part from the predicted pressure by more than the anomaly threshold.
A peculiarity of the GITEWS system is the fact, that at any time, mode-control and data transmission control was prescribed to be top-down. The concept is that any sensor only sends an “alarm” bit to the EWMC, which then responds by toggling relevant sensor groups (seismic, GPS, gauges, buoys) to “capturing tsunami mode”. This way communica-tion bandwidth (and costs) should be kept low during stan-dard monitoring times and optimized during alert times (e.g. not using satellite bandwidth from sensors located out of rel-evant range). For PACT, this concept would have implied that PACT could enter the “capturing tsunami mode” only
once it hydroacoustically transmitted the “alarm” bit to the hosting buoy, the buoy forwarded the “alarm” bit via satellite to the EWMC, the EWMC commanded the buoy via satellite to enter “capturing tsunami mode” and finally the buoy com-manded – again via hydroacoustic link – the PACT-BU to assume “capturing tsunami mode”. While such an approach might prove robust for instruments relying on satellite/cable communication only, the possibly significant latency time in underwater communication renders this approach unsuitable for PACT.
The PACT system circumnavigates these incompatibilities through the following approach. An automatic tsunami de-tection as registered by the PACT-BU, sets the PACT-BU to
capturing tsunami mode and immediately transmits the first tsunami message. This message, as any other tsunami mes-sage, contains a tsunami alert flag which is extracted by the
PACT-daemon and forwarded to the hosting buoy’s buoy-daemon, which in turn forwards it to the EWMC. Meanwhile the PACT-BU continues to transmit further tsunami messages every 2 min as scheduled. The PACT-daemon receives these and saves them on the hosting computer’s hard disk, however without notifying the buoy-daemon of their presence.
If the EWMC reacted to the alert flag by issuing a
captur-ing tsunami mode command to the hostcaptur-ing buoy (which sets
the PACT-daemon and all other additional sensors), the PACT-daemon responds by notifying the buoy-daemon of all available tsunami messages it had meanwhile received and saved to hard disk. In turn these will then be forwarded by the buoy-daemon to the EWMC. Alternatively, if the EWMC does not respond by issuing capturing tsunami mode, after 30 min the PACT-BU will automatically return to capturing
normal mode, while any saved tsunami message will be
dis-carded as part of the routing housekeeping activities of the buoy computer.
The non capturing mode is a “sleep mode” to be used when the instrument is being transported or stored to avoid unintended activation of the acoustic modem which may re-sult in rapid battery depletion. While deployed, it may be used to set the BU to sleep in case that extended off-line pe-riods are to be expected for the hosting surface buoy.
Pressure history mode allows downloading of full-resolution 15-s data sets of the last 3 h. However, the tsunami detection algorithm remains active at all times and switches the PACT-BU unit into capturing tsunami mode if required. Note that the PACT-BU’s pressure history mode is not yet supported (and hence cannot be activated remotely) by the current general GITEWS specification, but it can be accessed manually via acoustic commands during servicing, e.g. from a research vessel.
Two additional modes are implemented for operational purposes during deployment and recovery only:
During deploy mode pressure and tilt information are sent at pre-defined regular intervals in deploy messages to moni-tor the PACT-BU’s descent to the sea-floor and its orientation once landed. The deploy mode times out automatically after a customizable period (currently set to 5 h) after being trig-gered. The currently implemented transmission schedule is optimized to monitor the deployment process, transmitting every 5 min for the first hour, every 10 min for the second and third hour, and every 20 min for the fourth and fifth hour. Thereafter the PACT-BU switches to capturing normal mode. The release and relocation mode can only be triggered by commands directly entered to an acoustic surface modem. When received, the PACT-BU activates the burn-wire release and transmits deploy messages in accordance with the de-ploy mode schedule as described above. At the surface, a flashlight and the VHF (very high frequency) transmitter aid relocation of the system once surfaced. In instruments of ver-sion 2010, the relocation module is activated not only upon reception of the release command, but automatically when-ever the instrument turns upside down, i.e. when floating up to the surface due to accidental loss of the anchor weight (see Sect. 3.4).
Last but not least, the system permits to remotely recon-figure the measurement schedule, averaging and polynomial extrapolation parameters, and tsunami detection thresholds via specific commands (“9”–“17” in Fig. 8) without prior re-covery of the PACT bottom unit.
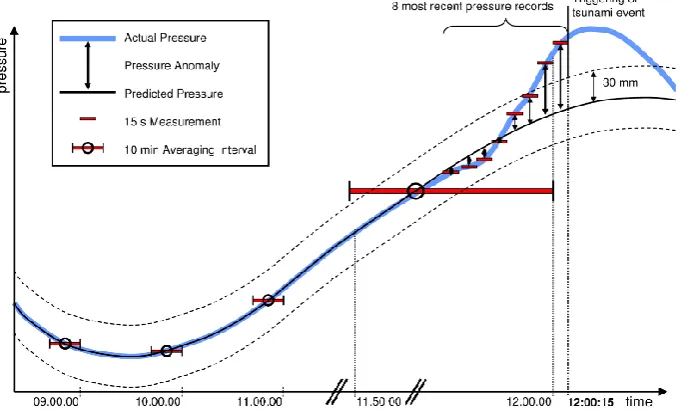
3.3 Data acquisition and automatic tsunami detection The automatic detection of a tsunami event is performed identical to the proven DART® tsunami detection algorithm as published (Meinig et al., 2005, 2007; Mofjeld, 1997). The basic concept is to compare the actual pressurehk(at time =
t0), as measured every 15 s, with a predicted pressureHf as based on a polynomial extrapolation of the preceding pres-sure records (Fig. 9). The predicted prespres-sure for the next timestep (t0+15 s) is thus given by:
Hf=w(1)H (1)+w(2)H (2)+w(3)H (3)+w(4)H (4)
The weight factors w(1)–w(4)are based on Newton’s for-mula for forward extrapolation, while the four 10-min pres-sure averagesH (1)–H (4)(called nodes hereinafter) are cal-culated across the intervals [t0−190 min:t0−180 min], [t0−130 min:t0−120 min], [t0−70 min:t0−60 min], [t0− 10 min:t0]. The predictionHf is re-evaluated by the PACT-BU every 15 s for each new pressure measurement and com-pared with the actual pressurehk.
This approach exploits the fact that in the deep ocean, short surface waves (wind waves) have no influence on ocean bottom pressure – only long gravity waves like tides and tsunamis with wave-lengths of hundreds of kilometres affect the bottom pressure. For tides, the predicted pressure closely matches the real pressure due to their long timescales of sev-eral hours. In contrast, tsunami waves have timescales of tens of minutes and hence may be recognized by larger anomalies between prediction and observations.
The PACT-BU enters a capturing tsunami mode when the two most recent 15-s observations both exceed a pressure anomalyhk−Hf threshold of 30 mm (Fig. 9). Furthermore, an additional spike criterion has to be passed, which serves to exclude false measurements. For this, the pressure reading att0−15 s reading must not depart more than 100 mm from the mean of the pressure readings att0andt0−30 s, i.e. the pressure change should be reasonably “smooth” during the 45 s prior to the current measurement.
Fig. 9. Sketch illustrating the tsunami detection algorithm (Mofjeld, 1997). The solid curves show the actual (heavy blue line) and predicted
(thinner black line) pressures based on four 10-min averages (horizontal bars). Note that the time axis is not to scale, zooming into the last 10 min and 2 min intervals. In this example, the two most recent 15-s records (horizontal short red bars) starting at 11:59:45 exceed the 30 mm anomaly threshold (dashed lines), triggering the tsunami mode at 12:00:15.
ongoing wave can be reconstructed using any tsunami
mes-sage’s ID, its pressure data and the included information on
the nodes for cubic polynomial extrapolation (as determined at the time of entering the capturing tsunami mode). This in-formation is included redundantly in all tsunami messages which are transmitted in 2-min intervals for 30 min. The inclusion of information on the nodes is particularly impor-tant when the capturing tsunami mode is triggered remotely by the EMWC, as they contain the information on the re-cent pressure history, which is needed to correct the real-time pressure signals for tidal contributions.
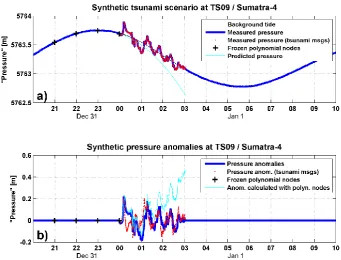
The response of the PACT-BU to simulated tsunami events (Fig. 10) and the subsequent processing of PACT tsunami
messages have been simulated at AWI and GFZ to ensure
that the data provided by PACT are compatible with the GITEWS data flow specifications. To simulate the activi-ties of a PACTBU, high resolution synthetic pressure data (black line in Fig. 10) were generated using real bottom pres-sure data meapres-sured by the PACT-BU deployed at Sumatra-3. Then, a numerically modelled tsunami anomaly signal from the TsunAWI model (Babeyko et al., 2010; Harig et al., 2008) was added (heavy blue line in Fig. 10). Finally, these data were fed into the PACT-BU’s internal data processing scheme, resulting in status messages and a set of 16 simu-lated tsunami messages once the automatic tsunami detec-tion algorithm indicated the detecdetec-tion of the tsunami. These messages contain absolute pressure (red line in Fig. 10a), the “frozen” polynomial nodes (“+” signs in Fig. 10a), and pres-sure anomalies as based on the recent polynomial nodes (red line in Fig. 10b) and correct relative timing.
To obtain realistic estimates of time series of tsunami wave heights, however, the polynomial nodes as calculated just prior to the arrival of the tsunami should be used as depicted in Fig. 10. Predicted anomalies (Fig. 10b, cyan line) and “real” wave height (heavy blue line) coincide well during the first 30 min. A later calculation of polynomial nodes includ-ing pressure data from after the time of arrival will, by con-trast, include pressure data already influenced by the passing tsunami wave, rather than the tide only. Hence the resulting polynom will “include” part of the tsunami wave, resulting in reduced anomaly estimates (i.e. pressure data – polynominal prediction).
Over the course of several hours the “frozen” polynomial prediction (Fig. 10a cyan) unavoidably starts to diverge from the true tidal curve (Fig. 10a black), hence resulting in in-creasingly false estimates of tsunami anomalies (Fig. 10b cyan). However, as only the first 20 min of a time series are relevant in the context of GITEWS, this error remains negli-gible here for any practical purpose.
Fig. 10. Example of a synthetic tsunami scenario. Start time of the event is 1 January 00:00 (vertical line). (a) Absolute pressure. Blue:
Compounded, high-resolution absolute pressure data (observed tidal signal and instrument noise combined with modelled tsunami anomaly). Red: As above, data segment to be transmitted in high-res in capturing tsunami mode. Crosses: “Frozen” polynomial nodes as calculated onboard PACT-BU. Cyan: cubic extrapolation of expected “tsunami-free” tidal curve. (b) Pressure anomalies with tides subtracted. Blue: “real” tsunami anomaly (from TsunAWI model). Red: Pressure anomalies transmitted in tsunami messages (using recent, disturbed poly-nomial nodes). Cyan: Pressure anomalies calculated from actual pressure and pressure prediction based on “frozen” polypoly-nomial nodes. For further explanations see text body.
Table 2. Summary locations, associated equipment, and confirmed system endurance.aData from ship’s echosounder. bData on basis of PACT-BU pressure measurements.
Location BU S/N Buoy ID Deployment date Depth BU endurance Likely cause of failure
Sumatra 2 #4 TS 07 12 Apr 2009 5370 ma 1.5 h Drop weight loss & internal short-circuit
5377 dbarb
Sumatra 1 #6 TS 06 13 Apr 2009 ∼5000 ma 0 Probably internal short-circuit
Sumatra 3 #8 TS 04 16 Apr 2009 5660 ma 37 days Break in underwater cable SU to buoy
5655 mb
Sumatra 4 #2 TS 09 17 Apr 2009 5990 ma 14 days Communication loss with surface buoy
5975 mb
Java 1 #7 TS 10 22 Apr 2009 3300 ma 12 min Drop weight loss
is continuously updated, always including the latest informa-tion from the full suite of active sensors.
To assign the exact timing of a tsunami event indepen-dent of any delays in the transmission chain, the PACT BU timestamps each tsunami message. However, due to the BU’s internal clock drift, this timestamp needs correction. This is performed at the EWMC by comparing the BU time stamps of each message with the surface buoy’s GPS time (see Fig. 2), which is assigned to each message when saving
Pressure Sensor
Measurement Controller
Relocation Module
BU Controller
Emergency Release
Module Acoustic
Modem
Acoustic Transducer
Burnwire Releaser
External Power Supply Power Management
Modem Battery Pack Releaser
Battery Pack Controller
Battery Pack
Amplifier Housing
Analog signals
RS-232 Analog
signals
Digital signals Backup power supply & Analog Signal
Power
Power supply Power supply
Power supply Power supply
Control
Fig. 11. Schematic diagram of functional groups of the PACT-BU.
Fig. 12. PACT bottom unit and steel stand. The black cylinder at
the top is the modem; the burn-wire release of the BU is located in the lower cage. For deployment, additional weights are attached between the release and the steel stand.
3.4 System hardware
The PACT bottom unit (Figs. 11 and 12) is housed by a single 1700Vitrovex glass sphere with plastic hard hat, containing all components of the instrument (OPTIMARE Sensorsysteme AG, 2008). The instrument is rated for a maximum pres-sure of 6000 dbar. The mechanical layout of the PACT-BU closely resembles the design of the Pressure Inverted Echo Sounder (PIES) developed by the University of Rhode Is-land (Chaplin and Watts, 1984; Kennelly, 2009; University of Rhode Island, 2006). Glass sphere, pressure sensor, re-lease and steel stand are essentially identical to PIES, which have proven highly reliable in many oceanographic studies throughout the last three decades (Tracey et al., 2009).
A battery package of 86 (ver. 2009) or 91 (ver. 2010) Lithium D-size cells with a total capacity of 4025 Wh (ver. 2009)/4259 Wh (ver. 2010) provides power for the con-troller, modem and release and is designed for more than two years of operation in normal capturing mode.
The modem of the bottom unit is integrated in the BU housing, and powered by a separate subset of batteries. The projected lifetime of the 2527 Wh (ver. 2009)/2948 Wh (ver. 2010) modem battery pack in the bottom unit allows about 29 months between service, assuming one status mes-sage every 4 h, a capturing tsunami event once per week (false alerts or tests), and the need of 1.1 acoustic attempts per successful transmission at a power setting of 80%. How-ever, this estimate also depends on multiple additional factors that are difficult to predict, such as the battery capacity as a function of the actual drain history, the impedance response of the transducer to the actual pressure and of course the ac-tual frequency of “capturing tsunami modes”, resulting in an estimated tolerance of+10% to−30%. Additional battery capacity may be made available in future versions by dis-abling the HAM.node’s real time clock, which is powered up but not used in the current setup.
In case that the PACT-SU fails or is running out of power, acknowledgement of the reception of acoustic messages from the PACT-BU cannot be issued by the PACT-SU. Con-sequently, power consumption of the bottom unit would in-crease due to repeated transmission attempts, reducing the operational lifetime (but not the emergency release function, see next section) of the PACT-BU.
The PACT-BU is configurable (in the lab or onboard prior to deployment) via a PC based serial terminal connection over wireless network (IEEE802.11b/g) using the PACT-BU commands (Fig. 8).
3.5 Deployment and recovery
The BU is deployed in an expendable steel frame while tied with its release hook to an anchor weight (Fig. 12, black weights right below white unit), ensuring a stable position of the system at the seafloor. The entire assembly is designed for a free-fall deployment. The PACT-BU features tilt sen-sors which allow verifying the upright orientation once the system settled at the sea-floor, a necessity for optimal acous-tic communication with the surface unit.
To recover the instrument, an individually coded acoustic signal has to be sent via a transducer deployed from a ves-sel. PACT provides two options to activate the release mode: firstly, a particular command can be sent via a HAM.node modem directly. Secondly, in case that the modem battery has already been depleted, parts of the acoustic modem are powered by the separate release battery. Although no data messages are then being transmitted, bit-encoded 12 kHz acoustic commands from an Edge Tech Inc. 8011A deck-unit can still be processed by the release module. This emergency release function allows a recovery of the bottom unit even 1–
Fig. 13. 5 PACT Bottom Units in “hard hat” protective housing
(white) with Ham-Node Modems (olive) ready for shipping to In-donesia. Shipping boxes (brown with aluminium rims) are visible in the background.
2 years (limited by the stand-by current of the acoustic mo-dem) after the normal acoustic operation has ceased.
When the BU detects an acoustic release command, a burn wire release is activated, dropping the anchor weights after 5–20 min. The instrument then rises at about 0.75 m s−1 to the surface; due to the BU’s internal weight distribution, it will turn upside down, with the acoustic modem pointing downward into the water, a configuration that has success-fully been used in PIES to range instruments even when at the sea-surface (D. R. Watts, personal communication). At the surface, a relocation module including a bright xenon strobe and a VHF transmitter aids the recovery of the instrument. Starting with PACT-BU ver. 2009, the relocation module is also activated whenever the BU turns upside down, i.e. af-ter an accidental loss of the anchor weights without a prior release command.
3.6 First results 3.6.1 Overview
vicinity of the DOLAN mooring, while a HAM.node modem was attached to the DOLAN surface buoy.
Via an Iridium satellite link, direct communication could be established between the lab and the surface and bottom units. For the period 6 November 2007 through 14 April 2008 (i.e. 151 days) the bottom modem was contacted twice daily for 301 times, with 268 pings successful and 33 pings terminated due to timeouts. This, however, was most likely caused by a timeout of the Iridium modem rather than a fail-ure of the underwater modem communication. Hence, this result implies successful underwater communication in at least 89% across a distance of 3900 m and even under adverse weather conditions with wind speeds up to 15 m s−1(NCEP reanalyses; Kalnay et al., 1996) and significant wave heights up to 4 m (calculated from AVISO altimetry products).
For the first embedded deployment of PACT as integral component of the GITEWS hardware in Indonesia, five (plus one spare) PACT systems (Fig. 13) were prepared and shipped for deployment during RV Sonne expedition SO-TEWS-1/2 to occupy five (including the deepest) deep ocean mooring locations (Sumatra 2, 1, 3 and 4 as well as Java 1 in order of deployment, cf. Fig. 3). During this cruise, PACT-daemons were installed on each host buoy’s computer while PACT-SUs were mechanically attached to the mooring line and electrically connected via underwater cable to the sur-face buoy by the buoy operators. After each deployment of the surface buoy, all PACT-SUs were tested remotely via Irid-ium link and confirmed operational. Then, PACT-BUs were launched in close vicinity of the surface mooring while mon-itoring their descent to the sea floor with a second surface modem which was lowered to the side of the ship.
While the overall success of this first deployment was lim-ited, it was nevertheless demonstrated that the communi-cation concept stably operates end-to-end, as pressure data from 2 systems deployed at the deepest locations (Sumatra 3 and Sumatra 4) were reliably recorded, transmitted and re-ceived ashore for several weeks, while system commands is-sued ashore were processed as expected by the BUs at the sea-floor.
Throughout the deployment period off Indonesia, wave heights (calculated from AVISO altimetry products) aver-aged around 1.70±0.25 m at both positions, while wind speed (calculated from NCEP 4-times daily reanalysis val-ues; Kalnay et al., 1996) was 3.2±1.8 m s−1. Both wave heights and wind speeds are lower than during the monsoon season in July–September (2.3±0.4 m, and 7.4±2.6 m s−1, respectively). Rainfall (relevant for acoustic noise), in con-trast, was representative for the annual distribution. Nev-ertheless, acoustic transmission functioned even at times of rainy and windy (9 m s−1)days with wave heights of 2.1 m, (based on NCEP and AVISO records, not shown), and also during occasionally more severe conditions of the 6-months test deployment at DOLAN.
The data flow from BU #2 ceased after 14 days due to mal-functioning of hardware components external to PACT, i.e.
Fig. 14. Summary of 14 days of real time data from position
Suma-tra 4. Blue dots represent 10-min pressure averages (Suma-transmitted via status messages). Limits of time axis as for figure depicting pres-sure data at Sumatra 3 (Fig. 15).
due to a loss of contact between the communication satellite and the surface buoy at Sumatra 4. The communication be-tween the PACT-SU and surface buoy at Sumatra 3 became increasingly impaired due to a break in the buoy’s underwa-ter communication cable, before finally ceasing afunderwa-ter 37 days of operation (Table 2). Indeed, during a buoy maintenance cruise in November 2009, damaged wire leads were found in the umbilical cord connecting the PACT-SU with its hosting buoy.
Regrettably, of the 5 PACT systems deployed during the cruise, 3 PACT-BUs (#4 at Sumatra 2, #6 at Sumatra 1 and #1 at Java 1, cf. Table 2) failed shortly after launch, with PACT BU #4 being found adrift by a fisherman a few weeks later and returned to Germany for analysis. The prob-lems that had led to these premature failures of the PACT-BU (ver. 20093) during the deployment phase have mean-while been identified and corresponding design modifica-tions (ver. 2010) are expected to prevent future failures of similar kind. Three new PACT-BU systems have been pre-pared to be deployed at the next possible opportunity. 3.6.2 Data acquisition and automatic tsunami detection After transition from deployment mode to capturing normal
mode, the PACT-BU at locations Sumatra 3 and 4 regularly
delivered records of 10-min bottom pressure data for sev-eral weeks (time series shown in Figs. 14 and 15). The data clearly show the semidiurnal tides (of up to 1 m ampli-tude) with diurnal and fortnightly modulations in the 10-min
3The indicators “ver. 2009” and “ver. 2010” refer to the
Fig. 15. Summary of approximately 37 days of real time data from
position Sumatra-3. Blue dots represent 10-min pressure averages (transmitted via status messages), red dots 15-s instant data (trans-mitted as part of tsunami messages when system was in capturing tsunami mode).
averaged pressure records (outliers are caused by spikes, as discussed below).
At Sumatra 4 (BU #2, Fig. 14), 57 of 59 status messages (97%) were received after 22 April 2009, once the surface modem’s detection thresholds had been optimized. There-after, only two messages were lost, and apparently no repeat transmission attempts were started by the BU (evident in sta-ble modem battery voltage after 22 April 2009, Fig. 18) de-spite of this station being the deepest of the entire GITEWS array. No false tsunami alarms were triggered; also the sys-tem status (Fig. 18) shows stable conditions. On 2 May 2009, all satellite communication with the surface buoy ceased, hence no PACT data were received thereafter.
At Sumatra 3 (Figs. 15 and 19), transmission success rates were 98% from 22 April 2009 (after initial adjustment of the surface modem) until 12 May 2009, when a loose contact in the cable connecting surface modem and buoy caused tran-sient interruptions of increasing duration in the communica-tion between the hosting surface buoy and the PACT-SU, un-til a last message was received on 23 May 2009. During this period, 121 of 122 status- and 30 of 32 tsunami-messages (as generated by 2 tsunami events) were received resulting in a total of 151 messages.
Unlike BU #2, this BU triggered several tsunami alarms (Fig. 15) due to what appear to be double- and triple-spikes in the pressure record. The system parameters (Fig. 19) of this BU are nevertheless stable. During tsunami alarms, which result in increased modem activity, the internal temperature increases by a few tenths of a degree, an effect that was al-ready noted during bench-tests. As temperature measure-ments by the internal SHT sensor are collected at a rate of
Fig. 16. (a) Bottom pressure data from position Sumatra-3 on 10
May 2009. Red dots indicate in-situ pressure data during two false tsunami alarms (triggered by spikes in the pressure record). The time of Bengkulu earthquake is marked by a bold arrow. Vertical lines indicate the timing of status message transmissions. (b) Zoom-in of the first (false) tsunami alarm. Arrows Zoom-indicate the timZoom-ing of alarm messages. Note the 2 consecutive false measurements at about 01:58, triggering the transmission of the first alarm message immediately after. Later outliers do not re-trigger the tsunami mode. At 02:10, a single alarm message (containing 8 data points from the last 2 min) is missing. The first tsunami message contains 6 normal values followed by the first two outliers. The predicted pressure values (green dots), however, increase by 5 mm after the 7th data point, when the last 10 min average polynomial node starts to be affected by the outlier.
once per hour only, the warming of the BU during the
cap-turing tsunami mode results in false estimates of the bottom
Fig. 17. Bottom pressure data during an externally triggered tsunami alarm on 19 April 2009 from position Sumatra 3. Blue dots: 10-min averages. Red dots: measured 15-s data; Green dots: pre-dicted data (based on cubic polynomial over past 3 h). Dotted lines indicate 30 mm tsunami threshold which is far outside the noise of the measurements during normal conditions. Vertical arrows show timing of alarm messages, vertical line of consecutive status mes-sage after the alarm timed out.
Nevertheless, this BU (#8) is suspected to have some sen-sor or electronics faults, as indicated by several false tsunami alarms (Fig. 16, red dots near 02:00 h and 17:00 h) and occa-sional sign errors of tilt “X” (Fig. 19). The false alarms oc-curred due to false pressure measurements (example shown in Fig. 16) with always three consecutive data points being 0.12 dbar higher than the predicted pressure, thus passing the spike criterion and triggering a tsunami alarm after the second outlier. Capacitive coupling to ground between the pressure sensor and acoustic modems which could result in the spikes as suggested by one reviewer can be excluded as possible cause, due to a clear temporal mismatch between acoustic transmission and spikes (Fig. 16). Rather, recent lab testing of an identical system revealed that such spikes were caused by a resistor of false value in the data acqui-sition module. The Bengkulu earthquake on 10 May 2009 of magnitude Ms 5.1 (USGS (United States Geological Sur-vey), 2009) did not trigger any tsunami alarm (Fig. 16a, black arrow).
A capturing tsunami mode was actively triggered by re-mote command on 19 April 2009, testing the option of setting the BU into this mode prior to any possible tsunami event (Fig. 17). The pressure readings show a noise level close to the numerical resolution of the system (0.001 dbar, equiva-lent to 1 mm water column height) and pressure anomalies
hk−Hf less than 3 mm. An oscillation at a timescale of 10 min might suggest the presence of some long waves or aliasing of some interference of different short surface waves
Fig. 18. Status information from BU 002 at location Sumatra 4.
Legend as follows unless self explaining: B(HAM), cyan = mo-dem voltage in V; B(REL), magenta = emergency release voltage; B(CTR), blue = BU-controller voltage; Tilt X and Y (blue, red) = tilt of bottom unit relative to vertical; Missing Msg ID (green) = number of missing messages since last transmission due to commu-nication failures (“0” indicates zero lost messages, “1” i.e. a single lost message, etc.). No tsunami alarm occurred at this unit.
Fig. 19. Status information from BU 008 at location Sumatra 3.
Legend as in Fig. 18. Red peaks at “16”: Tsunami alarm with (nom-inally) 16 tsunami messages.
3.6.3 Energetic performance
As described above, the PACT-BU comprises three separate battery packs for the modem, the BU-controller board and the release system. Battery records are contained in the sta-tus messages and were retrieved for BU #2 (Fig. 18) and #8 (Fig. 19) at Sumatra 4 and 3, respectively. For both systems, the nominal battery voltage was maintained for the duration of the data record lengths of 38 days and 14 days. The only exception occurred during capturing tsunami mode, when the increased amount of acoustic transmissions lead to a voltage drop of about 2 V in the modem battery (Fig. 19, B(HAM)).
The fortunate retrieval of BU #4 also allowed checking the battery packs more than 9 months after deployment (on 26 January 2010). The modem battery was completely depleted (VHAM=0 V; versus 32.4 V at deployment) due to an internal short out. By contrast, the voltage of the PACT CPU battery (VCTR=7.0 V) was still close to its deployment value of 7.2 V, much like the emergency release battery (VREL=14.3 V, ver-sus 14.4 V at deployment).
The possibility of a short-out in the modem’s power supply had already been noted during the deployment cruise. Af-ter a test of BU#8, the unit’s modem power regulator was found short-circuited. Subsequent onboard and parallel lab-oratory tests revealed that transient voltage peaks (e.g. during high loads or connect/disconnect operations) could possibly cause short-circuiting in the modems voltage regulator. This problem had slipped previous lab-tests, because, while in-air, the modems were operated at reduced power to avoid damaging the transducer and on an external power supply of higher internal resistance to retain the batteries’ full capacity. Noting that none of the PACT-SUs, which are equipped with rechargeable batteries of nominal 25.2 V had shown similar problems, the BU’s modem battery appeared as the critical component.
To eliminate any chance occurrence of this problem, be-ginning with BU #8 at Sumatra 3, peak power settings were reduced from 97% to 90% and modem battery packs were reconfigured at sea from 32.4 V to 28.8 V (nominal). This resulted in a reduction of battery capacity by 11%. Appar-ently, this seems to have solved the problem, and BU#8 and #2 performed well in this regard, while the failure of BU#7 is attributed solely to the lost drop weight, as its acoustic power level had been reduced to 60% due to its shallowness.
A post-cruise battery re-layout implemented now in PACT-BU v2010 operates at a modem operating voltage of 25.2 V (nominal) from 9 parallel battery packs (compared to 6 originally) while shifting capacities from the controller batteries (−25%) to the modem battery (+17%, each with regard to the original design).
3.6.4 Deployment and recovery
The system deployment involves three steps: The installa-tion of the SU at the surface buoy, the mooring of the
sur-face buoy4, and finally the launch of the PACT-BU. At three locations (Sumatra 2, Sumatra 1, and Java 1, in order of de-ployment) the surface buoy moorings were deployed imme-diately prior to the launching of the PACT-BU (Table 3). The surface buoy mooring was deployed “anchor last”, i.e. the surface buoy mooring assembly was spread linearly on the sea surface with the anchor weight being attached as the last element. Upon release of the anchor weight, the anchor drops while dragging the mooring assembly down with it. PACT-BUs were dropped within a few minutes of the release of the anchor weight, and hence sank to the bottom concurrent to the righting process of the surface buoy mooring.
By contrast, at the other two locations (Sumatra 3 and 4) surface buoys had already been moored during a previous cruise and did not require redeployment during this cruise. In these cases, PACT-BUs were dropped at a nominal dis-tance of 200 m from the buoy and hence represented the only moving object in the water column while falling. It is worth noting, that these 2 systems touched down well and started their mission as planned. By contrast, the three PACT-BUs that were dropped concurrently with the righting of the sur-face mooring system, failed. While we do not think this to be the reason for the failure of these 3 systems, this concor-dance nevertheless suggests dropping the PACT-BU prefer-ably only once the surface buoy mooring is fully upright. In fact, this procedure would also help minimizing spatial errors resulting from buoy set-back when deploying the PACT-BU prematurely.
PACT-BU drop speeds of 1.8 m s−1 and 1.6 m s−1 were calculated from the full pressure record as retrieved from the internal log-file of BU#4 at Sumatra-2 (system weight 96 kg) and from 3 intervals of 4 deployment messages during the free fall phase of BU#2 at Sumatra 4 (system weight 66 kg). Both values showed a high stability between individual data records. A drop speed of greater 1.4 m s−1 was estimated from the period between launch and the first received mes-sage from the sea-floor of BU#8 at Sumatra 3. However, prior to transmission of this message, the instrument prob-ably had been resting at sea-floor for an unknown period, rendering this value a lower bound estimate only.
With the mechanical dimensions of PACT being similar to the PIES design, like behaviour regarding the free-fall deployment and recovery of PACT were expected. How-ever, the abovementioned speeds are up to 50% higher than speeds known for PIES (B¨oning et al., 2010). These in-creased speeds may likely have lead to the premature fail-ure of BU#4 at Sumatra 2 and BU#7 at Java 1. At touch-down, higher sinking speeds induce increased strain on the release block, which possibly leads to a failure of the release
4The entire complex of the surface buoy (system design,
Table 3. Mooring locations, associated equipment and deployment methods.
Location Host buoy BU S/N Depl. strategy host buoy Depl. Strategy PACT-BU
Sumatra 2 TS07 #4 anchor last Concurrent (+1 min)
Sumatra 1 TS06 #6 anchor last Concurrent (+12 min)
Sumatra 3 TS04 #8 NA (already deployed) Post (200 m distance)
Sumatra 4 TS09 #2 NA (already deployed) Post (200 m distance)
Java 1 TS 10 #7 anchor last Concurrent (+few min)
wire/pin assembly, causing an early and unnoticed release of the bottom unit. The mechanical failure of the release pin in fact was confirmed upon inspection of PACT-BU#4 after its incidental recovery. The release block lacked the release pin, but the burn wire was still in place and bent open, al-lowing the pin to have slipped out of its hold and releasing the BU’s anchor weight. The pressure records stored in the log file of BU#4 at Sumatra-2 reveals that this instrument touched the sea-floor only briefly before starting to ascend, suggesting that the drop weight was lost upon impact. From PACT-BU#8 at Java 1, only a single message was received 12 min after launch, indicating a depth of about 14 m. At the sink speeds calculated above, however, the instrument would be expected at about 1150 m depth at this time, which also indicates an early release of the PACT-BU from its anchor.
Strain tests in the laboratory meanwhile revealed that the original release pin assembly did indeed break at a strain of 0.9 to 1.6 kN, which is significantly below the specifications of 3 kN. Modifications to the pin assembly’s material and de-sign now result in specimens with tested breaking strain lim-its>3 kN. System weight will be further reduced in future deployments, rendering similar problems unlikely.
Last but not least, the ascending speed of BU#4 was 0.75 m s−1, a value consistent with observations made dur-ing the recovery of PIES (B¨ondur-ing et al., 2010).
4 OBU5 4.1 Rationale
It is well known that tsunamogenic earthquakes nucleate at the plate boundary between the downgoing and the overrid-ing plates. The seismogenic zone is generally located off-shore, and thus the hypocenter is poorly located when only a land based array of seismometers is available for a rapid de-termination of the earthquake location. Errors of up to 30 km have been reported from other subduction zones (Hasegawa et al., 1994; Husen et al., 1999). Therefore, augmenting the land based arrays by a few marine stations, located seawards of the seismogenic zone, will make rapid hypocenter
deter-5The OBU was developed under the auspices of IFM-GEOMAR
in collaboration with develogic GmbH.
mination more reliable. This was the main motivation to de-velop an OBU, which in addition to a pressure sensor also carries a broadband seismometer and hydrophone.
Furthermore, pressure changes at the seafloor with ampli-tudes and frequencies of typical tsunami signals can also be caused by events other than tsunamis. Besides rare events caused by mechanical contact with sea-floor fauna and pos-sibly meteorological signals, the main source for pressure changes at the seafloor are surface waves from large teleseis-mic events. It is straight forward to discriminate between a tsunami signal and a teleseismic surface wave once pressure and seismometer data are available. Therefore, such a com-bined data set will help to reduce the number of false alarms. 4.2 Data flow, command, and control
Like PACT, the OBU is a free fall lander system, to be de-ployed close to a surface buoy to enable acoustic data trans-mission from the OBU to the sea surface and further to the EWMC. Both the seismic and the pressure data are continu-ously stored onboard the OBU, with a storage capacity for at least 12 months. The pressure data are transmitted at preset time intervals. When a tsunami signal is detected, an alarm is issued – similar to the PACT system. The seismic data are stored in the OBU, and are transmitted upon request from the EWMC. The seismic data stream to be transferred to the EWMC has to be specified with a start and end time. The data transfer will be at a rate allowing a data transmission close to real time.
During service intervals (once per year), all data can be downloaded and saved in international data repositories. In addition, the internal time base of the OBU may be adjusted to UTC. The typical drift of the internal Seascan clock is about 1 ms per day, with drifts being almost linear, permitting a post-retrieval correction. Real-time clock corrections may be implemented at the EWMC with a high degree of confi-dence on the basis of accurate pre-deployment drift measure-ments.
4.3 System hardware
O. Boebel et al.: The GITEWS ocean bottom sensor packages 1777
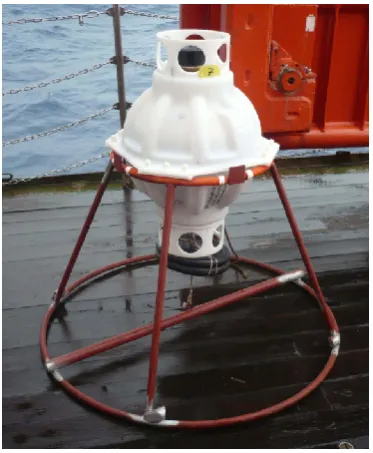
Fig. 20. Sketch and photo showing the OBU just before
deploy-ment.
acoustic modem which also serves as system controller. The OBU (Fig. 20) consists of a custom-built titanium instrument carrier designed to assemble the components described be-low. Titanium was chosen for all components to guarantee minimal corrosion problems. For buoyancy, eight cylindrical floatation bodies made from syntactic foam are used. This syntactic foam is rated for 6000 m of water depth, as are all other components. The in-air weight of the anchor (50 kg) is such, that the weight in water is 20 kg for descent. Af-ter releasing the anchor, the OBU’s buoyancy is 30 kg. This results in a speed through water of 1 m s−1 for descent and ascent. The weight of the instrument in air is 200 kg.
The acoustic release is an IXSEA/Oceano Release RT661, also inside a titanium cylinder. It is mounted in the central position of the OBU. Upon reaching the surface, the OBU will tilt by 90◦and thus ensures that the releaser transducer is still under water to enable ranging between the service vessel and the instrument. As additional relocation aids, a radio beacon, a flash light and a flag are attached to the OBU, see Fig. 20.
Data telemetry, bottom pressure data acquisition and tsunami detection functionality are provided by a HAM.node modem (see Sect. 2) with an integrated 8CB7000-I Parosci-entific absolute pressure sensor. Pressure data are acquired and stored every 15 s. The DART® tsunami detection al-gorithm is used for event detection. Seismic data can be requested from the seismic recorder upon demand from the EWMC.
Both bottom and surface modems as used for the seismic OBU are equipped with directional transducers operating in the frequency range from 11.2 kHz to∼19.2 kHz. In order to achieve the higher data throughput necessary for transmis-sion of seismic data, an m-DPSK modulation scheme is used (see Sect. 2).
The modem is mounted next to the acoustic release and is connected by cables to an external battery pack in a titanium pipe (80 cm long, 15 cm diameter) and to the SEND seismo-corder GEOLON-MTS-M housed in another titanium pipe (62 cm long, 15 cm diameter). The battery capacity for the modem (9000 Wh) and for the data logger (3500 Wh) ensure a lifetime of about 12 months, although the power require-ments for the modem highly depend on the amount of seis-mic data to be transferred. Modem source levels amount to approximately 205, 204, and 200 dBrms re. 1 µPa for power settings of 97%, 90% and 60%, respectively.
The seismocorder GEOLON-MTS-M has been developed by SEND GmbH and provides long-term acquisition and storage of seismological data. Power consumption is highly optimized (less than 150 mW), and the time stability (about 1 ms/d) is provided by a Seascan clock. Data storage is on up to 12 PCMCIA microdiscs or flashcards, each with a maxi-mum capacity of 2 GB. After low pass filtering, the signals from the four seismic channels (three-component seismome-ter and hydrophone) are digitized using Sigma-Delta A/D converters. A final decimation sharp digital low-pass filter is realized in software by the signal processor. The sample rate can be chosen between 1 and 200 samples per second (sps), and the resolution is between 14 bits at 200 sps and 21 bits at 5 sps. The data are further compressed before stored on the PCMCIA devices. The recorder can be parameterized using an ASCII terminal via RS232 interface, and the oscil-lator is synchronized using GPS pulses. After deployment, parameters can be changed from the warning centre through the satellite/acoustic link.
The seismic sensors consist of a deep-sea differential pres-sure gauge V66.3 of the Marine EM Laboratory of Scripps Institution of Oceanography (Cox et al., 1984). This sensor has a frequency band from 20 Hz to 150 s. The seismome-ter is the CMGOBS40T of G¨uralp Systems Limited and is mounted in a 17 cm long titanium pipe (15 cm diameter). This sensor is fixed between the instrument carrier and the anchor. It requires levelling once landed on the seafloor, and this is initiated at a preset time through the data recorder. Levelling can be repeated at pre-set intervals (typically 14 days) to adjust for changes occurring on the instrument car-rier. This seismometer operates in the frequency range from 20 Hz to 40 s.
![Table 1. PACT-BU deployment depths [m according to pressure record], acoustic power settings [%], nominal source level (SL), estimatedtransmission loss (TL) and received levels (RL, all levels in dBrms re](https://thumb-us.123doks.com/thumbv2/123dok_us/8418455.1387033/6.595.310.546.204.348/deployment-according-pressure-acoustic-settings-nominal-estimatedtransmission-received.webp)