A Grey Model for Evaluation of Information
Systems Security
Huawang Shi
School of Civil Engineering, Hebei University of Engineering, Handan, P.R.China Email: [email protected]
Yong Deng
School of Electronics and Information Technology, Shanghai Jiao Tong University, Shanghai, China Email: [email protected]
Abstract—Quantitative security risk evaluation of
information systems is increasingly drawing more and more attention. The purpose of this paper is to propose a novel method integrated grey relational analysis and grey-AHP evaluation to classification for information systems (IS) security. There are, of course, multiplicities of factors that will affect the security evaluation of information systems. Using grey relational analysis, we provided a tool to aid clients and their consultants in estimating or benchmarking the information systems security. It then provides a grey evaluation model of estimating the indicator system of information systems on the basis of the related reference, in which an evaluation methodology based on combination of grey evaluation method and Group-decision AHP method(Grey-AHP) for classifying grey clusters, calculating weights, creating an evaluation matrix and using comprehensive coefficient are presented. An example of practical application is given to show the effectiveness of this method. The result is believed to provide new means and ideas for the evaluation of IS security.
Index Terms—information systems, security evaluation,
grey relational analysis, grey-AHP evaluation
I. INTRODUCTION
The rapid and dramatic advances in information technology (IT) in recent years have without question generated tremendous benefits. At the same time, however, they have created significant, unprecedented risks to government operations. Computer security has, in turn, become much more important as all levels of government utilize information systems security measures to avoid data tampering, fraud, disruptions in critical operations, and inappropriate disclosure of sensitive information. Such use of computer security is essential in minimizing the risk of malicious attacks from individuals and groups. To be effective in ensuring accountability, auditors must be able to evaluate information systems security and offer recommendations for reducing security risks to an acceptable level. To do so, they must possess the appropriate resources and skills.
Your organization may be vulnerable to attack from the outside or the inside if you remain unaware of security issues, simply ignore them or don’t sufficiently manage them. An attack may take down your network or
lead to the theft of sensitive data — customer information, employee information or intellectual property. The ensuing loss of public trust or the failure to comply with regulations could result in severe financial repercussions. A major security breach could also cause irrevocable damage to your organization’s reputation. The benefits of information security assessment are listed as follow[1]:
(1) Provides a clear understanding of current information security risks. (2)Identifies the potential impact of vulnerabilities on your network infrastructure. (3) Raises internal awareness of information security risks. (4)Enables more informed decision-making and identifies the gaps in organizational security controls, policies and processes. (5) Provides a specific, actionable plan to improve overall security posture based on business needs. (6) Enables you to proactively address security issues before they are exploited. (7) Helps to meet regulatory compliance requirements.
The evaluation of information systems (IS) security is a process in which the evidence for assurance is identified, gathered, and analyzed against criteria for security functionality and assurance level. This can result in a measure of trust that indicates how well the system meets particular security target. However, as the information systems complexity increases, it becomes increasingly hard to address security targets and the concept of perfect security proves to be unachievable goal for computer systems developer, testers and users [2][3].
maximization upon given constraints [4]. Decisions become uncertain when there are no enough data to validate them. Such a situation is quite possible at early stage. Combinations of both described decisions types are most widely used [4][5].
To evaluate the information systems security quantitatively, scholar proposed a series of theoretical analysis models. Among these models there are several influential ones, for example, AHP, grey evaluation, fuzzy comprehensive judgment, AHP-fuzzy comprehensive judgment, etc. We should review all the assessment methods in order to find the most suitable method for assessing the security of information systems. Some experts have studied these. We carried out a comprehensive evaluation of a information systems using a grey analysis. First, we confirmed the weight of each index quantitatively by mean s of Group-decision AHP according to an established index system. Then, we defined the elements of an assessment matrix using fuzzy and a quality assessment model for construction project is set up. The advantage of this approach is that it does not rely on the experience of experts an d it can improve the validity and the precision of evaluation. Consequently, it can reflect the quality status of teaching quality in higher institutions.
The purpose of this paper is to introduce and illustrate a new information systems security assessment model called the grey comprehensive evaluation and attribute hierarchy model (AHM). In SectionⅡ of the paper we introduced the grey system theory including grey relational analysis and Grey-AHP evaluation model . In Section Ⅲ of the paper we describe the information systems security evaluation problem and gives the index of information systems security. We apply the grey model to the assessment of information systems security and give an application case. In Section Ⅴ of the paper we conclude content of this paper and outline future directions for research.
II. METHODOLOGY
A. Introduction to Grey System
The Grey System Theory that was developed by Deng [10] is mainly utilized to study system models uncertainty, analyze relations between systems, established models, and forecast and makes decisions [8]. Grey Relational Analysis is utilized to probe the extent of connections between two digits by applying the methodology of departing and scattering measurement to the actual measurement of distance and Grey Relational Analysis is an effective means of analyzing the relationship between two series. This study applies grey relational analysis to measure the similarity between the series.
Nowadays, the black is represented, as lack of information, but the white is full of information. Thus, the information that is either incomplete or undetermined is called Grey.
A system having incomplete information is called Grey system. The Grey number in Grey system represents a number with less complete information. The Grey element represents an element with incomplete information. The Grey relation is the relation with incomplete information. Those three terms are the typical symbols and features for Grey system and Grey phenomenon. There are several aspects for the theory of Grey system [9]:
(1)Grey generation: This is data processing to supplement information. It is aimed to process those complicate and tedious data to gain a clear rule, which is the whitening of a sequence of numbers.
(2)Grey modeling: This is done by step 1 to establish a set of Grey variation equations and Grey differential equations, which is the whitening of the model.
(3)Grey prediction: By using the Grey model to conduct a qualitative prediction, this is called the whitening of development.
(4) Grey decision: A decision is made under imperfect countermeasure and unclear situation, which is called the whitening of status.
(5)Grey relational analysis: Quantify all influences of various factors and their relation, which is called the whitening of factor relation.
(6)Grey control: Work on the data of system behavior and look for any rules of behavior development to predict future’s behavior, the prediction value can be fed back into the system in order to control the system.
B. Grey Relational Analysis
Constitute the grey relational sets: X={x1, x2, …, xm}
The main procedure of GRA is firstly translating the performance of all alternatives into a comparability sequence. This step is called grey relational generating. According to these sequences, a reference sequence is defined. Then, the grey relational coefficient between all comparability sequences and the reference sequence is calculated. Finally, based on these grey relational coefficients, the grey relational entropy between the reference sequence and every comparability sequences is calculated.
We build the grey relational ordinal by the following equations. Determined the number of columns to reference and the number of columns to compare Define xi for the time needed for constructing and operating a correct and perfect product information model by the ith user.
x i0={x i0(1), x i0(2) , … , x i0(l)}, x i0, xij∈Xi
xij={xij(1), xij(2), … , xij(l)}
∆ i0j(k)=│x i0 (k)-xij (k)│
r(x i0(k),
The sets of data must be standardized since the scales of criteria indices differ. Grey relational generating is used to replenish the message from the data by determining regularities and properties in jumbled data. Restated, grey relational generating can reduce the randomization and increase the regularity of data[11-13].
others. Data pre-processing is also necessary when the series scatter range is too large, or when the directions of the target in the series are different. Data pre-processing is a process of transferring the original series to a comparable series. Depending on the characteristics of data series, there are various methodologies of data pre-processing available for the grey relational analysis. We use the following equations to pre-process the two series.
When, xi =
{
xi(j) j=1,2, N}
'
( ) min ( ) max ( ) min ( )
max ( ) ( )
( )
max ( ) min ( )
( )
1
max ( )
i i i
i i i i i i i i
i i i
i
i i
i i
i
x j x j
x j x j
x j x j x j
x j x j
x j c x j c
⎧ − ⎪ ⎪ − ⎪ ⎪ − ⎪ = ⎨ − ⎪ ⎪ − ⎪ − ⎪ − ⎪⎩
,
,
,
(1)Where,
min
ix
i(
j
)
andmax
ix
i(
j
)
Respectively,I
i
=
1
,
2
,
is the minimum and maximum values forthe data sequence
x
iin thej
th item,c
i is the dataseries in the
j
th item of a standard reference value.(min)
(max)
(min)
)
(
)
(
ij ij ij ij ijk
k
x
ω
ω
ω
ω
−
−
=
(2) Where, 1(min) min ( ), (max) max ( ), (
)
1
( )
ij ij ij ij ij
k k
n ij k
k
k
avg
k
n
ω
ω
ω
ω
ω
ω
==
=
=
∑
Πωij(k) ∈ωij] k ∈ K={1,2,…, l},i={1, 2,
…, m}, j ∈ J={1, 2, …, n}.
Then
⎥
⎥
⎥
⎥
⎦
⎤
⎢
⎢
⎢
⎢
⎣
⎡
=
)
(
)
2
(
)
1
(
)
(
)
2
(
)
1
(
)
(
)
2
(
)
1
(
2 2 2 1 1 1l
x
x
x
l
x
x
x
l
x
x
x
x
in in in i i i i i i i (3) After data pre-processing is carried out, a grey relational coefficient can be calculated with the pre-processed series. The gray correlation coefficient between the number of columns of comparison and the reference number of columns were calculated The grey relational coefficient is defined as follows:xij(k))=
)
(
max
max
)
(
)
(
max
max
)
(
min
min
k
k
k
k
ioj k j ioj ioj k j ioj k j∆
+
∆
∆
+
∆
ζ
ζ
(5)The gray correlation evaluation indicators are as follows:
r(x i0, xij)=
∑
= l k l 11
r(x i0(k), xij(k)) (6)
So get gray relational matrix:
⎥ ⎥ ⎥ ⎥ ⎦ ⎤ ⎢ ⎢ ⎢ ⎢ ⎣ ⎡ = ) , ( ) , ( ) , ( ) , ( ) , ( ) , ( ) , ( ) , ( ) , ( 0 2 0 1 0 2 20 22 20 21 20 1 10 12 10 11 10 mn m m m m m n n x x r x x r x x r x x r x x r x x r x x r x x r x x r
r (7)
In gray correlation matrix, each row vector element indicates the correlation degree of target sequences associated with its reference.
In equation (7), greater correlation coefficient means that time needed for users to establish an accurate and complete product information model and finish corresponding operation will have less difference from the expectation time. But there are many Gray coefficient calculated, each factor can only reflect the match level of corresponding construction duration model and actual construction duration model. It can not indicate the construction duration as a whole.
C. Grey-AHP Evaluation Model
1) Method of Group-decision Analytical Hierarchy Process(AHP): The Analytic Hierarchy Process (AHP) was developed by Thomas L. Saaty[19,20] in the 1970s and has been extensively studied and refined since then. It is to express a complex decision-making problem as a sequential step-up hierarchy structure, compute the comparatively weightiness measurement of diversified decision-making behaviour, scheme and decision-making object under different rule and the whole rule, and then rank them according to the measurement, providing decision-making evidence for the decision-makers[20].
The steps to solve the real problems using AHP method areas follows:
Model the problem as a hierarchy containing the decision goal, the alternatives for reaching it, and the criteria for evaluating the alternatives.
Establish priorities among the elements of the hierarchy by making a series of judgments based on pairwise comparisons of the elements. For example, when comparing potential real-estate purchases, the investors might say they prefer location over price and price over timing.
Synthesize these judgments to yield a set of overall priorities for the hierarchy. This would combine the investors' judgments about location, price and timing for properties A, B, C, and D into overall priorities for each property.
Check the consistency of the judgments.
Come to a final decision based on the results of this process.
According to the above steps to achieve the ultimate weight vector of every decision-maker respectively.
t
k
w
w
w
Assuming there is
t
decision-makers, the number of factors to be evaluated arem
, for each given a series the determining matrix of decision-makers, then by calculating the weighted average base sequencing vector the relative weight vector can be got as:(
)
Tm
ϖ
ϖ
ϖ
ϖ
=
1,
2,
…
,
.m j m i i j
j , 1,2, ,
1 … = =
∑
=θ
θ
ϖ
(9)( ) ( ) ( )
tjt j
j
j
w
w
w
λ λ
λ
θ
1 2…
2 1
⋅
=
(10) Where, t t kk
λ
λ
λ
λ
1
,
1,
2,
,
1
…
=
∑
= is weight coefficient of decision-maker, Specially,
t t
1
2
1 =
λ
= =λ
=λ
…. Finally, the standard deviation was calculated as follow:
(
)
∑
=−
−
=
t k j jk jw
t
1 21
1
ϖ
σ
(11)When
σ
j<
0
.
5
, the group-decision is acceptable,and right-vector of the indicators is feedback to each decision-makers. If a number of decision-makers accept the weight vector, then calculation end, otherwise, ask decision-makers to propose amendments to judge views, and so repeatedly, until the weight vector is satisfactory to decision-makers.
2) Determining Grade Rank Standard of Indices:
U
represents the first level evaluation factorsU
icomposed of a collection as
}
,
,
,
{
U
1U
2U
6U
=
.V
j(
i
=
1
,
2
,
6
)
representsthe factors in the second level consisting of a collection
of
V
i=
{
V
i1,
V
i2,
,
V
in}
.The grade rank vector ofevaluation is :
( )
(
)
(
)
(
)
}
{
1best
2good
3average
4worse
V
=
ν
,
ν
,
ν
,
ν
Evaluation index
U
is a qualitative index. It is transformed to the quantification index through establishing grade rank standard of evaluation indices. Considering evaluation grade is divided into 4 levels, the grade and the evaluation points of each ranks is 4, 3, 2 and 1. If the grade between two adjacent grades, The corresponding score value of 3.5, 2.5, and 1.5 points. Specific grades are given by experts based on experience.3) Determining Weight of Indexes
U
iandV
ij: It is a very important step to determine the weights of each indices of teaching quality, because the elements of the quality of teaching quality take different proportion in the comprehensive evaluation. There are many ways to determine the weights, in this paper, Method of
Group-decision Analytical Hierarchy Process (AHP) was adopted(discussed in part A).
4) Establishing the Appraisal Grey Cluster : The committee of experts scoring various indicators in accordance with measured values and professional experience. Suppose the serial number of appraisal grey is
e
,
e
=
1
,
2
,
3
,
4
,
namely has 4 appraisal grey cluster. The first grey cluster is “best” (e=1), suppose greynumber
⊗
1∈
[
4
,
∞
)
, the corresponding grey albinismweight function is
f
1. The second grey cluster is “better” (e=2), suppose grey number⊗
2∈
[
0
,
3
,
6
]
, the corresponding grey albinism weight function isf
2. The first grey cluster is “average” (e=3), suppose grey number⊗
3∈
[
0
,
2
,
4
]
, the corresponding grey albinism weight function isf
3. The first grey cluster is “worse” ( e=4 ) , suppose grey number⊗
4∈
[
0
,
1
,
2
]
, the corresponding grey albinism weight function isf
4.( )
[
[ ]
)
[
)
⎪
⎪
⎩
⎪⎪
⎨
⎧
∞
∉
∞
∈
∈
=
,
0
,
0
,
4
,
1
4
,
0
,
4
1 ijm ijm ijm ijm ijmd
d
d
d
d
f
(12)( )
[ ]
[ ]
[ ]
⎪
⎪
⎩
⎪
⎪
⎨
⎧
∉
∈
−
∈
=
6
,
0
,
0
6
,
3
,
3
6
3
,
0
,
3
2 ijm ijm ijm ijm ijm ijmd
d
d
d
d
d
f
(13)( )
[ ]
[ ]
[ ]
⎪
⎪
⎩
⎪
⎪
⎨
⎧
∉
∈
−
∈
=
4
,
0
,
0
4
,
2
,
2
4
2
,
0
,
2
3 ijm ijm ijm ijm ijm ijmd
d
d
d
d
d
f
(14)( )
[ ]
[ ]
[ ]
⎪
⎩
⎪
⎨
⎧
∉
∈
−
∈
=
2
,
0
,
0
2
,
1
,
2
1
,
0
,
1
4 ijm ijm ijm ijm ijmd
d
d
d
d
f
(15)
5) Calculating Grey Appraisal Weight Vector and Weight Matrix :
The grey appraisal weight of vector of e grey cluster is marked
x
ije:
( )
∑
∑
= ==
=
6 1 1,
e ije ij ijm p m eije
f
d
x
x
x
Considering 4 grey cluster ,namely e=1,2,3,4, for each grey cluster, grey appraisal weight vector of evaluation indices
V
ij is marked asr
ij:r
ij=
(
r
ij1,
r
ij2,
r
ij3,r
ij4)
andthe evaluation weight matrix is
R
i,then:
⎥
⎥
⎥
⎥
⎥
⎦
⎤
⎢
⎢
⎢
⎢
⎢
⎣
⎡
=
⎥
⎥
⎥
⎥
⎥
⎦
⎤
⎢
⎢
⎢
⎢
⎢
⎣
⎡
=
4 3 2 1
24 23 22 21
14 13 12 11
2 1
i i i i
i in in in in
i i i i
i i i i
n i i
i
r
r
r
r
r
r
r
r
r
r
r
r
r
r
r
R
(17)If the weight of
q
inr
ij is the biggest,(
1,
2,
3,
4)
max
ij ij ij ij ijqr
r
r
r
r
=
, then indices
V
ij belong to the grey cluster ofq
6) Synthetic Appraisal
For evaluation indices
V
i, make a synthetic evaluation, recording its synthetic evaluation resultB
i, then:
B
i=
A
i⋅
R
i=
(
b
i1,
b
i2,
b
i3,
b
i4)
According to synthetic evaluation result
B
iofV
i, the grey appraisal weight coefficient matrix of appraisal grey cluster to indexU
, is supposed asR
:⎥
⎥
⎥
⎥
⎦
⎤
⎢
⎢
⎢
⎢
⎣
⎡
=
⎥
⎥
⎥
⎥
⎦
⎤
⎢
⎢
⎢
⎢
⎣
⎡
=
44 43 42 41
34 33 32 31
24 23 22 21
14 13 12 11
4 3 2 1
b
b
b
b
b
b
b
b
b
b
b
b
b
b
b
b
B
B
B
B
R
(18)Then, for evaluation indices
U
, we make a synthetic evaluation, its synthetic evaluation result records is:(
b
1,
b
2,
b
3,
b
4)
R
A
B
=
⋅
=
(19)According to synthetic evaluation result
B
, Under theprinciple of the largest belonging the gray grade of information systems security evaluated is determined.
Ⅲ. APPLICATION CASE
A Example1Describe
Risk is a function of the likelihood of a given threat-source’s exercising a particular potential vulnerability, and the resulting impact of that adverse event on the organization. Risk assessment is the first process in the
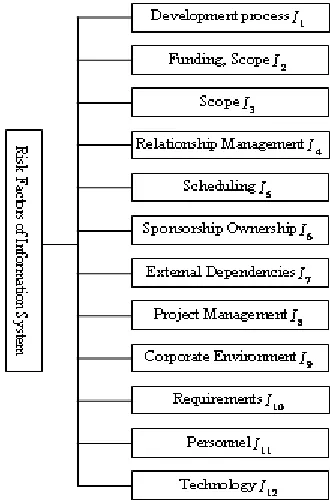
risk management methodology. In order to verify the validity of proposed model, we select a number of information systems (IS) to carry out risk assessment. Using this method to classification grade of IS security, and the results were compared with the actual situation. The indexes reflecting Development process, Funding, Scope, Relationship Management, Scheduling, Sponsorship Ownership, External Dependencies, Project Management, Corporate Environment, Requirements, Personnel, Technology factor were adopt as shown in Fig.1.
Figure 1. The security index system of IS
B Grey Relational Analysis on Information Systems Security
The data used in this study was collected from construction industry clients and consultants.
TABLE I. PRIMARY DATA
Indices Best Good Qualified Unqualified
Development process 0.23 0.22 0.37 0.18
Funding 0.23 0.20 0.32 0.25
Scope 0.22 0.12 0.40 0.26
Indices Best Good Qualified Unqualified
Scheduling 0.34 0.26 0.20 0.10
Sponsorship Ownership 0.18 0.21 0.37 0.24
External Dependencies 0.25 0.35 0.29 0.11
Project Management 0.27 0.36 0.13 0.24
Corporate Environment 0.16 0.40 0.24 0.20
Requirements 0.24 0.28 0.31 0.17
Personnel 0.27 0.26 0.36 0.11
Technology factor 0.38 0.20 0.24 0.18
TABLE II. THE ANALYTICAL RESULTS
1 2 3 4 mink ∆i( )k max i( ) k ∆ k
Development process 0.15 0.04 0.12 0.13 0 0.11
Funding 0.12 0.20 0.13 0.04 0.05 0.18
Scope 0.04 0.10 0.12 0.13 0.03 0.17
Relationship Management 0.12 0.09 0.21 0.07 0.07 0.12
Scheduling 0.09 0.17 0.14 0.11 0.11 0.15
Sponsorship Ownership 0.14 0.09 0.11 0.05 0.07 0.12
External Dependencies 0 0.04 0.01 0.02 0 0.14
Project Management 0.15 0.14 0.19 0.12 0.09 0.16
Corporate Environment 0.06 0.17 0.12 0.05 0.03 0.18
Requirements 0.09 0 0.21 0.14 0 0.23
Personnel 0.04 0.17 0.13 0.16 0.12 0.18
Technology factor 0.16 0.02 0.06 0.08 0.16 0.17
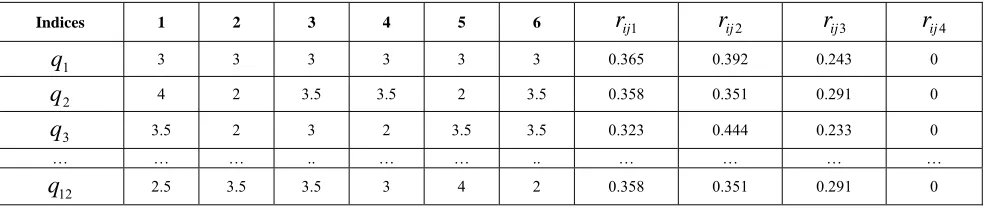
TABLE III. THE RESULTS OF EXPERTS APPRAISAL AND GREY WEIGHT
Indices 1 2 3 4 5 6
r
ij1r
ij2r
ij3r
ij4 1q
3 3 3 3 3 3 0.365 0.392 0.243 02
q
4 2 3.5 3.5 2 3.5 0.358 0.351 0.291 03
q
3.5 2 3 2 3.5 3.5 0.323 0.444 0.233 0… … … .. … … .. … … … …
12
q
2.5 3.5 3.5 3 4 2 0.358 0.351 0.291 0The analytical correlation results
r
i are presented below:10
r
>r
2>r
12 >r
1 >r
9>r
6>r
4>r
8>r
7>r
3 >r
11>r
5Therefore, the factors were ranked in Development process, Scheduling, Funding, Scope, Project Management, Sponsorship Ownership, Requirements, External Dependencies, Corporate Environment, Relationship Management, Personnel, Technology factor.
C Information Systems Security Assessment
1) Establishing Appraisal Indices System : The results of experts appraisal are show in Fig.2.
2) Indices System Weight with AHM :
model of game is that it’s matrix does not problem of “testing of consistency."
In this paper, the authors analyzed the influential factors of the urea reactor risk and constructed the AHM. Based on the results, the weights of attributes of bids were given. The n×n pairwise comparison matrix of AHM can be got by converted AHP matrix. Then we can calculate the weighting value of the index. By using measure judgment matrix of AHM, the specific process is as follows:
Step1: construct the matrix of judgement matrix We use the Law on 1-9 scale proposed by Satty when construct The n×npairwise comparison matrix of AHM. The n×n pairwise comparison matrix is
A
=
( )
a
ij n×n, wherea
ijis the importance comparison with programi
P
and programP
ja
ij meeta
ij≥
0
,)
,
,
2
,
1
,
(
/
1
a
i
j
n
a
ij=
ji=
。.⎥
⎥
⎥
⎥
⎦
⎤
⎢
⎢
⎢
⎢
⎣
⎡
=
22 2
1
2 22
21
1 12
11
a
a
a
a
a
a
a
a
a
A
n n
n n
(20)
Step2: Convert the n×npairwise comparison
The judgment matrix to the n×npairwise comparison
measure matrix are as follow:
⎪ ⎪ ⎩ ⎪ ⎪ ⎨ ⎧
= +
= = +
=
k a
k
a a a k
k
u
ij ij ij ij
ij
/ 1 )
1 /( 1
0
1 5
. 0
1 )
1 /(
(21)
Suppose u is the n×npairwise comparison matrix.
⎥
⎥
⎥
⎥
⎦
⎤
⎢
⎢
⎢
⎢
⎣
⎡
=
22 2
1
2 22
21
1 12
11
u
u
u
u
u
u
u
u
u
u
n n
n n
(22)
Step3: calculate the weight
∑
=
= = n
j ij
i u i n
f
1
) , , 2 , 1
( (23)
w
i=
f
i/[
n
(
n
−
1
)
/
2
](
i
=
1
,
2
,
,
n
)
(24) We can get the weight vectors as follow:
W
=
(
w
1,
w
2,
,
w
n)
(25)The index weight set of
U
iandV
ij are determined asfollow:
A=(0.42, 0.25, 0.20, 0.08, 0.05);
When, e=1
( )
( )
( )
( )
( )
( )
111 1 1 1 1
1 1
2.5 3.5 2.5 2.5
2.5 3
x f f f f
f f
= + + + +
+
=0.725+0.625+0.725+0.625+0.7255+0.75=4.125 When,e=2,
( )
( )
( )
( )
( )
( )
112 2 2 2 2
2 2
3.5
2.5
2
2.5
3.5
3
x
f
f
f
f
f
f
=
+
+
+
+
+
=1+0.8333+0.6667+0.8333+0.8333+1=5.1666 Similarly, e=3,
x
113=3.75; e=4,x
114=0 .The objects appraised the total number belonging to various evaluation grey cluster is
11
x
=4.125+5.1666+3.75=13.0416 e=1,r
111=3.125/12.0316=0.260 ; e=2,r
112=5.2876/12.0316=0.4395e=3,
r
113=3.75/12.0316=0.312; e=4,r
114=0The index weight set is:
r
11=(0.326, 0.386, 0.296, 0) 3) Synthetic Evaluation:Grey synthetic appraisal result for this information system is as follow:
R
A
B
=
⋅
=(0.32562, 0.41168, 0.2582, 0)According to the principle of the principle of the largest belonging the gray grade of teaching quality evaluated is determined as “better”.
Ⅳ. CONCLUSIONS
Grey Relational Analysis is utilized to probe the extent of connections between two digits by applying the methodology of departing and scattering measurement to the actual measurement of distance and Grey Relational Analysis is an effective means of analyzing the relationship between two series. This study applies grey relational analysis to measure the similarity between the series. This paper probes the range of factors affecting construction project duration through a literature review and a pilot survey in. The main variables shall consist of Development process, Funding, Scope, Relationship Management, Scheduling, Sponsorship Ownership, External Dependencies, Project Management, Corporate Environment, Requirements, Personnel, Technology factor. Though treatment of analytical correlation analysis, the indexes were ranked in Development process, Scheduling, Funding, Scope, Project Management, Sponsorship Ownership, Requirements, External Dependencies, Corporate Environment, Relationship Management, Personnel, Technology factor
through condensing the evaluation indicator system. As the evaluation work of the first two items of the evaluation targets which are established by analysis has been basically finished, the using quality is the only major task in the work of the unified check and also the hard point of grading evaluation. Focusing on the sub-issues, the gray comprehensive evaluation model used to evaluate the information systems security is established and the comprehensive evaluation results of the teaching quality is obtained; finally, we will be very easy to get a comprehensive information systems security evaluation by combining the early results of other evaluation. Thus the assessment of information systems security will be more objective. The quantitative and procedural way of evaluating the using quality of the information systems security is easy for programming and serves for the real institutions managers for decision-making in the management. This paper finally makes the security of information systems objectives are effectively controlled. It is approved by instance: we can get the good affection by using grey hierarchy evaluation method.
ACKNOWLEDGMENT
This paper is partially supported by Program for New Century Excellent Talents in University (NCET-08-0345), National Natural Science Foundation of China (60874105), Shanghai Rising-Star Program (09QA1402900), Aviation Science Foundation 20070511001), and the Chenxing Scholarship Youth Found of Shanghai Jiao Tong University (T241460612).
REFERENCES
[1] National State Auditors Association and the U. S. General Accounting Office. Management Planning Guide for Information Systems Security Auditing. December 10, 2001.
[2] Information Security Assessment. www.iss.net.
[3] Job Asheri Chaula, Louise Yngstrom, and Stewart Kowalski. Security metrics and evaluation of information systems security.
[4] H.Iranmanesh, S.Nazari Shirkouhi, and M. R. Skandari. Risk Evaluation of Information Technology Projects Based on Fuzzy Analytic Hierarchal Process World Academy of Science, Engineering and Technology 40, 2008.351-357. [5] CCIMB-2004-01-003, 2004, Common Criteria for
Information Technology Security Evaluation: Security assurance requirements and Protection Profiles Version2.2 [6] Common Methodology for Information Technology
Security Evaluation Methodology Version 21999,
[7] Olegas Vasilecas, Algis Saulis, Saulius Dereskeviius. Evaluation of information systems procurement.
[8] Wu, H.H., “The Introduction of Grey Analysis,” Gauli Publishing Co., Taipei, 1996.
[9] Jie Cui, Yao-Guo Dang and Si-Feng Liu.Study on Novel Property of Some Grey Relational Analysis Models. ISSN 1028-9488 Journal of Grey System, Vol. 12, No. 2, (2009) 83-88.
[10]Deng, J., Introduction to Grey System Theory. 1998 [11]Chin-Tsai Lin. Hierarchical Clustering Analysis Based on
Grey Relation Grade. Information and Management Sciences, Vol. 16, No. 1, March,,2005.
[12]Wong, C. C. and Lai, H. R., A new grey relational measurement, The Journal of Grey System, Vol.12, No.4, pp.341-346, 2000.
[13]Hsia, K. H. and Wu, J. H., A study on the data preprocessing in grey relation analysis, Journal of Chinese Grey System, Vol.1, pp.47-53, 1998.
[14]Deng, J. Introduction to grey system theory. The Journal of Grey System, 1,1-24.1989
[15]G.W.Wei, Y.WEI, model of grey relational analysis for interval multiple attribute decision making with preference information o alternatives, Journal of Management Science, No.1,pp.158-162.2008.
[16]Z.X.LI, W.J.Niu, theory and application of system multi-level grey entropy optimization, Systems Engineering-Theory &Practice, No.8,pp.43-49.2007.
[17]Y.L.Ma, J.Y.Wang. Comprehensive evaluation of grey correlation analysis based on ideal plans, Systems Engineering and Electronics, No.24,pp.51-54.2002.
[18]Sun W., Guo H.(1994) Grey Assessment for Appraising the Stage of Tea Seedling, The Journal of Grey System,
Vol6. No4, p.289-296. Tsai L. L., Chiu S. W., and Wu H. J.(2002)
[19]Thomas L. Saaty "Response to Holder's Comments on the Analytic Hierarchy Process" The Journal of the Operational Research Society, Vol. 42, No. 10 (Oct., 1991), pp. 909-914
[20]Holder, R.D., Some Comment on the Analytic Hierarchy Process, Journal of the Operational Research Society, 1990, 41, 11 1073-1076.
[21]A Study of Grey Relational Analysis for Synthetic Evaluation of Eutrophic Feitsui Reservoir, The Journal of Grey System, Vol. 14, No. 3, p.251-258.
[22]Gregory S. Sadesky.Standard Setting Using the Attribute Hierarchy Model Matthew M. Gushta American Institutes for Research
[23]J.L.Deng.Basic method of gray system[M] Huazhong University of Science and Technology Publishing House.1981.