International Journal of Pharmaceutical Research & Allied Sciences, 2017, 6(4):107-115
Research Article
ISSN : 2277-3657
CODEN(USA) : IJPRPM
Effect of Increased Daily Food Intake and Resistance Training on Body
Composition, Body Dimension, Strength and Metabolic Variables among
Underweight Males
Almoslim, H.A.
1*, Ibrahim S.
1, Allen J.
1, Abu Hilal H.
11Department of Physical Education, King Fahd University of Petroleum & Minerals, Dhahran, Saudi Arabia,
P.O. Box 192 KFUPM, Dhahran, 31261
*Email:almoslim@kfupm. edu. sa
______________________________________________________________________________________
ABSTRACT
The aim of this study was to treat underweight by combining training and diet. 47 underweight college males were divided into, a Combined Resistance Increased Food Intake Group-1 (CRIFIG-1), a Combined Resistance Normal Food Intake 2 (CRNFIG-2), an Increased Food Intake 3 (IFIG-3), and a Normal Food Intake Group-4 (NFIG-Group-4). The resistance training (RT) was for 30 min/session twice a week, for 8 weeks. Mean, standard deviation, Paired t-test, ANOVA and repeated measures were used to analyze data. The significance level was 0.05. CRIFIG-1 and CRNFIG-2 reported significant increases in all Resistance Measures (RM) (P ˂ 0.05). The Total Daily Energy Requirement (TDER) displayed higher values than the Total Daily Food Intake (TDFI) in all groups (P ≤ 0.001). It was concluded that the RT had significant effects on the training groups in all RM (paired t-test); however, all underweight subjects showed an energy deficiency at the end.
Keywords: Energy Requirment, Energy Expenditure, Food Intake, Resistance Training, Underweight
_____________________________________________________________________________________________
INTRODUCTION
Underweight is a health problem, associated with several medical risk factors such as hyperthyroidism [1], diet
20% [28]. In 1RM PD an extension of 6% was confirmed [26]. In BM, gains of 7% [27] and 1% [33] were declared for underweight subjects; however, similar outcome was indicated in untrained men [24]. FFM enlarged by 2, 1 and 3% [27,33,34] respectively. TBW showed remarkable growth by 9% [33]. To our knowledge, no study was carried out to treat the underweight subjects using combined RT with increased TDFI. Further, no study calculated the TDER before the start of training and asking the subject to increase his TDFI, then comparing the actual TDFI with the TDER. Therefore, the objective of this research was to compare the impact of combined increased TDFI with RT on BC, BD, MM and RM among underweight males. It was hypothesized that the CRIFIG-1 would take over CR2 and 4 in MM and IFIG-3 and 4 in RM. CR2 also would lead over IFIG-3 and NFIG-4 in RM.
MATERIALS & METHODS
To address the study problem, the investigators depended on two factors, namely RT and increased TDFI. The RT was performed 8 weeks, twice a week for 30 min per session combined with an increase TDFI. The TDER and the TDFI of all subjects were calculated before the start of training. The actual TDFI was compared with the actual TDER. The actual TDER was found more than the actual TDFI, the subjects were asked to increase their TDFI to equalize their TDER or more.
Subjects
The Ethics Committee of KFUPM gave its approval for this study to collect data on human subjects. A written consent was taken from all subjects and they were free to withdraw in case they felt any discomfort during the study. Forty seven, underweight sedentary males from King Fahd University of Petroleum & Minerals aged 18 to 22 years participated in this study. The selection of subjects depended on the body mass index of less than 18.5 kg/m2. The
participants were catogerized into four groups, a Combined Resistance Increased Food Intake Group-1 (CRIFIG-1, n = 16), a Combined Resistance Normal Food Intake Group-2 (CRNFIG-2, n = 14) an Increased Food Intake Group-3 (IFIG-3, n = 9), and a Normal Food Intake Group-4 (NFIG-4, n = 8). Adaptation phase took place one week before the start of testing to familiarize subjects with the testing and the procedures of training. All subjects took part in the warm up and cool down sessions before and after the testing and the training for 5 minutes each. Health and fitness questionnaires were provided for all participants to understand, note the subject's health status, physical activity and food habits.
Procedures and Measurement
The current study was undertaken from February to April (8 weeks) in the KFUPM Gymnasium.
The body composition (BC) such as H; was measured while, the subject was barefooted by a Stadiometer to the nearest cm and BM, BMI, BF%, FFM and TBW were measured by TANITA DC430 MAP, Japan. The body dimension (BD) circumferences of calf (right & left), Thigh (right & left), shoulders, and chest were measured by a tape. The one repetition maximum (1RM) test was assessed for all groups in seated LP, horizontal CP, seated SP, seated LE, and seated PD [36]. The metabolic measurements (MM) were assessed at week 1, 3 and 6 for all groups. The total daily energy requirement (TDER) was calculated at week 1, 3 and 6 (21), as follows:
standard deviation were calculated for all values using SPSS version 16.0 software. The Paired t-test was used to identify any significant difference within each group independently for the dependent variables. To compare the differences between all groups at pre-test, post-test, and mean differences (post-tests – pre-tests), the ANOVA was used. The repeated measures were utilized to find out the main effect for group, time and the interaction effect of time by groups for the MM. Scheffe test was used to distinguish the differences between unequal sample size groups. The level of confidence was set at P ≤ 0.05.
RESULTS
80 subjects (n = 20 in each group) participated at the beginning of the study, but several of them dropped out due to various reasons and 47 participants completed the study.
Body Composition (BC)
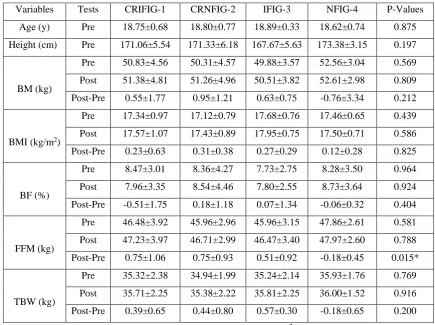
Table 1 of BC showed similar values between groups at pre and post-tests (P ˃ 0.05). CRIFIG-1 and CRNFIG-2 had greater mean differences (post-pre) than IFIG-3 and NFIG-4 in FFM (P ˂ 0.016); however, no changes were
observed in the remaining variables (P ˃ 0.05). Increases of 1.6% (P = 0.013) in FFM and 1.1% in TBW (P = 0.031) were shown in CRIFIG-1. CRNFIG-2 rose by 1.8% in BM (P = 0.009), 1.8% in BMI (P = 0.008) and 2.2% in FFM (P = 0.008). IFIG-3 elevated by 1.2% in BM (P = 0.038), 1.5% in BMI (P = 0.027) and 1.6% in TBW (P = 0.001), but no changes were reported for NFIG-4 in all BC variables (P ˃ 0.05).
Table 1- Body Composition
Variables Tests CRIFIG-1 CRNFIG-2 IFIG-3 NFIG-4 P-Values
Age (y) Pre 18.75±0.68 18.80±0.77 18.89±0.33 18.62±0.74 0.875
Height (cm) Pre 171.06±5.54 171.33±6.18 167.67±5.63 173.38±3.15 0.197
BM (kg)
Pre 50.83±4.56 50.31±4.57 49.88±3.57 52.56±3.04 0.569
Post 51.38±4.81 51.26±4.96 50.51±3.82 52.61±2.98 0.809
Post-Pre 0.55±1.77 0.95±1.21 0.63±0.75 -0.76±3.34 0.212
BMI (kg/m2)
Pre 17.34±0.97 17.12±0.79 17.68±0.76 17.46±0.65 0.439
Post 17.57±1.07 17.43±0.89 17.95±0.75 17.50±0.71 0.586
Post-Pre 0.23±0.63 0.31±0.38 0.27±0.29 0.12±0.28 0.825
BF (%)
Pre 8.47±3.01 8.36±4.27 7.73±2.75 8.28±3.50 0.964
Post 7.96±3.35 8.54±4.46 7.80±2.55 8.73±3.64 0.924
Post-Pre -0.51±1.75 0.18±1.18 0.07±1.34 -0.06±0.32 0.404
FFM (kg)
Pre 46.48±3.92 45.96±2.96 45.96±3.15 47.86±2.61 0.581
Post 47.23±3.97 46.71±2.99 46.47±3.40 47.97±2.60 0.788
Post-Pre 0.75±1.06 0.75±0.93 0.51±0.92 -0.18±0.45 0.015*
TBW (kg)
Pre 35.32±2.38 34.94±1.99 35.24±2.14 35.93±1.76 0.769
Post 35.71±2.25 35.38±2.22 35.81±2.25 36.00±1.52 0.916
Post-Pre 0.39±0.65 0.44±0.80 0.57±0.30 -0.18±0.65 0.200
*: Significant for mean difference, y: years, Kg: kilogram, Kg/m2: kilogram per square meter,
Body Dimension (BD)
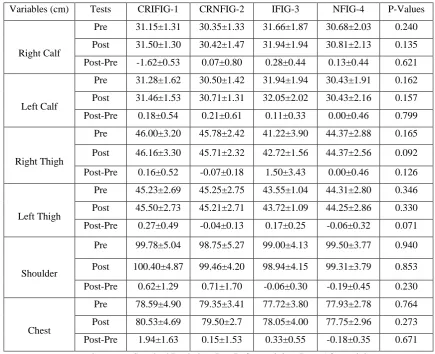
Table 2 of BD exhibited no changes between groups before and after training (P ˃ 0.05) or when the post-tests were subtracted from the pre-tests (P ˃ 0.05); in addition, no changes were noticed in each group independently (P ˃ 0.05).
Table 2- Body Dimension
Variables (cm) Tests CRIFIG-1 CRNFIG-2 IFIG-3 NFIG-4 P-Values
Right Calf
Pre 31.15±1.31 30.35±1.33 31.66±1.87 30.68±2.03 0.240
Post 31.50±1.30 30.42±1.47 31.94±1.94 30.81±2.13 0.135
Post-Pre -1.62±0.53 0.07±0.80 0.28±0.44 0.13±0.44 0.621
Left Calf
Pre 31.28±1.62 30.50±1.42 31.94±1.94 30.43±1.91 0.162
Post 31.46±1.53 30.71±1.31 32.05±2.02 30.43±2.16 0.157
Post-Pre 0.18±0.54 0.21±0.61 0.11±0.33 0.00±0.46 0.799
Right Thigh
Pre 46.00±3.20 45.78±2.42 41.22±3.90 44.37±2.88 0.165
Post 46.16±3.30 45.71±2.32 42.72±1.56 44.37±2.56 0.092
Post-Pre 0.16±0.52 -0.07±0.18 1.50±3.43 0.00±0.46 0.126
Left Thigh
Pre 45.23±2.69 45.25±2.75 43.55±1.04 44.31±2.80 0.346
Post 45.50±2.73 45.21±2.71 43.72±1.09 44.25±2.86 0.330
Post-Pre 0.27±0.49 -0.04±0.13 0.17±0.25 -0.06±0.32 0.071
Shoulder
Pre 99.78±5.04 98.75±5.27 99.00±4.13 99.50±3.77 0.940
Post 100.40±4.87 99.46±4.20 98.94±4.15 99.31±3.79 0.853
Post-Pre 0.62±1.29 0.71±1.70 -0.06±0.30 -0.19±0.45 0.230
Chest
Pre 78.59±4.90 79.35±3.41 77.72±3.80 77.93±2.78 0.764
Post 80.53±4.69 79.50±2.7 78.05±4.00 77.75±2.96 0.273
Post-Pre 1.94±1.63 0.15±1.53 0.33±0.55 -0.18±0.35 0.671
cm: centimeter, ±: Standard Deviation, Pre: Before training, Post: After training, Post-Pre: Mean Differences, P-values: probability of significance (ANOVA)
Resistance Measures (RM)
In 1RM SP (Figure 1a), CRIFIG-1 increased by 19.9% (P ˂ 0.001), CRNFIG-2 by 16.8% (P = 0.000), while, IFIG-3 and NFIG-4 had no changes (P ˃ 0.05). There were also no differences between groups at pre, post or post-pre tests
(P ˃ 0.05). In 1RM LP, CRIFIG-1 had greater mean differences (post-pre) than IFIG-3 (P ˂ 0.011) and NFIG-4 (P ˂ 0.001). CRNFIG-2 also displayed higher mean difference than NFIG-4 (P ˂ 0.006). CRIFIG-1 increased by 38.8%
(P ˂ 0.001) and CRNFIG-2 by 45.9% (P ˂ 0.001). While, no differences were presented between or within IFIG-3 and NFIG-4 (P ˃ 0.05) (Figure 1b). 1RM LE (Figure 1c) exposed that CRIFIG-1 and CRNFIG-2 had higher mean differences than IFIG-3 (P ˂ 0.05) and NFIG-4 (P ˂ 0.05). CRIFIG-1 enlarged by 40.3% (P ˂ 0.001) and CRNFIG-2
by 50.3% (P ˂ 0.003); however, IFIG-3 and NFIG-4 revealed similar results (P ˃ 0.05). In Figure 1d, the 1RM PD illustrated that CRIFIG-1 and CRNFIG-2 had enormous mean differences than IFIG-3 (P ˂ 0.05) and NFIG-4 (P ˂ 0.05). CRIFIG-1 raised by 23.4% (P ˂ 0.001), CRNFIG-2 by 34.3% (P ˂ 0.001), but, IFIG-3 and NFIG-4 had no
a b
c
d
e
Metabolic Measures (MM)
There were no training effects on TDER and TDEE for groups (P ˃ 0.05) or for time (P ˃ 0.05) and no interaction of time by groups (P ˃ 0.05) (Figure 2a, 2b, respectively). The TDFI revealed a training effect for time (P ˂ 0.001); week 3 and 6 showed greater total values than week 1 (P ˂ 0.05); however, there was no change between week 3 and 6 (P ˃ 0.05). There was also no training effect for groups (P ˃ 0.05). Besides, there was no interaction effect of
time by groups (P ˃ 0.05) (Figure 2c). As seen in Figure 2d, the TDER showed higher values than the TDFI in
CRIFIG-1, CRNFIG-2, IFIG-3 and NFIG-4 (P ˂ 0.001). It is also stated that IFIG-3 had a higher value in TDEE in comparison with the TDFI (P ˂ 009); however, there were no changes for the remaining groups (P ˃ 0.05). In
addition, all groups confirmed greater values in TDER in contrast with TDEE (P ˂ 0.001).
a b
c d
DISCUSSION
Our study assumed that the underweight subjects who combined increased TDFI with RT will increase their BC, BD and MM. Our subjects were genetically underweight and had a low appetite to eat enough food. They have been underweight since birth to the age of 18 which structured their life style deeply. These complications were the limitations in this study. Our findings indicated that similar training effects were observed for BC and BD measures between and within groups as indicated by Campos et al. (2002). But Bratland-Sanda et al. (2012) and Habibzadeh, (2011) showed increases of 7 and 1%, respectively in BM. In addition, significant rises in FFM were noticed by 2% [27], 3% [33] and 1% [34]. In TBW, a meaningful increase of 9% was found [34]. Similar changes were confirmed when the TDFI was compared with the TDEE or the TDER in our study, which are in line with Naclerio et al. (2013), Mayhew et al. (2010) and Hermassi et al. (2011). However, several studies reported greater TDEE than TDFI [3;5,7,11]. TDFI of 1904 kcal/d and TDEE of 2153 kcal/d were seen in elite female soccer players with a BMI of 22.1 kg/m2 [9]. The elite Kenyan endurance runners with a BMI of 18.3 kg/m2 registered 3146 kcal/d of TDFI
and 3492 kcal/d of TDEE resulting in an energy deficiency of -346 kcal/d . Another study also confirmed TDFI of 2987 kcal/d and TDEE of 3605 kcal/d in elite Kenyan distance male runners with a BMI of 19.2 kg/m2 leading to a
deficiency of -618 kcal/d [4]. The interpretation of these controversies may be due to the fact that all the subjects in our study were genetically and habitually underweight and hence, unable to increase their TDFI. The average TDFI for all subjects was 1576 kcal/day. They also were incapable to meet the standard TDER of 2554 kcal/day. The variation between the TDER and the TDFI was about 1000 kcal/day. To approach the energy balance for normal weight subjects, the TDEE should be similar to the TDFI. In our study, the subjects were underweight which means that to increase their BM and their TDFI, they should exceed the TDER, while, the previous investigations utilized mostly normal weight elite athletes. Only one study used underweight male elite Kenyan endurance runners who found a significant energy deficiency of -346 kcal/d. All the RM revealed training effects when the paired t-test were used. Our findings agreed with several studies [24,25,26,27,28] who stated increases in the 1RM LP by 66, 27, 18, 26 and 62%, respectively, after RT. An increment of 27, 53, 30 and 16% were observed in 1RM LE [24,26,29,30]. In 1RM CP, raises of 32% [31], 39% [27], 19% [32], 12% [33], 14% (26) and 20% [28] were reported. In 1RM PD, a rise of 6% was found (20). Our study confirmed a greater increment in RM than some previous studies [25,26,29,30,32,33]. While, increases of 66, 62, 32 and 39% [24,27,28,31] respectively were confirmed in RM more than our study. The use of untrained normal weight men who were longer (178, 183 cm) and heavier (77.8, 81.6 kg) may explain the superior elevations [24,28] respectively. While, the use of underweight females for longer training periods (12-16 weeks) may interpret the results of Mayhew et al. (2010) and Bratland-Sanda et al. (2012). The subjects with lower fitness levels are able to increase their performances greater than the subjects who have higher fitness levels. In our study, the underweight subjects had lower strengths than the normal weight elite or trained athletes. The increase in RM belongs to the enhancement of the central nervous system rather than the hypertrophy. To gain strength, a short training mode was needed and all underweight subjects in our study had atrophy in the shoulders, which clarify the result of the 1RM SP.
CONCLUSION
In our study, interesting findings were observed. Firstly, the high intensity RT is not advisable, instead, a moderate regime may enhance underweight strength. Secondly, they need more supervision to perform properly the RT. Further, they had less appetite for eating; therefore, adding appetizers to the food may improve their TDFI. Hence, focusing on underweight subjects with no hereditary difficulty is more convenient than those who are genetically underweight.
ACKNOWLEDGEMENTS
REFERENCES
1. Mocanu, V. Overweight, obesity and dieting attitudes among college students in Romania, Acta Endocrinologica (Buc), 2013, IX, 241-248.
2. Bruke, L.M., Loucks, A.B., Broad, N. Energy and carbohydrate for training and recovery, J Sports Sci, 2000, 24, 67 Fudge, B.W., Westerterp, K.R., Kiplamai, F.K., Onywera, V.O., Boit, M.K., Kayser, B., Pitsiladis, Y.P. Evidence of negative energy balance using doubly labelled water in elite Kenyan endurance runners prior to competition, British J Nutr, 2006, 95, 59-66.5-685
3. Fudge, B.W., Westerterp, K.R., Kiplamai, F.K., Onywera, V.O., Boit, M.K., Kayser, B., Pitsiladis, Y.P. Evidence of negative energy balance using doubly labelled water in elite Kenyan endurance runners prior to competition, British J Nutr, 2006, 95, 59-66.
4. Onywera, V.O., Kiplamai, F.K., Tuitoek, P.J., Boit, M.K., & Pitsiladis, Y.P. Food and macaronutrient intake of elite Kenyan distance runners, International Journal of Sport Nutrition and Exercise Metabolism, 2004, 14, 709-719.
5. Hill, R.J., Davies, P.S. Energy intake and energy expenditure in elite lightweight female rowers, Med Sci Sports Exerc, 2002, 34, 1823-1829.
6. Hassapidou, M.N., & Manstantoni, A. Dietary intakes of elite female athletes in Greece, J Hum Nutr Dietet, 2001, 14, 391-396.
7. Drenowatz, C., Eisenmann, J.C., Carlson, J.J., Pfeiffer, K.A., Pivarnik, J.M. Energy expenditure and dietary intake during high-volume and low-volume training periods among male endurance athletes. Appl Physiol Nutr Metab, 2012, 37, 199-205.
8. Motonaga, K., Yoshida, S., Yamagami, F., Kawano, T., Takeda, E. Estimation of total daily energy expenditure and its components, by monitoring the heart rate of Japanese endurance athletes, J Nutr Sci Vitaminal, 2006, 52, 360-367.
9. Martin, L., Lambeth, A., Scoot, D. Nutritional practices of national female soccer players: analysis and recommendations, J Sports Sci & Med, 2006, 5, 130-137.
10. Mocanu, V. Overweight, obesity and dieting attitudes among college students in Romania, Acta Endocrinologica (Buc), 2013, IX, 241-248.
11. Kimber, N.E., Ross, J.J., Mason, S.L., Speedy, D.B. Energy balance during an Ironman triathlon in male and female triathletes, Inter J Sport Nutr & Exer Meta, 2002, 12, 47-62.
12. Pedersen, M.T., Andersen, L.L., Jørgensen, M.B., Søgaard, K., Sjøgaard, G. Effect of specific resistance training on musculoskeletal pain symptoms: dose-response relationship, J Strength Cond Res, 2013, 27, 229-235.
13. Folland, J.P., Williams, A.G. The adaptations to strength training: morphological and neurological contributions to increased strength, Sports Med, 37, 2007, 145-168.
14. American Heart Association. Resistance exercise in individuals with and without cardiovascular disease, Circulation, 2007, 116, 572-584.
15. Gleeson, P.B., Protas, E.J., Leblanc, A.D., Schneider, V.S., Evans, H.J. Effects of weight lifting on bone mineral density in premenopausal women. Journal of Bone and Mineral Research, 1990, 5, 153–158. 16. Hoff, J., Gran, A., Helgerud, J. Maximal strength training improves aerobic endurance performance,
_
18. Alley, J.R., Mazzochi, J.W., Smith, C.J., Morris, D.M., Collier, S.R. Effect of resistance exercise timing or architecture and nocturnal blood pressure, J Strength Con Res, 2015, 29, 1378-1385.
19. Rønnestad, B.R., Hansen, E.A., Raastad, T. Strength training improves 5-min all-out performance following 185 min of cycling, Scand J Med Sci Sports, 2011, 21 (2), 250-9.
20. Ada, L., Dorsch, S., Canning, C.G. “ Strengthening interventions increase strength and improve activity after stroke: a systematic review, Australian Journal of Physiotherapy 2006, 52, 241–248.
21. Shaw, B.S., Shaw, I. Effect of resistance training on cardiorespiratory endurance and coronary artery disease risk, Cardiovascular Journal of South Africa, 2005, 16, 256–259.
22. Body, J.J., Bergmann, P., Boonen, S., Boutsen, Y., Bruyere, O., Devogelaer, J.P., Goemaere, S., Hollevoet, N., Kaufman, J.M., Milisen, K., Rozenberg, S., Reginster, J.Y. Non-pharmacological management of osteoporosis: a consensus of the Belgian Bone Club. Osteoporos Int, 2011, 22, 2769-2788.
23. Robert, A., Murugavel, K. The effect of plyometric resistance and sprint training on acceleration, speed, flight time and jump height of male basketball players, International Journal of Life Sciences and Educational Research, 2013, 1, 105-109.
24. Campos, G.E.R., Luecke, T.J., Wendeln, H.K., Toma, K., Hagerman, F.C., Murray, T.F., Ragg, K.E., Ratamess, N.A., Kraemer, W.J., Staron, R.S. Muscular adaptations in response to three different resistance-training regimens: specificity of repetition maximum resistance-training zones. Eur J Appl Physiol, 2002, 88, 50-60. 25. Wirth, K., Hartmann, H., Sander, A., Mickel, C., Szilvas, E., Keiner, M. The impact of back squat and
leg-press exercises on maximal strength and speed-strength parameters, J Strength Cond Res, 2016, 30, 1205-1212.
26. Jafari, S., Rahmani-nia, F., Arazi, H. The effect of a circuit strength training program on the muscle strength, body image and anxiety of anxious underweight male college students, Hrvat Sportskomed Vjesn, 2015, 30, 42-49.
27. Bratland-Sanda, S., Martinsen, E.W., Sundgot-Borgen, J. Changes in physical fitness, bone mineral density and body composition during inpatient treatment of underweight and normal weight females with longstanding eating disorders. Int J Environ Res, Public Health, 2012, 9, 315-330.
28. Beck, T.W., DeFreitas, J.M., Stock, M.S. The effect of a resistance training program on the average motor unit firing rate, Clinical Kinesiology, 2011, 56, 1-8.
29. Vissing, K., Brink, M., Lonbro, S., Sorensen, H., Overgaard, K., Danborg, K., Mortensen, J., Elstrom, O., Rosenhoj, N., Ringgaard, S., Andersen, J.L., Aagaard, P. Muscle adaptations to plyometric vs. resistance training in untrained young men, J Strength Cond Res, 2008, 22, 1799-1810.
30. Osawa, Y., Oguma, Y. Effects of whole-body vibration on resistance training for untrained underweight adults, Journal of Sports Science and Medicine, 2011, 10, 328-337.
31. Mayhew, J.L., Smith, A.E., Arabas, J.L., Roberts, B.S. Upper-body strength gains from different modes of resistance training in women who are underweight and women who are obese, J Strength Cond Res, 2010, 24, 2779-2784.
32. Hermassi, S., Chelly, M.S., Tabka, Z., Shephard, R.J., Chamari, K. Effects of 8-week in-season upper and lower limb heavy resistance training on the peak power, throwing velocity and sprint performance of elite male handball players, Journal of Strength and Conditioning research, 2011, 25, 2424-2433.
33. Habibzadeh, N. Effect of physical activity on body water in sedentary young underweight and obese women, Sport Science, 2011, 4, 60-62.
34. Westcott, W.L. Resistance training is medicine: Effects of strength training on health, American College of Sports Medicine, 2012, 11, 209-216.
35. Kim, E.K., Yeon, S.E., Lee, S.H., Choe, J.S. Comparison of total energy expenditure between the farming season and off farming season and accuracy assessment of estimated energy requirement prediction equation of Korean farmers, Nutrition Research and Practice, 2015, 9,71-78.