ISSN (e): 2250-3021, ISSN (p): 2278-8719
Vol. 09, Issue 1 (January. 2019), ||V (I) || PP 54-67
Study and Performance Evaluation of 91kW Grid Interactive
SPV System (Case Study)
Ekta Maurya
1, Piyush Charan
2, and Syed Hasan Saeed
31PG Research Scholar, Integral University, Lucknow, India 2
Assistant Professor, Department of Electronics and Communication Engineering, Integral University, Lucknow
3Professor and Head, Department of Electronics and Communication Engineering, Integral University,
Lucknow
Corresponding Author:Ekta Maurya
Abstract—
In this paper, a Grid Interactive Solar Photovoltaic System is studied, which is of 91 kW system installed at BNLT building in Integral University, Lucknow. And this paper has collected data about the system‟s current, voltage, power, energy, temperature, etc. and also evaluated the reference yield, actual yield, performance ratio and has drawn graphs according to it; for January month to April month. The average performance ratio calculated for those four months is low for the system and it seems that this system needs some improvements, which can be tilt angle, maintenance, etc. and concentrating panel and CPC can also be deployed to increase the efficiency of the installed system.Index Terms—
Photovoltaic (PV) Cell, Grid Interactive System (GIS), Performance Ratio (PR), renewable purchase obligations (RPOs), greenhouse gases (GHG)--- --- Date of Submission: 24-12-2018 Date of acceptance: 09-01-2019 ---
---I.
INTRODUCTION
A) Solar Energy
Solar energy is radiant light and heat from the Sun that is harnessed using a range of ever-evolving technologies such as solar heating, photovoltaics, solar thermal energy, solar architecture, molten salt power plants and artificial photosynthesis. Active solar techniques include the use of photovoltaic systems, concentrated solar power and solar water heating to harness the energy. Passive solar techniques include orienting a building to the Sun, selecting materials with favorable thermal mass or light-dispersing properties, and designing spaces that naturally circulate air.
B) Solar Energy Technology
Solar energy technologies convert the sun‟s light into usable electricity or heat. Solar energy systems can be divided into two major categories: photovoltaic and thermal. Photovoltaic cells produce electricity directly, while solar thermal systems produce heat for buildings, industrial processes or domestic hot water. Thermal systems can also generate electricity by operating heat engines or by producing steam to spin electric turbines.
C) Solar Cell
Fig.1 From a Solar Cell to a PV System. Diagram of the possible components of a photovoltaic system
Theory of Solar Cells
The theory of solar cells explains the process by which light energy in photons is converted into electric current when the photons strike a suitable semiconductor device. Working is as follows:
1. Photons in sunlight hit the solar panel and are absorbed by semiconducting materials.
2. Electrons (negatively charged) are knocked loose from their atoms as they are excited. Due to their special structure and the materials in solar cells, the electrons are only allowed to move in a single direction. 3. An array of solar cells converts solar energy into a usable amount of direct current (DC) electricity.
Fig.2 Band diagram of a solar cell, corresponding to very low current (horizontal Fermi level), very low voltage
(metal valance bands at same height), and therefore very low
Fig.4 A very simple solar cell model. ❶ Absorption of a photon leads to the generation of
an electron-hole pair. ❷ Usually, the electrons and holes will recombine. ❸ With semi permeable membranes the electrons and the holes can be separated. ❹ The separated electrons can be used to drive an electric circuit.
❺ After the electrons passed through the circuit, they will recombine with holes.
D) Solar Photovoltaic Systems Types of Solar Photovoltaic Systems
1) Grid-Tied Solar Systems
Fig.5 Diagram of grid-connected photovoltaic system
Grid Interactive System (GIS) means a system that connects the power generating plant (commonly solar) in an electricity consumer‟s premises to an utility grid, so as to supply excess electricity to the distribution company‟s grid, after meeting the need of consumer and also to draw electricity from the grid to meet the short fall, when sufficient electricity is not produced by the generating plant. Import-export and net energy consumed or injected is measured by „net metering‟. Rooftop solar system means the solar photo voltaic power system installed on the rooftops of consumer premises that uses sunlight for direct conversion into electricity through photo voltaic technology. The Grid interactive Roof Top Solar Photo Voltaic (PV) mainly consists of three major components. These are the solar PV modules, mounting structure for the modules and the inverter or power conditioning units. Grid-tied, on-grid, utility-interactive, grid intertie and grid back feeding are all terms used to describe the same concept – a solar system that is connected to the utility power grid.
2) Off-Grid Solar Systems
Fig.7 Direct-coupled PV system
Fig.8 Diagram of stand-alone PV system with battery storage powering DC and AC loads
Fig.9 Off-Grid Solar Systems
An off-grid solar system (off-the-grid, standalone) is the obvious alternative to one that is grid-tied. To ensure access to electricity at all times, off-grid solar systems require battery storage and a backup generator (if you live off-the-grid). On top of this, a battery bank typically needs to be replaced after 10 years. Batteries are complicated, expensive and decrease overall system efficiency.
3) Hybrid Solar Systems
Fig.10 Diagram of photovoltaic hybrid system
Hybrid solar system combines the best from grid-tied and off-grid solar systems. These systems can either be described as off-grid solar with utility backup power, or grid-tied solar with extra battery storage.
E) Solar Energy in India
India has tremendous scope of generating solar energy. The geographical location of the country stands to its benefit for generating solar energy. The reason being India is a tropical country and it receives solar radiation almost throughout the year, which amounts to 3,000 hours of sunshine. This is equal to more than 5,000 trillion kWh. Almost all parts of India receive 4-7 kWh of solar radiation per sq meters. This is equivalent to 2,300–3,200 sunshine hours per year. States like Andhra Pradesh, Bihar, Gujarat, Haryana, Madhya Pradesh, Maharashtra, Orissa, Punjab, Rajasthan, and West Bengal have great potential for tapping solar energy due to their location. Since majority of the population lives in rural areas, there is much scope for solar energy being promoted in these areas. Use of solar energy can reduce the use of firewood and dung cakes by rural household.
II.
RELATED WORKS
(According to Dr. Arun K Tripathi, Director and Scientific ‗F‘) In grid connected rooftop or small
SPV system, the DC power generated from SPV panel is converted to AC power using power conditioning unit and is fed to the grid either of 33 kV/11 kV three phase lines or of 440/220 Volt three/single phase line depending on the capacity of the system installed at institution/commercial establishment or residential complex and the regulatory framework specified for respective States. They generate power during the day time which is utilized fully by powering captive loads and feed excess power to the grid as long as grid is available [16].
(According to Rajeev Kapoor, Secretary, Government of India) In grid connected rooftop or small
SPV system, the DC power generated from SPV panel is converted to AC power using power conditioning unit and is fed to the grid either of 33 kV/11 kV three phase lines or of 440V/220V three/single phase line depending on the local technical and legal requirements.
Solar Rooftop System provides following technical benefits:
1. Utilization of available vacant roof space
2. Low gestation period and Lower transmission and distribution losses
3. Improvement in the tail-end grid voltages and reduction of system congestion
4. Loss mitigation by utilization of distribution network as a source of storage through net metering and Better Management of daytime peak loads by DISCOM/ utility
5. Long term energy and ecological security by reduction in carbon emission and Abatement of about 60 million tonnes of CO2 per year over its life cycle
6. Meeting of the renewable purchase obligations (RPOs) of obligated entities which are targeted at 8% of electricity consumption and
7. Minimal technical losses as power consumption and generation are collocated [14].
(According to B. Shiva Kumar, K. Sudhakar) A grid-connected PV system consists of solar panels,
inverters, a power conditioning unit and grid connection equipment. It has effective utilization of power that is generated from solar energy as there are no energy storage losses. When conditions are right, the grid-connected PV system supplies the excess power, beyond consumption by the connected load to the utility grid. But, in standalone systems batteries are used to store energy or else energy has to be directly connected to load. The tilt angle of the PV array is kept as equal to the latitude of the corresponding location to get maximum solar radiation [2].
Yann Riffonneau, Seddik Bacha, Franck Barruel, and Stephane Ploix presented an optimal power
management mechanism for grid connected photovoltaic (PV) system with storage. The structure of a power supervisor based optimal predictive power scheduling algorithm is proposed. Optimization was performed using Dynamic Programming (DP) and was compared with a simple ruled-based management. They points out that peak shaving is realized with the minimal cost, but especially that power fluctuations on the grid are reduced which matches with the initial objective of helping PV penetration into the grid [18].
S.B. Kjaer, J.K. Pedersen, F. Blaabjerg focuses on inverter technologies for connecting photovoltaic
(PV) arrays to a single-phase grid. The inverters are categorized into four classifications: a) the number of power processing stages in cascade, b) the type of power decoupling between the PV module(s) and the single phase grid, c) whether they utilizes a transformer (either line or high frequency) or not; and d) the type of grid connected power stage [15].
K. Agbossou, M. Kolhe, J. Hamelin, and T. K. Bose proposed a AC-linked hybrid wind/photovoltaic
(PV)/fuel cell alternative energy system for stand-alone applications. Wind and PV are the primary power sources of the system, and a fuel cell electrolyser combination is used as a backup and a long-term storage system [5].
Masa-Bote and Caamaño-Martín developed a methodology to estimate BIPV electricity production
from two similar PV systems. The study included several weather conditions: clear, partially overcast and fully overcast sky [9].
Kane and Verma investigated the performance enhancement of a BIPV module by using
thermoelectric cooling. Thermoelectric module was attached at the back of the PV module. Mathematical modeling of individual systems was performed and then, the dynamic model of the BIPV system by considering the temperature of the PV module was developed [6].
Mei et al. estimated the thermal parameters which describe the performance of ventilated photovoltaic
facades integrated into buildings. The method allowed the heat transfer coefficients to be obtained from data measured on an operational ventilated photovoltaic facade. The performance of PV systems is realized by comparison with a corresponding reference system [10].
(According to Mevin Chandel, G.D. Agrawal, Sanjay Mathur, Anuj Mathur) The potential and the
cost-effectiveness of a solar photovoltaic power plant for meeting the energy demand of garment zone at Jaipur (India) is analyzed. Also, the energy demand of garment zone for year 2011has been estimated (2.21 MW) and the design of the solar PV power plant of 2.5 MW capacity has been proposed, which requires about 13.14 acres of land area. Looking at the scarcity and cost of the land near the city, an off-site proposal for the power plant has also been considered and compared with the on-site option [11].
(According to M. Ganga Prasanna, S. Mahammed Sameer, G. Hemavathi) Solar photovoltaic (PV)
power systems for both utility as well as roof mount applications growing rapidly in India. Solar power plants in India till date are mostly ground-mounted power plants. Most of the utility scale PV power plants are typically in the scale of 5 MW in size and connected to the electrical grid. Financial analysis has been performed with present system cost based on life cycle cost of energy. Standard financial procedures have been used and the sensitivity parameters studied, mainly focusing on various factors, solar insolation variability at the site, the financial interest rates and operational and maintenance cost [7].
(According to Akash Kumar Shukla, K. Sudhakar∗, Prashant Baredar) System simulation is
necessary to investigate the feasibility of Solar PV system at a given location. The study focuses on the use of Solargis PV Planner software as a tool to analyze the performance a 110 kWp solar photovoltaic rooftop plant and also compares the performances of different PV technologies based on simulated energy yield and performance ratio [1].
(According to Sunil Singh, Ajay Srivastava and H.S. Rawat) The fast depletion of fossil fuel
resources on a worldwide basis has nesseciated urgent need of alternative energy resources to meet out present day demand. Solar energy is clean and environment friendly. There is a large potential available for generating solar power using unutilized space on rooftops and wastelands around buildings [17].
(According to G.Ravi Kumar, A.Hari Prasad, N.Satya Saketha, K.Saichandana) The photovoltaic
solar energy (PV) is the most direct way to convert solar radiation into electricity and is based on the photovoltaic effect. The maximum power point tracking of the PV output for all sunshine conditions is a key to keep the output power per unit cost low for successful PV applications. Grid-connected PV systems always have a connection to the public electricity grid via a suitable inverter because a PV module delivers only dc power. Solar photovoltaic modules can be developed in various combinations depending upon the requirements of the voltage and power output to be taken from the solar plant [3].
(According to Radhey Shyam Meena, Jeetendra Singh Rathore, Shivani Johri) India is blessed
with rich solar energy and if exploited efficiently, the country has the potential of producing trillion-kilowatts of electricity. Sunlight is converted to electricity directly when made to fall on solar photovoltaic (SPV) modules. Systems /devices are made for various applications based on SPV modules connected with suitably designed power conditioning units for meeting electricity requirements. These systems/devices are designed to work in off-grid mode (usually supported with batteries to allow use when sunlight is low or during night). Smart Grid-connected solar PV system is primarily based on its essential functions as “intelligence”, automatic load control, temporary PV electricity storage and thermal use of solar power [13].
(According to Jayanna Kanchikere, K. Kalyankumar) Energy demand in India and especially in
Karnataka state is continuously increasing, however the electric utilities failed to meet this load demand. Photovoltaic (PV) solar power plant is used for larger development of solar power generation. In a solar roof top system, the solar panels are installed on the roof of any residential, commercial, institution and industrial building. The solar roof top system may come up with storage facility using battery or grid connected [4].
(According to Majid Jamil, Sheeraz Kirmani, Mohammad Rizwan) With the rapid depletion of
(GHG) to the atmosphere and they produce no pollutant discharge on water or soil and hence power generation from renewable becomes very important [8].
(According to Piyush Charan, Mohammad Maroof Siddiqui, Nupur Mittal, Zohaib, Hasan
Khan) Energy scavenging (also known as energy harvesting or ambient power) is a major challenge for
scientists to overcome in small, wireless autonomous electronic devices like those used in wearable electronics and wireless sensor networks. As of today, solar energy is the cleanest vitality source available in abundance. This fact has interested the researchers, industries and consumers to develop technology that can harvest solar energy and can possibly convert to useful electrical energy [12].
III.
METHODOLOGY
Research Objective: - To perform a case study of the grid interactive rooftop SPV system in Integral
University.
Advantages of Installing Grid Interactive SPV Plant
1. To promote the grid connected SPV rooftop and small SPV power generating plants among the residential, community, institutional, industrial and commercial establishments.
2. To mitigate the dependence on fossil fuel based electricity generation and encourage environment friendly Solar electricity generation.
3. To create enabling environment for investment in solar energy sector by private sector, state government and the individuals and to create enabling environment for supply of solar power from rooftop and small plants to the grid.
4. To encourage innovation in addressing market needs and promoting sustainable businesses models and ensures employment opportunities.
5. To provide support to channel partners and potential beneficiaries, within the framework of boundary conditions and in a flexible demand driven mode and to create a paradigm shift needed for commoditization of grid connected SPV rooftop applications.
6. To support consultancy services, seminars, symposia, capacity building, awareness campaigns, human resource development, etc. and to encourage replacement of diesel, wherever possible.
Solar Plant at Integral University, Lucknow
At Integral University, two companies installed the solar plants which are: 1. HFM Solar
2. CleanMax Solar
The systems designed by these two are:
1. HFM Solar
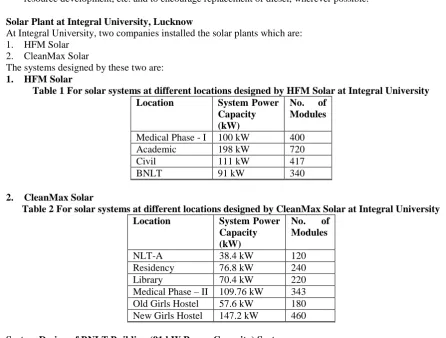
Table 1 For solar systems at different locations designed by HFM Solar at Integral University
Location System Power
Capacity (kW)
No. of
Modules
Medical Phase - I 100 kW 400
Academic 198 kW 720
Civil 111 kW 417
BNLT 91 kW 340
2. CleanMax Solar
Table 2 For solar systems at different locations designed by CleanMax Solar at Integral University
Location System Power
Capacity (kW)
No. of
Modules
NLT-A 38.4 kW 120
Residency 76.8 kW 240
Library 70.4 kW 220
Medical Phase – II 109.76 kW 343 Old Girls Hostel 57.6 kW 180 New Girls Hostel 147.2 kW 460
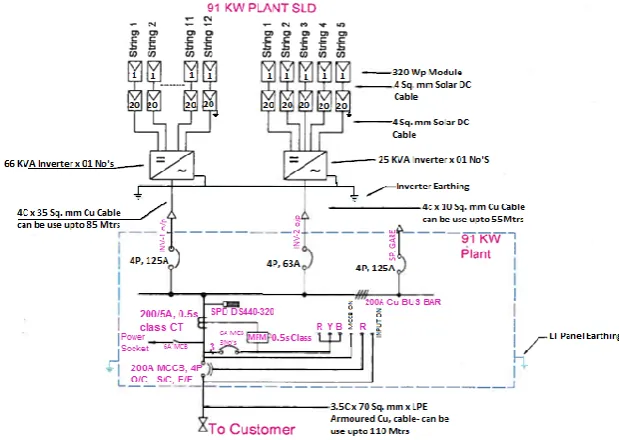
System Design of BNLT Building (91 kW Power Capacity) System
City: - Lucknow State: - Uttar Pradesh Latitude: - 26.957821 Longitude: - 80.999288
All the data and related readings were aggregated in a database that was available online at “dashboard.fourthpartner.co” link for research and monitoring work.
Fig.12 Solar System Layout diagram for BNLT Building
Table 3 Symbols and its meanings in above diagram
IV.
PARAMETERS READINGS OF THE SOLAR SYSTEM
Yearly
Monthly January (2018)
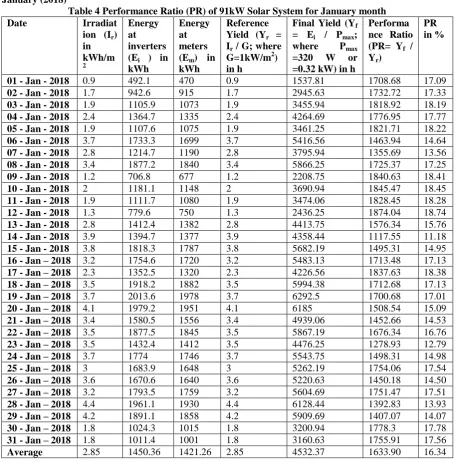
Table 4 Performance Ratio (PR) of 91kW Solar System for January month
Date Irradiat
ion (Ir)
in kWh/m 2 Energy at inverters (Ei ) in
kWh
Energy at meters (Em) in
kWh
Reference Yield (Yr =
Ir / G; where
G=1kW/m2)
in h
Final Yield (Yf
= Ei / Pmax;
where Pmax
=320 W or
=0.32 kW) in h
Performa nce Ratio (PR= Yf /
Yr)
PR in %
01 - Jan - 2018 0.9 492.1 470 0.9 1537.81 1708.68 17.09
02 - Jan - 2018 1.7 942.6 915 1.7 2945.63 1732.72 17.33
03 - Jan - 2018 1.9 1105.9 1073 1.9 3455.94 1818.92 18.19
04 - Jan - 2018 2.4 1364.7 1335 2.4 4264.69 1776.95 17.77
05 - Jan - 2018 1.9 1107.6 1075 1.9 3461.25 1821.71 18.22
06 - Jan - 2018 3.7 1733.3 1699 3.7 5416.56 1463.94 14.64
07 - Jan - 2018 2.8 1214.7 1190 2.8 3795.94 1355.69 13.56
08 - Jan - 2018 3.4 1877.2 1840 3.4 5866.25 1725.37 17.25
09 - Jan - 2018 1.2 706.8 677 1.2 2208.75 1840.63 18.41
10 - Jan - 2018 2 1181.1 1148 2 3690.94 1845.47 18.45
11 - Jan - 2018 1.9 1111.7 1080 1.9 3474.06 1828.45 18.28
12 - Jan - 2018 1.3 779.6 750 1.3 2436.25 1874.04 18.74
13 - Jan - 2018 2.8 1412.4 1382 2.8 4413.75 1576.34 15.76
14 - Jan - 2018 3.9 1394.7 1377 3.9 4358.44 1117.55 11.18
15 - Jan - 2018 3.8 1818.3 1787 3.8 5682.19 1495.31 14.95
16 - Jan – 2018 3.2 1754.6 1720 3.2 5483.13 1713.48 17.13
17 - Jan – 2018 2.3 1352.5 1320 2.3 4226.56 1837.63 18.38
18 - Jan – 2018 3.5 1918.2 1882 3.5 5994.38 1712.68 17.13
19 - Jan – 2018 3.7 2013.6 1978 3.7 6292.5 1700.68 17.01
20 - Jan – 2018 4.1 1979.2 1951 4.1 6185 1508.54 15.09
21 - Jan – 2018 3.4 1580.5 1556 3.4 4939.06 1452.66 14.53
22 - Jan – 2018 3.5 1877.5 1845 3.5 5867.19 1676.34 16.76
23 - Jan – 2018 3.5 1432.4 1412 3.5 4476.25 1278.93 12.79
24 - Jan – 2018 3.7 1774 1746 3.7 5543.75 1498.31 14.98
25 - Jan – 2018 3 1683.9 1648 3 5262.19 1754.06 17.54
26 - Jan – 2018 3.6 1670.6 1640 3.6 5220.63 1450.18 14.50
27 - Jan – 2018 3.2 1793.5 1759 3.2 5604.69 1751.47 17.51
28 - Jan – 2018 4.4 1961.1 1930 4.4 6128.44 1392.83 13.93
29 - Jan – 2018 4.2 1891.1 1858 4.2 5909.69 1407.07 14.07
30 - Jan – 2018 1.8 1024.3 1015 1.8 3200.94 1778.3 17.78
31 - Jan – 2018 1.8 1011.4 1001 1.8 3160.63 1755.91 17.56
Average 2.85 1450.36 1421.26 2.85 4532.37 1633.90 16.34
-5 0 5 10 15 20 25 30 35
0 3 6 9 12 15 18 Pe rf orma nce R at io (PR ) (% ) Time (Days)
Performance Ratio (PR)
February (2018)
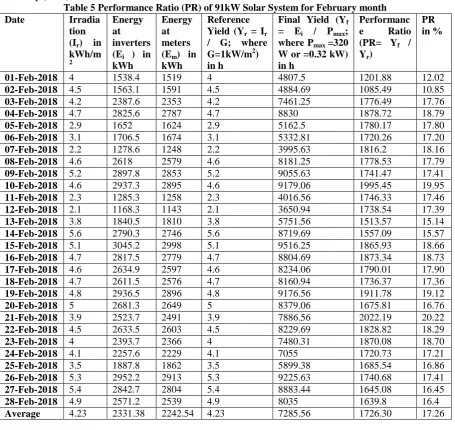
Table 5 Performance Ratio (PR) of 91kW Solar System for February month
Date Irradia
tion (Ir) in
kWh/m
2
Energy at inverters (Ei ) in
kWh
Energy at meters (Em) in
kWh
Reference Yield (Yr = Ir
/ G; where
G=1kW/m2)
in h
Final Yield (Yf
= Ei / Pmax;
where Pmax =320
W or =0.32 kW) in h
Performanc
e Ratio
(PR= Yf /
Yr)
PR in %
01-Feb-2018 4 1538.4 1519 4 4807.5 1201.88 12.02
02-Feb-2018 4.5 1563.1 1591 4.5 4884.69 1085.49 10.85
03-Feb-2018 4.2 2387.6 2353 4.2 7461.25 1776.49 17.76
04-Feb-2018 4.7 2825.6 2787 4.7 8830 1878.72 18.79
05-Feb-2018 2.9 1652 1624 2.9 5162.5 1780.17 17.80
06-Feb-2018 3.1 1706.5 1674 3.1 5332.81 1720.26 17.20
07-Feb-2018 2.2 1278.6 1248 2.2 3995.63 1816.2 18.16
08-Feb-2018 4.6 2618 2579 4.6 8181.25 1778.53 17.79
09-Feb-2018 5.2 2897.8 2853 5.2 9055.63 1741.47 17.41
10-Feb-2018 4.6 2937.3 2895 4.6 9179.06 1995.45 19.95
11-Feb-2018 2.3 1285.3 1258 2.3 4016.56 1746.33 17.46
12-Feb-2018 2.1 1168.3 1143 2.1 3650.94 1738.54 17.39
13-Feb-2018 3.8 1840.5 1810 3.8 5751.56 1513.57 15.14
14-Feb-2018 5.6 2790.3 2746 5.6 8719.69 1557.09 15.57
15-Feb-2018 5.1 3045.2 2998 5.1 9516.25 1865.93 18.66
16-Feb-2018 4.7 2817.5 2779 4.7 8804.69 1873.34 18.73
17-Feb-2018 4.6 2634.9 2597 4.6 8234.06 1790.01 17.90
18-Feb-2018 4.7 2611.5 2576 4.7 8160.94 1736.37 17.36
19-Feb-2018 4.8 2936.5 2896 4.8 9176.56 1911.78 19.12
20-Feb-2018 5 2681.3 2649 5 8379.06 1675.81 16.76
21-Feb-2018 3.9 2523.7 2491 3.9 7886.56 2022.19 20.22
22-Feb-2018 4.5 2633.5 2603 4.5 8229.69 1828.82 18.29
23-Feb-2018 4 2393.7 2366 4 7480.31 1870.08 18.70
24-Feb-2018 4.1 2257.6 2229 4.1 7055 1720.73 17.21
25-Feb-2018 3.5 1887.8 1862 3.5 5899.38 1685.54 16.86
26-Feb-2018 5.3 2952.2 2913 5.3 9225.63 1740.68 17.41
27-Feb-2018 5.4 2842.7 2804 5.4 8883.44 1645.08 16.45
28-Feb-2018 4.9 2571.2 2539 4.9 8035 1639.8 16.4
Average 4.23 2331.38 2242.54 4.23 7285.56 1726.30 17.26
-5 0 5 10 15 20 25 30 35
0 4 8 12 16 20 Pe rf orma nce R at io (PR ) (% ) Time (Days)
Performance Ratio (PR)
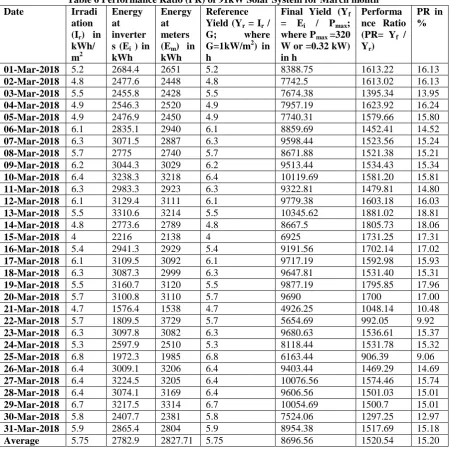
March (2018)
Table 6 Performance Ratio (PR) of 91kW Solar System for March month
Date Irradi
ation (Ir) in
kWh/ m2
Energy at inverter s (Ei ) in
kWh
Energy at meters (Em) in
kWh
Reference Yield (Yr = Ir /
G; where
G=1kW/m2) in
h
Final Yield (Yf
= Ei / Pmax;
where Pmax =320
W or =0.32 kW) in h
Performa nce Ratio (PR= Yf /
Yr)
PR in %
01-Mar-2018 5.2 2684.4 2651 5.2 8388.75 1613.22 16.13
02-Mar-2018 4.8 2477.6 2448 4.8 7742.5 1613.02 16.13
03-Mar-2018 5.5 2455.8 2428 5.5 7674.38 1395.34 13.95
04-Mar-2018 4.9 2546.3 2520 4.9 7957.19 1623.92 16.24
05-Mar-2018 4.9 2476.9 2450 4.9 7740.31 1579.66 15.80
06-Mar-2018 6.1 2835.1 2940 6.1 8859.69 1452.41 14.52
07-Mar-2018 6.3 3071.5 2887 6.3 9598.44 1523.56 15.24
08-Mar-2018 5.7 2775 2740 5.7 8671.88 1521.38 15.21
09-Mar-2018 6.2 3044.3 3029 6.2 9513.44 1534.43 15.34
10-Mar-2018 6.4 3238.3 3218 6.4 10119.69 1581.20 15.81
11-Mar-2018 6.3 2983.3 2923 6.3 9322.81 1479.81 14.80
12-Mar-2018 6.1 3129.4 3111 6.1 9779.38 1603.18 16.03
13-Mar-2018 5.5 3310.6 3214 5.5 10345.62 1881.02 18.81
14-Mar-2018 4.8 2773.6 2789 4.8 8667.5 1805.73 18.06
15-Mar-2018 4 2216 2138 4 6925 1731.25 17.31
16-Mar-2018 5.4 2941.3 2929 5.4 9191.56 1702.14 17.02
17-Mar-2018 6.1 3109.5 3092 6.1 9717.19 1592.98 15.93
18-Mar-2018 6.3 3087.3 2999 6.3 9647.81 1531.40 15.31
19-Mar-2018 5.5 3160.7 3120 5.5 9877.19 1795.85 17.96
20-Mar-2018 5.7 3100.8 3110 5.7 9690 1700 17.00
21-Mar-2018 4.7 1576.4 1538 4.7 4926.25 1048.14 10.48
22-Mar-2018 5.7 1809.5 3729 5.7 5654.69 992.05 9.92
23-Mar-2018 6.3 3097.8 3082 6.3 9680.63 1536.61 15.37
24-Mar-2018 5.3 2597.9 2510 5.3 8118.44 1531.78 15.32
25-Mar-2018 6.8 1972.3 1985 6.8 6163.44 906.39 9.06
26-Mar-2018 6.4 3009.1 3206 6.4 9403.44 1469.29 14.69
27-Mar-2018 6.4 3224.5 3205 6.4 10076.56 1574.46 15.74
28-Mar-2018 6.4 3074.1 3169 6.4 9606.56 1501.03 15.01
29-Mar-2018 6.7 3217.5 3314 6.7 10054.69 1500.7 15.01
30-Mar-2018 5.8 2407.7 2381 5.8 7524.06 1297.25 12.97
31-Mar-2018 5.9 2865.4 2804 5.9 8954.38 1517.69 15.18
Average 5.75 2782.9 2827.71 5.75 8696.56 1520.54 15.20
-5 0 5 10 15 20 25 30 35
0 4 8 12 16 20 Pe rf o rma n ce R a tio (PR ) (% ) Time (Days)
Performance Ratio (PR)
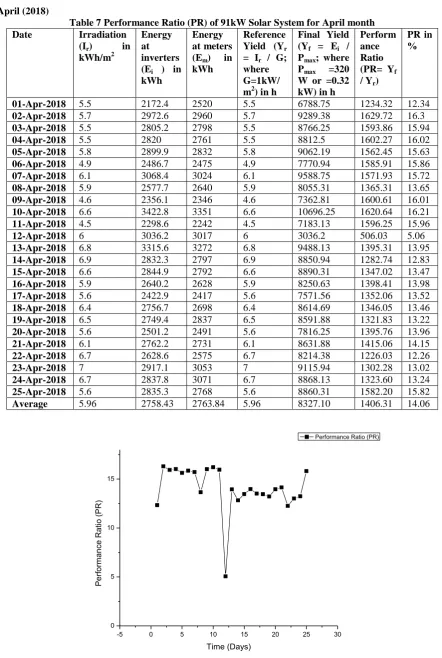
April (2018)
Table 7 Performance Ratio (PR) of 91kW Solar System for April month
Date Irradiation
(Ir) in
kWh/m2
Energy at inverters (Ei ) in
kWh
Energy at meters
(Em) in
kWh
Reference
Yield (Yr
= Ir / G;
where G=1kW/ m2) in h
Final Yield (Yf = Ei /
Pmax; where
Pmax =320
W or =0.32 kW) in h
Perform ance Ratio
(PR= Yf
/ Yr)
PR in %
01-Apr-2018 5.5 2172.4 2520 5.5 6788.75 1234.32 12.34
02-Apr-2018 5.7 2972.6 2960 5.7 9289.38 1629.72 16.3
03-Apr-2018 5.5 2805.2 2798 5.5 8766.25 1593.86 15.94
04-Apr-2018 5.5 2820 2761 5.5 8812.5 1602.27 16.02
05-Apr-2018 5.8 2899.9 2832 5.8 9062.19 1562.45 15.63
06-Apr-2018 4.9 2486.7 2475 4.9 7770.94 1585.91 15.86
07-Apr-2018 6.1 3068.4 3024 6.1 9588.75 1571.93 15.72
08-Apr-2018 5.9 2577.7 2640 5.9 8055.31 1365.31 13.65
09-Apr-2018 4.6 2356.1 2346 4.6 7362.81 1600.61 16.01
10-Apr-2018 6.6 3422.8 3351 6.6 10696.25 1620.64 16.21
11-Apr-2018 4.5 2298.6 2242 4.5 7183.13 1596.25 15.96
12-Apr-2018 6 3036.2 3017 6 3036.2 506.03 5.06
13-Apr-2018 6.8 3315.6 3272 6.8 9488.13 1395.31 13.95
14-Apr-2018 6.9 2832.3 2797 6.9 8850.94 1282.74 12.83
15-Apr-2018 6.6 2844.9 2792 6.6 8890.31 1347.02 13.47
16-Apr-2018 5.9 2640.2 2628 5.9 8250.63 1398.41 13.98
17-Apr-2018 5.6 2422.9 2417 5.6 7571.56 1352.06 13.52
18-Apr-2018 6.4 2756.7 2698 6.4 8614.69 1346.05 13.46
19-Apr-2018 6.5 2749.4 2837 6.5 8591.88 1321.83 13.22
20-Apr-2018 5.6 2501.2 2491 5.6 7816.25 1395.76 13.96
21-Apr-2018 6.1 2762.2 2731 6.1 8631.88 1415.06 14.15
22-Apr-2018 6.7 2628.6 2575 6.7 8214.38 1226.03 12.26
23-Apr-2018 7 2917.1 3053 7 9115.94 1302.28 13.02
24-Apr-2018 6.7 2837.8 3071 6.7 8868.13 1323.60 13.24
25-Apr-2018 5.6 2835.3 2768 5.6 8860.31 1582.20 15.82
Average 5.96 2758.43 2763.84 5.96 8327.10 1406.31 14.06
-5 0 5 10 15 20 25 30
0 5 10 15 Pe rf orma nce R at io (PR ) Time (Days)
Performance Ratio (PR)
V.
RESULTS
As a result it is concluded that the average performance ratio of those four months is 15.72%, which is low for the system and this system needs some improvements.
VI.
CONCLUSION
In this paper a Grid Interactive Solar Photovoltaic System is studied, which is of 91 kW system installed at BNLT building in Integral University, Lucknow. And this paper has collected data about system‟s current, voltage, power, energy, temperature, etc. and also evaluated the reference yield, actual yield, performance ratio and has drawn graphs according to it; for January month to April month. As a result it is concluded that the average performance ratio of those four months is 15.72%, which is low for the system and this system needs some improvements, which can be tilt angle, maintenance, etc. and concentrating panel and CPC can also be deployed to increase the efficiency of the installed system.
REFERENCES
[1]. Akash Kumar Shukla, K. Sudhakar∗, Prashant Baredar , “Simulation and performance analysis of 110 kWp grid-connected photovoltaic system for residential building in India: A comparative analysis of various PV technology”, Energy Reports 2, pp 82–88, 2016
[2]. B. Shiva Kumar, K. Sudhakar, “Performance evaluation of 10 MW grid connected solar photovoltaic power plant in India‖ Volume 1, Pages 184-192, November 2015
[3]. G.Ravi Kumar, A.Hari Prasad, N.Satya Saketha, K.Saichandana , “A New Innovative Design principle of Grid Interactive Roof Top Solar Photovoltaic Power Generation”, InternatIonal Journal of educatIon and applIed research, IJEAR, ISSN: 2348-0033 (Online) ISSN : 2249-4944 (Print), Vol. 4, Issue spl-1, Jan - June 2014
[4]. Jayanna Kanchikere , K. Kalyankumar , “An Analysis of Small Scale Grid Connected Rooftop Solar Power Generation-A Pilot Scheme”, International Journal of Electronics Engineering Research, ISSN 0975-6450, Volume 9, Number 4, pp. 599-612, 2017
[5]. K. Agbossou, M. Kolhe, J. Hamelin, and T. K. Bose, “Performance of a stand-alone renewable energy system based on energy storage as hydrogen,” IEEE Trans. Energy Convers., vol. 19, no. 3, pp. 633–640, Sep. 2004.
[6]. Kane, A., Verma, V., “Performance enhancement of building integrated photovoltaic module using thermoelectric cooling”, Int. J. Renewable Energy Res. 3, 2, 2013
[7]. M. Ganga Prasanna, S. Mahammed Sameer, G. Hemavathi, “Financial Analysis of Solar Photovoltaic Power plant in India”, IOSR Journal of Economics and Finance (IOSR-JEF), e-ISSN: 2321-5933, p-ISSN: 2321-5925, PP 09-15
[8]. Majid Jamil, Sheeraz Kirmani, Mohammad Rizwan, “Techno-Economic Feasibility Analysis of Solar Photovoltaic Power Generation: A Review”, Smart Grid and Renewable Energy, 3, pp 266-274, 2012 [9]. Masa-Bote, D., Caamaño-Martín, E., “Methodology for estimating building integrated photovoltaics
electricity production under shadowing conditions and case study”, Renew. Sustainable Energy Rev. 31, pp 492–500, 2014
[10]. Mei, L., Infield, D., Eicker, U., Fux, V., “Parameter estimation for ventilated photovoltaic façades”, Build Serv. Eng. Res. Technol. 23, 81–96, 2002
[11]. Mevin Chandel, G.D. Agrawal, Sanjay Mathur, Anuj Mathur , “Techno-economic analysis of solar photovoltaic power plant for garment zone of Jaipur city” Case Studies in Thermal Engineering 2, pp 1– 7, 2014
[12]. Piyush Charan, Mohammad Maroof Siddiqui, Nupur Mittal, Zohaib, Hasan Khan, “Solar Power Scavenging for Wireless Sensor Networks”, Journal of Mobile Computing, Communications & Mobile Networks, Vol.3 Issue 3, pp. 33-41, 2016.
[13]. Radhey Shyam Meena, Jeetendra Singh Rathore, Shivani Johri, “Grid Connected Roof Top Solar Power Generation: A Review”, International Journal of Engineering Development and Research, IJEDR, Volume 3, Issue 1, ISSN: 2321-9939, 2014
[14]. Rajeev Kapoor, ―National Solar Mission Grid Connected Solar Rooftop Programme in India”, This Information Guide has been prepared by EU – India Technical Cooperation Project: Energy DCI/ASIE/2014/343-602 LOT 1
[15]. S.B. Kjaer, J.K. Pedersen, F. Blaabjerg, “A review of single-phase grid-connected inverters for photovoltaic modules” IEEE Transactions on Industry Applications, Vol. 41, Issue 5, 2005.
[16]. Sudhakar Sundaray, Lovedeep Mann, Ujjwal Bhattacharjee, Shirish Garud, Arun K Tripathi “Reaching the sun with rooftop solar”, New Delhi: The Energy and Resources Insttute, 62pp, 2014
International organization of Scientific Research
67 | Page
Issue NCETST-2017), ISSN No. (Print): 0975-8364, ISSN No. (Online): 2249-3255, 8(1), pp600-603, 2017[18]. Yann Riffonneau, Seddik Bacha, Franck Barruel, and Stephane Ploix, “Optimal Power Flow Management for Grid Connected PV Systems With Batteries”, IEEE Transactions on Sustainable Engery, vol. 2, no. 3, July 2011.