Page 289 www.ijiras.com | Email: [email protected]
Spatio-Temporal Changes In Occupational Structure And
Workforce In The District Of Darjeeling, West Bengal
Kankan Roy
Research Scholar, Centre for Himalayan Studies, University of North Bengal
I. INTRODUCTION
Occupation is very significant socio-economic attribute of population. A study of occupational scenario of any place or region or state is important because of several reasons. It provides information regarding productive capacity of an economy and highlights the changes in occupational structure taking place in the economy. It also throws lights on the stage of development a country is passing through. Hence time series data on occupational distribution by category of workers like cultivators, agricultural labourers, workers in household industries and other workers etc also present a picture of structural changes occurring in the economy. Interestingly occupational structures of any place varied substantially from one place to another owing to several natural and socio-cultural factors which results into differential pattern and growth of economic activities for spatial variation in development. The development of a particular region depends upon natural, physical and socio-economic factors. All these factors determine the occupational structure as the key to overall development.
Occupation of an individual refers to his trade, profession or type of work. Other way occupation is a person’s regular
work or profession or job or principal activity on which time is spent by the person. The distribution of population according to different types of occupation is referred to as the occupational structure. Occupations are generally classified as the primary, secondary and tertiary occupation. The proportion of people working in different activities reflects the economic development of a country. Developed nations have a high proportion of people in secondary and tertiary activities. Whereas developing countries tend to have a high proportion of their workforce engaged in primary activities.
Workforce participation rate or simply Work Participation Rate (WPR) is therefore defined as the proportion of workers to population, by different categories of workers highlights the occupational structure of the population, and its time series analysis throws light on the structural changes taking place in the economy and the stage of development a country is passing through. Work participation rates disaggregated on the basis of sex and place of residence gives us a better understanding of the labour market behaviour of different categories of population since labour market decisions and hence work participation rates are known to be different for male and female workers as also for rural and urban population.
Abstract: The workforce of any country may be defined as the number of people engaged in or available for work, and conceptually includes all those who contribute to the Gross Domestic Product (GDP) of the economy. A study of the workforce and the work participation rates, which shows the worker population ratio, of any economy is significant in several ways. It provides information regarding the productive capacity of an economy and highlights changes in occupational structure which provides an understanding of the structural changes taking place in the economy. The present study is an attempt to study the growth and changes in the structure of workforce in Darjeeling district of West Bengal using Census data for the period 1991-2011 which will provide an understanding of the structural changes taking place in the economy of the district.
Page 290 www.ijiras.com | Email: [email protected] OBJECTIVES OF THE STUDY
To analyse the level, trends and growth in the work participation rates for the district of Darjeeling by sex and place of residence.
To study the changes in the workforce in agricultural and non-agricultural sector of activities.
To study the growth and changes in workforce by different industrial categories.
THE STUDY AREA
Geographically Darjeeling district is located at the northern most part of the state of west Bengal and spread over 27˚ 13ʹ North to 26˚27ʹ North Latitude and 88˚ 53ʹ East to 87˚ 59ʹ East Longitude with an area of 3149 square Kilometres. The district is surrounded by Sikkim state to the north, Jalpaiguri district, Bhutan and Bangladesh to the east, Uttar Dinajpur district and Bihar to the south and Nepal to the west. The district comprises of four subdivisions namely, Darjeeling Sadar, Kalimpong, Kurseong and Siliguri. Darjeeling Himalaya forms a part of eastern Himalayan ranges. Among the four sub-divisions siliguri is located in the terai or foothill region of eastern Himalayan ranges. The district has a population of 18, 42,034 out of which 60.58% reside in rural areas and 39.42% in urban areas according to the 2011 census. The economy of the district depends chiefly on tea, tourism and timber.
Map 1: Location Map of the Study Area
II. DATABASE AND METHODOLOGY
The study uses secondary data i.e. Census of India data published by the Government of India in different census years from 1981-2011. Formulae used are as follows:
A. COMPOUND ANNUAL GROWTH RATE (CAGR) To calculate the changes in the growth rate of workers the formula for Compound Annual Growth Rate (CAGR) has been used. The growth rates have been expressed as percentages.
CAGR= ( ) 1/N –1 Where,
BV - Value in the beginning period, EV - Value in the ending period, N - Number of years.
B. WORK PARTICIPATION RATE (WPR)
For calculating the work participation rates, the formula for Crude Work Participation Rate (CWPR) is used. WPRs have been expressed as percentages by the following.
WPR= (Total Workers/ Total Population) × 100
This formula has been used to calculate WPRs for total, main and marginal workers and also for male and female workers for both rural and urban areas.
C. WORKERS IN NON- AGRICULTURAL SECTOR (WNAS)
To evaluate the industrial classification of workers and the share of workers in non-agricultural sector the following formula has been used. Here, clubbing of different categories of workers has been done in 1991 to bring about parity in data for the different years.
WNAS = (Workers in Non-Agricultural Sectors/ Total Workers) × 100
III. LIMITATIONS OF THE STUDY
The study is based entirely on Census of India data for the different Census years from 1981-2011. Since the 1991 Census has followed the nine fold industrial classification of workers, for classification of workers on the basis of four broad industrial categories of Cultivators, Agricultural Labourers, Household Industry and Other Workers some clubbing was done for 1991 data.
ANALYSIS
WORK PARTICIPATION RATE
Page 291 www.ijiras.com | Email: [email protected]
Category Total Male Female
1991 2001 2011 1991 2001 2011 1991 2001 2011
Total Workers
34.22 35.39 37.02 47.13 48.51 51.17 20.09 21.38 22.44
Main Workers
33.71 29.76 28.85 46.77 43.23 42.29 19.42 15.38 15.01
Marginal Workers
0.51 5.63 8.17 0.35 5.28 8.88 0.68 6.00 7.43
Rural Workers
36.17 37.04 38.30 46.77 47.92 50.27 24.82 25.65 26.01
Urban Workers
29.78 31.94 35.05 47.92 49.72 52.55 8.89 12.16 16.93
Source: Census of India 1991, 2001 and 2011
Table 1: Work Participation Rate in Darjeeling district (1991-2011)
The table above shows that the WPRs for total workers, male and female in Darjeeling show an increasing trend. The rates for main workers for both male and female are showing a decreasing trend whereas the rates for marginal workers are showing an increasing trend. This implies that the proportion of workers engaged as main workers are continuously decreasing whereas those engaged as marginal workers are continuously increasing resulting into a trend towards marginalisation of the workforce. Thus, the increase in total WPRs is due to increase in marginal WPRs since the main WPRs are showing a declining trend. The rural and urban WPRs are also showing a continuous increase since 1991. A comparison between male and female WPRs reveal low WPRs for females for all categories except for marginal workers where the participation rates for females are higher than for males except in the year 2011. This refers to the fact that there are more marginal workers among the women as compared to men. A comparison for rural and urban WPRs reveals that for male workers, urban WPRs are higher whereas for female workers the opposite is true. This may indicate an out-migration of the male workforce to the urban areas in search of better employment opportunities leaving the women folk behind which increase women WPRs. Poverty considerations may also lead to higher WPRs for rural women.
IV. OCCUPATIONAL STRUCTURE
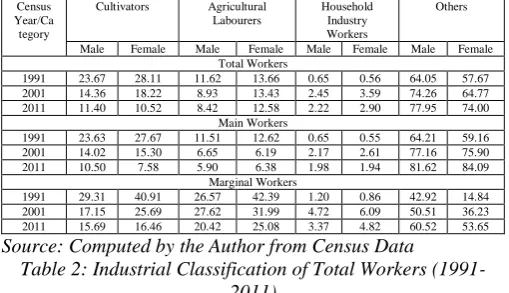
Occupational structure of Darjeeling reveals the economic condition of the district and the temporal changes in it rightly indicate the trends in economic activities. As per census of India the whole working population has been divided into four working categories i.e. cultivators, agricultural labourers, household industry workers and other workers.
Census Year/Ca tegory
Cultivators Agricultural
Labourers
Household Industry Workers
Others
Male Female Male Female Male Female Male Female
Total Workers
1991 23.67 28.11 11.62 13.66 0.65 0.56 64.05 57.67
2001 14.36 18.22 8.93 13.43 2.45 3.59 74.26 64.77
2011 11.40 10.52 8.42 12.58 2.22 2.90 77.95 74.00
Main Workers
1991 23.63 27.67 11.51 12.62 0.65 0.55 64.21 59.16
2001 14.02 15.30 6.65 6.19 2.17 2.61 77.16 75.90
2011 10.50 7.58 5.90 6.38 1.98 1.94 81.62 84.09
Marginal Workers
1991 29.31 40.91 26.57 42.39 1.20 0.86 42.92 14.84
2001 17.15 25.69 27.62 31.99 4.72 6.09 50.51 36.23
2011 15.69 16.46 20.42 25.08 3.37 4.82 60.52 53.65
Source: Computed by the Author from Census Data Table 2: Industrial Classification of Total Workers
(1991-2011)
The occupational classification of total workers shows that the highest share is of others category of workers and the
lowest share is of household industry workers indicating that household industry is not well developed in the region. Although, in 1991, the share of household industry was very insignificant, its share has increased in the following decade and again declined in 2011. The share is still very small compared to the other categories of workers indicating a need to develop the same to augment income especially of rural households outside agriculture. The share of cultivators and agricultural labourers is showing a declining trend for both male and female workers in the district. The share of household industry increased in 2001 followed by a decline in 2011. On the other hand the share of others category of workers is showing an increasing trend. This clearly shows that the non-agricultural activities are gaining more importance over agricultural activities. It can also be seen that more women are engaged in agricultural activities i.e. as cultivators and agricultural labourers and less in the household and others category. But, women engaged in household industry are higher than men except in 1991. The rates for the marginal workers are higher than for main workers for all categories except the other workers category since 1991.
V. NON-AGRICULTURAL OCCUPATION A study of the occupational structure is also significant as the occupational pattern changes with the process of economic development. With the process of economic development there is a gradual shift of the working population from agricultural activities towards non-agricultural activities and from industry to services. To study the changes in the occupational structure an analysis of the changes in the share of non-agricultural workforce is done in the different census years.
Category Total Male Female
1991 2001 2011 1991 2001 2011 1991 2001 2011
Total workers
62.89 74.27 79.20 64.70 76.71 85.05 58.23 68.35 76.90
Main workers
63.44 79.13 84.22 64.86 79.33 83.60 59.71 78.51 86.03
Marginal workers
26.08 48.57 61.46 44.13 55.23 63.89 15.70 42.32 58.46
Rural workers
50.50 63.99 68.16 49.47 65.13 75.63 52.56 61.78 68.67
Urban workers
97.23 99.19 97.74 97.47 99.38 98.86 95.77 98.31 96.41
Source: Computed by the Author from Census of India 1991, 2001 and 2011
Table 3: Workers in Non-Agricultural Sector as Percentage of Total Workers
Page 292 www.ijiras.com | Email: [email protected] workforce for both males and females has increased during
1991-2011 for rural workers. For the urban population the share of the non-agricultural sector increased between 1991 and 2001 thereafter it shows a decline. The increase is more significant for males as compared to females of the rural areas which indicate to the fact that though men may be looking for employment outside agriculture, women workers are still concentrated in the agricultural sector probably in subsistence agriculture or as agricultural labourers with low levels of income and wages. Lastly, though a shift towards non-agricultural activities is a welcome trend, the dynamics of this change needs to be interpreted with care. It does not necessarily mean that the secondary and tertiary sectors are growing sufficiently to absorb the increased workforce pushed out of the agricultural sector. It may be the case that the increased workforce is finding employment in the low productivity un-organised sectors in the urban areas.
VI. FEMALE PARTICIPATION IN ECONOMIC ACTIVITIES
The following table shows that women form almost half the population of the region comprise less than one-third of the total workforce. Though the rates are increasing, they are still very low especially for main worker category. In fact the rates have shown a decline for this main worker category from1991-2001 followed by a slight increase in 2011. The share of women in the marginal workers category is higher than main workers. However the share is declining since 1991. The share of women in the Cultivators category increased from1991-2001 and then declined in last decade while the share as agricultural labourers has increased continuously. The share of women in total household industry and the others category also shows an increasing trend. The share in the non-agricultural workforce also shows an increasing trend since 1991.
Year 1991 2001 2011
Total population 47.74 48.38 49.25
Total workers 28.03 29.23 29.86
Total main workers 27.50 25.01 25.62 Total marginal workers 63.49 51.58 44.82 Total cultivators 31.62 34.38 28.20 Total agricultural
labourers
31.40 38.32 38.87 Total household
industry workers
25.15 37.67 35.66 Total other workers 25.97 26.49 28.78 Total non-agricultural
workers
25.96 26.91 28.99 Source: Computed by the Author from Census of India 1991, 2001 and 2011
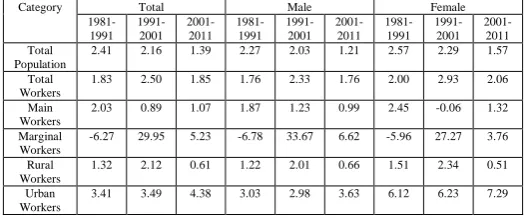
Table 5: Compound Annual Growth Rate of Population and Work Participation Rate in Darjeeling (1981-2011)
VII. CAGR AND WPR OF WORKERS
Following table shows the Compound Annual Growth Rates (CAGR) in percentage for both the total population and
the workforce from 1981-2011. Growth rate of population has decelerated continuously for total person as well as for male and female population. For total workers, male workers and female workers there have been an increase during the nineties followed by a decline in the subsequent decade. During the eighties the growth rate of population was greater than the growth in workforce. But in the succeeding decades the workforce grew faster than the population. This indicates increase in work participation rates between1991 and 2011.
Category Total Male Female
1981-1991
1991-2001
2001-2011
1981-1991
1991-2001
2001-2011
1981-1991
1991-2001
2001-2011 Total
Population
2.41 2.16 1.39 2.27 2.03 1.21 2.57 2.29 1.57
Total Workers
1.83 2.50 1.85 1.76 2.33 1.76 2.00 2.93 2.06
Main Workers
2.03 0.89 1.07 1.87 1.23 0.99 2.45 -0.06 1.32
Marginal Workers
-6.27 29.95 5.23 -6.78 33.67 6.62 -5.96 27.27 3.76
Rural Workers
1.32 2.12 0.61 1.22 2.01 0.66 1.51 2.34 0.51
Urban Workers
3.41 3.49 4.38 3.03 2.98 3.63 6.12 6.23 7.29
Source: Computed by the author from Census of India 1981, 1991, 2001 and 2011
Table 4: Changes of Female Participation in Economic Activities
The growth rate of the female workforce is greater than that of the male workforce indicating that more women are entering into the productive activity. This may be the result of better enumeration of women’s economic activities or that more women are entering the workforce as a result of certain incentives provided to them by both the public and private entrepreneurships. This may not be possible for men since the rates for men are already saturated. The deceleration in the growth rate of total workforce both male and female between 2001 and 2011 could be attributed to the deceleration in the growth of population as the size of the population determines the size of the workforce. This can also be attributed to the fact that the younger population may be delaying their entry into the labour force in pursuit of higher education which is a positive trend.
Page 293 www.ijiras.com | Email: [email protected] The growth rate of female main workers was higher than
that of males except in the decade of the nineties when the rate for men main workers was negative. For marginal workers the rates for males are higher except in the decade of the eighties. Analysis by place of residence shows that for total workers the rates have accelerated and then decelerated in 2011 in the rural areas whereas the rates have continuously accelerated in the urban workforce. For rural males and females the rates have accelerated followed by a deceleration in the last decade similarly as the case of total workers. For urban males the rates have decelerated in nineties followed by a slight increase in later decade. For urban females the rates have shown constant acceleration from 1991. The rates for urban areas are higher than rural areas showing that more people may be migrating to urban areas in search of employment. The urban workforce is growing at faster rate than rural workforce.
VIII. FINDINGS
The Work Participation Rate is higher for the male as compared to the female in total and main workers though the rates are increasing. The difference in WPRs between males and females is higher in the urban areas. The WPRs in case of marginal workers is higher for females. This is found to be more in the rural areas which points to marginalisation of the rural female workforce.
Both male and female main cultivators and agricultural labourers showed negative growth rates during the nineties as opposed to household industry workers and other workers. The rates for marginal workers of all categories were positive and high. The highest growth rate was recorded in the household industry which indicates a trend towards diversification of employment towards non-farm activities in the rural areas. Growth rate of agricultural labourers was higher than for cultivators especially for the marginal category of workers.
Non-agricultural workers as a percentage of total workers show an increasing trend since 1881 for both main and marginal categories of male and female workers in the rural and urban areas.
Work Participation Rate by industrial category show high Work Participation Rate for women for all categories except for other workers. Among the female workers WPR is highest in others category and lowest in household industry. The Work Participation Rate for the marginal workers is higher than that of the main category except for other workers.
Since the nineties the Compound Annual Growth Rate of population and total workforce both male and female are declining. However, the Compound Annual Growth Rate of workforce exceeds that of population in the district of Darjeeling.
The Compound Annual Growth Rate of main category of workers decelerated during the nineties and the deceleration was more among the female workers. For the marginal workers the Compound Annual Growth Rate
accelerated sharply during the nineties and the rates were higher for the male workers. The trend towards marginalisation of workers thus started in the nineties. The Compound Annual Growth Rate for the rural
workforce increased during the nineties and more so for female workers. For the urban workforce the rates increased during the 2001-2011 and the rates were higher for the females.
IX. CONCLUSION
From the above analysis it may thus be concluded that in Darjeeling district as in the rest of country the process of marginalisation of the workforce started during the nineties and is continuing. WPRs for women are lower compared to that of men which indicates under estimation or invisibility of women’s economic contribution in the region. This calls for measures to improve the process of enumeration and creation of employment especially in rural areas and among female population. Causes of declining WPRs in agriculture need to be analysed systematically and steps have to be taken accordingly to make it more remunerative so as to prevent shifts to the non-agricultural sector especially among the male section of population. This would also help to prevent rural-urban migration especially of the male workforce. Although increasing importance of the non-agricultural sector is a welcome trend but the dynamic results of this trend needs to be interpreted carefully. Understanding the type and nature of non-agricultural activities that the working population may be employed in is vital in the context of the growing importance of the urban informal sector in recent times.
REFERENCES
[1] Bhutia, S. (2014). “Human response on socio-economic development in darjeeling himalaya of west bengal”, Asian Academic Research Journal of Social Science and Humanities, 1(22), 166-173.
[2] Chandna, R. C. (2000). “Geography of Population – Concepts, Determinants and Patterns”, Kalyani Publications, New Delhi, 245-46.
[3] Census of India 1981, 1991, 2001 and 2011.
[4] Cenus of India 2011, Series-12, Part-XII-B District Census Handbook (North, West, South and East Districts) [5] Jhingan M.L., et all. (2014). “Demography”. Second
Revised Edition, Vrinda Publications (P) Ltd, 237-247. [6] Mitra, S. and Ray, S. (1985). “Changing occupational
structure in darjeeling hills”. Geographical Review of India, 47(2), 61-67.