CONTROLLING WETTABILITY MODES
OF THE PROBES OF THE ATOMIC-FORCE MICROSCOPE
Andriienko O.1, Medyanyk V.1, PhD. Bilokin S.1, PhD. Bondarenko Yu.1, PhD. Bondarenko M.1, Antonyuk V.2 1)
Faculty of Electronic Technology and Robotics, Department instrumentation, mechatronics and computerized technologies – Cherkassy State Technological University, Ukraine
2)
Instrument-making Faculty, Department of Instrumentation Design and Engineering – National Technical University of Ukraine “Igor Sikorsky Kyiv Polytechnic Institute”, Ukraine
Abstract
:
It has been established that in the study of a solid surface by atomic force microscopy, the hydrophobic interaction is more advantageous due to a decrease in the interaction forces between the probe and the liquid adsorbed on the surface under study. Despite the fact that silicon is a hydrophobic material, it has been shown that the material acquires hydrophilic properties in air, as a result of which the use of carbon-modified probes has been proposed. An approach to experimental statistical modeling is proposed, based on the experiment planning method, which shows that with a scanning speed of 12 μm / s, a scanning step of up to 82 nm and a delay time before scanning of 6 ms, the interaction force between the probe and the adsorbed liquid reaches minimum values. As a result of the research, it was found that with a decrease in the scanning speed, a scanning step and an increase in the delay time of the probe before measurement, the interaction between the probe and the liquid membrane is hydrophobic. It is shown that by changing the initial parameters, it is possible to control the hydrophobic interaction between the probe and the liquid. It has been established that increased air humidity leads to hydrophilic interaction. This is due to the increase in the thickness of the adsorbed liquid layer on the surface under study.KEYWORDS: WETTABILITY, PROBE, ATOMIC-FORCE MICROSCOPE, HYDROPHILITY, HYDROPHOBILITY
1. Introduction
The development of modern science and technology is aimed at increasing the accuracy, reliability and durability of products. The solution to this problem today is seen in the reduction of components and elements to nanometric sizes. In this connection, methods and tools for the study of such elements at the atomic level are increasingly in demand. Among modern research methods, the atomic-force microscopy method is most popular because of its versatility, method accuracy, ease of use, and also because of the possibility of studying not only microgeometric parameters, but also physicomechanical properties.
However, among the artifacts of the method, the influence of the environment should be noted since the study is conducted in air. Thus, when a sample is kept under ambient conditions, a layer of liquid is absorbed on its surface, which distorts the scan results. This is due to the fact that in the contact mode the probe (measuring instrument of the microscope) interacts with the adsorbed liquid and during scanning an additional force of viscous interaction acts on the probe. The study of this interaction is devoted to the work of many foreign and domestic experts, including works of: Bykov V.A., Bruschan B., Karbovs-ky V.L., Litvin P.N., Mironov V.L., Suslov A.A., Tolstikhi-na A.L., Chizhik S.A. and others 1-5.
At the same time, it has been established [6] that the distortion of the scan results is possible due to the low rigidity of the console and the sensitive sensor, the probe, which are subject to significant deformation when a meniscus is formed at the moment the probe detaches from the liquid membrane on the sample (Fig. 1).
Fig. 1. Scheme explaining the mechanism of interaction of the probe with a liquid membrane adsorbed on a solid surface
Considering at the same time that the magnitude of the force of separation of the probe from the liquid membrane is several orders of magnitude higher than the strength of van der Waals, this may cause partial or complete disability of the measuring instrument.
By the nature of the interaction of the probes with liquids, one should distinguish between hydrophobic and hydrophilic probes [7]. To date, both types of probes are actively used in various methods of AFM. For example, hydrophilic probes are used as colloidal sensors, and the use of hydrophobic probes for obtaining microgeometry of dielectric surfaces is more beneficial due to the smaller number of artifacts and greater scanning accuracy [8]. However, when studying soft (viscous) objects (for example, biopolymers, cells, biological membranes, etc.), hydrophobic probes destroy the surfaces of the samples under study.
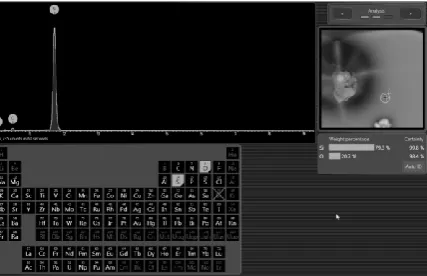
One of the main materials used for the manufacture of AFM probes is silicon, which by its nature is a hydrophobic material. However, a layer of silicon dioxide forms in the air on the surface of silicon, which adsorbs hydrocarbon molecules and water molecules (Fig. 2), as a result of which the surface of the probe acquires hydrophilic properties.
Fig. 2 – The result of energy dispersive chemical analysis of the probe surface CSC38 (Phenom ProX4, Netherlands), which demonstrates the formation of silicon dioxide on its surface
Tabl. 1. Determination of capillary forces depending on the nature of the interaction of the probe with the adsorbed liquid
Nature of interaction
The force of the capillary attraction of the probe to the liquid membrane
The force of separation of the probe from the
liquid membrane
Hydrophilic Fc.sum.h.phil. =
= 4πRσ cos θ Fc.est.h.phil. = –3πRγ
Hydrophobic Fc.sum.h.phob. =
= 2πσ(R2 + 2zR)½ Fc.est.h.phob. = –2πσR
Given that the value of the capillary interaction forces are in the range (5…10)·10-9 N, and the limit of mechanical destruction of the probe is of the order 140·10-9 N [9], it can be assumed that with such efforts the adhesive (liquid membrane) is destroyed. Herewith, the destruction of the probe is impossible. When the hydrophilic interaction occurs, the liquid sticks to the surface of the probe, and two components are applied to the capillary force: internal friction and capillary attraction that distorts the scan result. At the same time, during the hydrophobic interaction, such components will be negligibly small, so they can be ignored. Therefore, the actual task
remains to control the wettability of probes in nanoscale studies. The purpose of this work is to conduct experimental statistical studies and establish the modes of wettability of atomic force microscope probes, which leads to the management of their hydrophobic and hydrophilic properties.
2. Experimental-statistical simulation
To solve this problem, an experimental-statistical model of the action of capillary forces with silicon probes modified by carbon coating by the method of planning a multifactorial experiment was developed, which was further confirmed by the experimental part.
To identify the possibility of controlling the hydrophobic properties of the probe, we considered the contact mode of the AFM at which the matrix was scanned. The following parameters were monitored (Fig. 3):
number of measurements taken in directions X and Y (Num points);
step length between two adjacent measurement points along the scan line (Step, nm);
time delay before measurement at the point (Delay, μs).
Fig.3. The trajectory of the probe when scanning flat surfaces along one line indicating the main operating parameters: А – step of vertical probe stroke during scanning, µm; h – step of horizontal probe stroke between two consecutive scanning points, nm;
V – horizontal scan speed, µm / s; τ = S/V – interaction time of the probe with the surface, μs;
S – horizontal distance traveled by probe, nm
To select the mode of diagnosing microgeometric parameters, at which high indicators of reflection accuracy of the studied relief are achieved, the method of determining the rational AFM operation modes using the multivariate experiment planning method was used
10.
For the main parameter in the simulation, the force of the capillary interaction was chosen under the condition that it should tend to zero. Independent variables (optimization factors) were selected: ambient humidity (Х1), horizontal scan speed (Х2), delay
time before measurement (Х3), scan step (Х4) (tabl. 2). The following factors were taken into account: the physical independence of incoming and outgoing parameters, the normal distribution of probable measurements, the stability of the experiment to interference, and the order in which the measurements were carried out did not disturb the planning orthogonality.
Tab. 2. Experimental levels of variation
Factors of optimization Coded value of
factors
Variable interval
Levels of factors
upper main lower
Humidity, RH, % Х1 50 100 50 0
Horizontal scan speed, Vгор, μm / sec Х2 4 17 13 9
Delay time before measurement, τ, ms Х3 1,5 6 4,5 3
Step scan, h, nm Х4 12 102 90 78
According to the procedure described in [10], a four-factor experiment plan was drawn up. Using n-th order statistical planning methods, the mathematical model was obtained in the form of a
non-linear regression equation of quadratic form for four optimization factors:
Cm = b0 + Σbixi + Σbijxixj + Σbiixi2,
To exclude a systematic error, the experiments were randomized using a table of random numbers. At the main level, four parallel experiments were carried out, on the basis of which the dispersion of the experiment was established with two degrees of freedom sC2 = 0,0139.
According to the experiment and the proposed optimization method using the method of planning a multifactor experiment, the regression coefficients were calculated (in coded scale):
b0= 2,6 b11= 0,67125
b1= 0,283 b12= 0,355
b2= 0,02 b13= 0,08
b3= - 0,615 b14= 0,025
b4= 1,0617
b22= -0,47125 b33= -0,41375
b23= 0,4575 b34= 0,4125
b24= -0,1275 b44= 0,24625
The tabular value of the Student's t-test with 16 experiments and a significance level of 0.05 is 4.3. Confidence intervals when calculating regression coefficients b0, bі, bii, bij, respectively: 0,2916; 0,1458; 0,2544; 0,2193.
The resulting model of the dependence of the force of capillary interaction on four specific factors is:
Fcap = 2,6 + 0,283.RH – 0,615.τ + 1,0617.h +
+ 0,355.RH.V + 0,4575.V.τ + 0,4125.h.τ + 0,67125.RH2 – – 0,47125.
V2 – 0,41375.τ2 + 0,24625.h2.
As a result of the work of the obtained model were established the dependences of capillary force Fcap from horizontal scan speed
V and time delay before measurement τ (Fig. 4) and from horizontal scan speed V and scan step h (Fig. 5) for environmental humidity limits.
With dependencies (Fig. 4 – 5), it can be seen that with a decrease in ambient humidity up to 0%, a scanning
Fig. 4. Capillary force dependence Fcap on horizontal scan
speed V and time delay before measurement τ for environmental humidity limits (RH): 1 – 0 %; 2 – 50 %; 3 – 100 %
Fig. 5. Capillary force dependence Fcap on horizontal scan speed
V and scan step h for environmental humidity limits (RH): 1 – 0
%; 2 – 50 %; 3 – 100 %
speed of up to 12 μm / s, a scanning step of up to 82 nm and an increase in the delay time of up to 6 ms, the force of interaction between the probe and the liquid adsorbed on the test surface reaches minimum values Fcap ≤ 1.10-12 N, which reduces the
distortion of the scan results due to the action of surface capillary forces.
To confirm this model, a set of experiments was performed.
3. Results and discussion
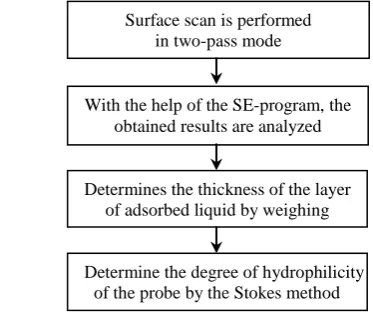
A method was developed for determining the wetting angle of the atomic force microscope probes, which was performed in the following sequence (Fig. 6):
1. Determination of the degree of hydrophobicity of silicon by measuring the wetting angle using witness samples;
Fig. 6. The sequence for determining the hydrophobic properties of AFM probes
2. Determination of the hydrophobicity of probes when scanning various wetted surfaces based on the result of two-pass hydroscopic scanning.
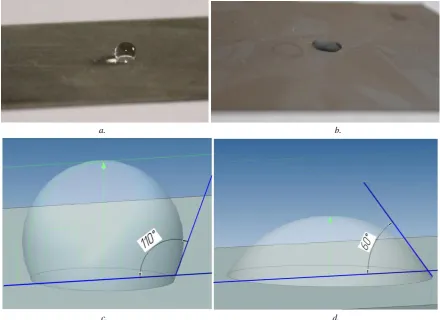
To compare the degree of hydrophobicity, two batches of witness samples were used as test samples – silicon and silicon modified by a carbon coating in accordance with the method described in [11]. To determine the wetting angle, the following approach was used. The samples are placed on an equal footing, using micro-pipette, 50 μg of distilled water was applied to them. To determine the contact angle, the drop was photographed into a profile, after which the information was transferred to the computer (Fig. 7).
Further, using a special software T-Flex CAD, a tangent to the droplet surface was constructed at the point of contact with the surface and the wetting angle was determined (θ). Wettability (B) was defined as cos θ: the less wettability, the more hydrophobic is the surface.
Surface scan is performed in two-pass mode
With the help of the SE-program, the obtained results are analyzed
Determines the thickness of the layer of adsorbed liquid by weighing
a. b.
c. d.
Fig. 7. Photos (a, b) of distilled water droplets and a scheme for determining the wetting angle using програмного appli-cation T-Flex (c, d) on hydrophobic silicon plate (a, c) and a hydrophilic plate whose surface contains silicon dioxide (b, d)
For silicon samples whose surface was protected from the formation of silicon dioxide by modifying with a thin carbon coating, the wetting angle was θ = 110° (wettability В = –0,34 – hydrophobic sample), Fig. 7 – a, c. Wherein, the wetting angle of unmodified silicon is θ = 60° (wettability В = 0,5 – hydrophilic sample), Fig. 7 – b, d. Therefore, we used probes coated with thin carbon coatings (coating technique described in [11]), at the same time probes have hydrophobic properties. However, despite the hydrophobicity of the carbon coating, when scanning hydrophobic surfaces in some modes, the hydrophilic interaction between the probe and the layer of liquid adsorbed on the surface under study still occurs. This may be due to the fact that the thickness of the adsorbed liquid is sufficiently large (more than 10 nm), which leads to complete wetting of the probe. It was also found that when scanning materials with different hydrophobicity, the wetting angle is different.
To check the hydrophobic properties of the AFM probes, the two-pass scanning mode was used. In this mode, the probe performs two passes relative to the surface: the first scan pass is performed to obtain an AFM-image of the topography; during the second pass, the system increases the distance between the probe and the sample and re-scans the same surface area, moving the probe parallel to the relief based on AFM-data obtained during the first pass (similar to the constant force mode). The difference between the two passes will contain the force of viscous friction between the probe and the surface to be studied.
For the implementation of two-pass scanning, the following sequence of operations is observed:
1. The device turns on and the detection system is set.
2. Two-pass scanning mode activates mode selection «Two-pass scanning» on the panel «Main» control programs AFM.
3. Capillary force mapping is provided for the static measurement mode, for which the «STATIC» mode is selected in the «Mode» selector.
4. Sets the distance that the probe rises.
5. To start the scanning procedure, press the “START” button in the “Main” panel.
6. The data set obtained after the end of measurements contains the image of the topography (on the first pass) and the image of contrast (on the second pass).
7. At the end of the scan, data is loaded into the «Surface Explorer» program, the operation of subtracting the images of the first pass and the second is performed, resulting in a map of the distribution of viscous friction forces (F).
8. Determined by the degree of hydrophobicity of the probe, which is wetted along its radius:
r = F / (6πηV),
where R – the radius of the probe, which is in contact with the liquid membrane; η – water viscosity; V – scan speed.
by assuming that the adsorbed moisture layer is water and the layer is evenly distributed:
h = m / Sρ,
where m – the difference of the plate mass at a certain humidity and the mass of the plate after drying in a vacuum chamber; V – volume of adsorbed liquid; S – plate area on which liquid is absorbed evenly; ρ – density of water.
10.The wetting angle is calculated on the basis of hydrophobic or hydrophilic interaction (Fig. 8):
tg θ = h / r = 6hπηV / F, where θ – wetting angle; h – membrane thickness.
а. b.
Fig. 8. The interaction of hydrophilic and hydrophobic probes with a liquid membrane
In the course of the experiments, the following dependences of the degree of wettability of the probes when scanning various materials on the values of the operating parameters of the scan were obtained (Fig. 9 – 11).
Fig. 9. The dependence of wettability (B) of the carbon-modified probe on the horizontal scanning speed (V) under the following
conditions: h = 82 nm; τ = 6 ms;
1 – silicon; 2 – optical glass; 3 – thin coating Au-995; 4 – thin coating HfO2 10 nm thick on a silicon substrate
Fig. 10. Dependence of wettability (B) of the probe modified with carbon coating on scanning step (h) under the following
conditions: τ = 6 ms; V = 12 µm/s (other symbols – similar to the symbols in Fig. 9).
Fig. 11. Dependence of wettability (B) of the probe modified with carbon coating on the delay time before measurement (τ)
under the following conditions: h = 82 nm;
V = 12 µm/s (other symbols – similar to the symbols in Fig. 9).
As can be seen from fig. 9, with a decrease in the horizontal scanning speed to values of 12 – 15.5 μm/s, the sign of wettability for silicon probes changes from hydrophilic to hydrophobic for most of the studied surfaces (the exception was a thin coating HfO2 10 nm thick on a silicon substrate). In this case, the dependences of the change in the wettability of the probe on the scanning speed for both the hydrophilic and hydrophobic silicon probe are nonlinear, and the growth of the hydrophobicity of the probes with decreasing speed is more pronounced than their hydrophilicity.
The dependence of the probe wettability on the scanning step (Fig. 10) has a character similar to the dependence of the probe wettability on the scanning speed. Wherein, the sign of wettability changes from positive to negative, which corresponds to the transition of the surface properties of the probe from hydrophilic to hydrophobic in the range of the scanning step 82 – 94 nm.
At the same time, the dependence of the wettability of the probe on the delay time before measurement with the surface under investigation has the character opposite to the dependence of the probe on the step and scanning speed. From Fig. 11 it can be seen that the shorter the interaction time, the stronger the wetting of the probe. At the same time, the drop in the curve for hydrophobic probes is more pronounced than for hydrophilic ones. The range in which the transition from hydrophilic to hydrophobic interaction takes place for such a dependence is 3.9 – 5.5 μs.
a. b.
c. d.
Fig. 12. Topogram (а, c) and profilograph (b, d) of the test structure in different modes: а, b – V = 12 µm/s, τ = 6 ms, h = 82 nm; c, d – V = 17 µm/s, τ = 3 ms, h = 102 nm
As can be seen from the above, with a decrease in the horizontal scanning speed, an increase in the delay time before the measurement and a decrease in the scanning step, the image is blurred. According to the authors, this is due to the fact that with a decrease in the time of interaction of the probe with the sample, the process of interaction between the liquid membrane and the silicon probe occurs more actively (the hydrophilic properties of the probe appear).
In addition, dependencies are shown in Fig. 9 – 11, the following conclusion can be made: the greater the wetting angle in the surface under study, the greater the likelihood that the probe will come into contact with the adsorbed liquid. Thus, for a qualitative study of the surface topogram without distortion due to the action of capillary forces, it is recommended to research materials with a wetting angle less than that of the probe. When scanning according to certain optimal modes, it can be argued that the binding energy between the membrane and the surface under study is greater than that between the probe and the membrane, so the probability that liquid molecules will adsorb to the probe is small.
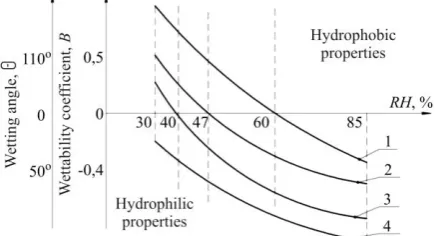
The dependence of the wettability of the probe was also established with optimal scanning modes for different environmental humidity (Fig. 13), which showed that when the ambient humidity is above 60%, the interaction between the modified silicon probe carbon coating and all the surfaces considered is hydrophilic.
Fig. 13. Dependence of wettability (B) of the carbon-modified probe on the air humidity (RH) with the following parameters of sample scanning: V = 12 µm/s; h = 82 nm/s τ = 6 ms (other symbols – similar to the symbols in Fig. 9).
Thus, as a result of the research, it was established that with a decrease in scanning speed, scanning step and an increase in the delay time of the probe before measurement, the interaction between the probe and the liquid membrane is hydrophobic. By changing the initial parameters, it is possible to control the hydrophobic interaction between the probe and the liquid. In addition, it was found that increasing the humidity of the air leads to hydrophilic interaction, which is associated with an increase in the thickness of the adsorbed liquid layer on the surface under study.
Conclusion
It has been established that in the study of a solid surface by atomic force microscopy, the hydrophobic interaction is more advantageous due to a decrease in the interaction forces between the probe and the liquid adsorbed on the surface under study
Despite the fact that silicon is a hydrophobic material, it has been shown that the material acquires hybrophilic properties in air, as a result of which the use of carbon-modified probes is suggested.
An approach to experimental statistical modeling, based on the experimental planning method is proposed, which shows that when the scanning speed is 12 μm/s, the scanning step is up to 82 nm and the delay time before scanning is 6 ms, the interaction force between the modified probe and the adsorbed liquid reaches its minimum values.
Developed the methods for determining the degree of wettability of the probe, which includes the following items: - determination of the wetting angle of modified and unmodified silicon (which is 110º and 60º respectively);
- determination of the degree of hydrophobicity of the probe in the study of various surfaces
- determination of the thickness of the adsorbed liquid layer on the surface under study, depending on the humidity of the environment. On the basis of the experiments performed, rational modes were established for determining the microgeometry parameters of solid surfaces, in which the capillary force of the interaction of the probe with moisture adsorbed on the surface is the smallest, under
such conditions: humidity,
Literature
1. B. Bhushan, Springer handbook of nanotechnology. Berlin, Germany: Springer, 2010.
2. D. Sarid, Scanning Force Microscopy With Application to Electric, Magnetic and Atomic Forces. New York, NY, USA: Oxford University Press, 1991.
3. S. N. Magonov, and Myung-Hwan Whangbo, Surface Analysis with STM and AFM: Experimental and Theoretical Aspects of Image Analysis. Oxford, UK: Wiley, 2008.
4. R. Wiesendanger, Scanning Probe Microscopy and Spectroscopy. Cambridge, UK: Universtiy Press, 1994.
5. R. R. L. De Oliveira et al., Atomic Force Microscopy – Imaging, Measuring and Manipulating Surfaces at the Atomic Scale. Rijeka, Croatia: InTech, 2012.
6. Artifact Review and Badging. [Online]. Available: https://www.acm.org/ publications/policies/artifact-review-badging. Accessed on: May 31, 2015.
7. O. Teschke, and E. F. de Souza, “Hydrophobic surfaces probed by atomic force microscopy”, Langmuir, vol. 19, iss. 13, pp. 5357–5365, 2003.
8. O. Yu. Komkov, “Influence of Liquid Meniscus on Surface Forces”, Journal of Friction and Wear, vol. 28, iss. 1, pp. 19-31, 2007.
9. M. A. Bondarenko, J. J. Bondarenkо, and S. A. Shelestovskaya, “Research of influence of the state of surface of probes for AFM on exactness and quality of the topograms”, in Proc. XXXI Intern. Scien. Conf. “Electronics and nanotechnology: ELNANO 2011”, Ukraine, April 12-14, 2011, P. 60.
10.S. P. Vysloukh, Informatsiini tekhnolohii v zadachakh tekhnolohichnoi pidhotovky prylado- ta mashynobudivnoho vyrobnytstva (Information technologies in the tasks of technological preparation of instrument-making and machine-building production). Kyiv: NTUU «KPI», 2011.