A New Method for Acquisition and Analysis
of ECG Signal using Virtual Environment
Divya Savani, Ukshit Prajapati, Harsh Shingala, Prashant Tanti
Parul Institute of Technology, Parul University, Vadodara, Gujarat, India
Abstract
Electrocardiogram is used to measure the rate and regularity of heartbeats and to detect any heart arrhythmia. Different ways are submitted and used for cardiogram feature extraction with a reasonable percentage of right detection. Al-though the problem stays open especially with respect to superior detection accuracy in ECGs. The ECG signal is very sensitive in nature having voltage level as low as 0.5 to 5mv and frequency components fall into the range of 0.05-100Hz and most of the information contained in the range of 0.05- 45Hz. The recorded ECG signal contains different type of noises such as baseline wander, channel noise which becomes very essential for us to remove for the better clinical result which helps in the treatment of the patient. For the
feature extraction and classification task we'll be using discrete wavelet transform (DWT)
as wavelet transform could be a two dimensional timescale process technique,
there-fore it's appropriate for the nonstationary ECG signals(due to adequate scale values and shifting in time) in LabVIEW. The flexibility, standard na-ture and simplicity to use programming possible with LabVIEW, makes it less complex. The pro-posed algorithm is executed in two steps. First step, it pre-processes de-noises the signal to get rid of the noise from the cardiogram signal, Then it detects pulse, Our extracted parameters are Heart rate, P wave amplitude, T wave amplitude, S value, Q value, R-value, P offset location, P onset location, T onset location, T offset location and the location of P, Q, R, S and T wave.
Keywords — Electrocardiogram, discrete wavelet transform, heart arrhythmia, LabVIEW.
I. INTRODUCTION
An ECG (electrocardiogram) represents cardiac signals generated by cardiac muscles. A typical ECG cycle contains wave segments P, QRS and T which represents periodic depolarization and repolarization of atria and ventricles in a sequential manner. QRS, being the most striking segment of the waveform assumes special significance for the cardiac interpre-tation of ECG signal. With the semiconductor tech-nology advancement, embedded systems are adopted to implement an ambulatory ECG monitor as a pri-mary signal-processing device for detecting irregular
heart conditions by evaluating ECG signals [2]. The ECG detection that shows the data of the heart and heart condition is important to sup-port the patient living quality and applicable treatment. It is valuable and a very impor-tant tool within the identification and the condi-tion of the heart diseases. In recent year, numerous research and algorithm have been developed for the work of analyzing and classifying the ECG signal. The ECG features can be extracted in a time domain or in a frequency domain. Manual beat-by-beat measurements of all characteristic points in each lead are impractical in routine clini-cal observe. Especially for long term ECGs. For this reason, automatic ECG feature extraction methods are more relevance. Beat or QRS advanced detection is the most significant part which is Associate in Nursing ECG feature extraction system. Therefore peak detection Algorithms are needed. Wavelet Transforms will present a time versus frequency illustration of the signal and work well on the non-stationary signal. Wavelets also overcome the present resolu-tion problem of the short time Fourier transforms by using a variable length window. The large range of various wavelet functions provides an exclusive area to look for wavelet with efficiency represent a symbol of interest. Although there are some methods available in order to select the best wavelet for an application. The orthogonal Daube-chies wavelet family, specifically Db6 is used here. We have enforced here the DWT to ex-tract ECG signal features. In ECG signals, instru-mentation plays a major role, since signals generated by the human body are very low in amplitude. High gain must be obtained with a high common-mode rejection ratio (CMRR). Two electrical circuits were studied in the present work, using common electronic parts and application-specific parts. LABVIEW is a software application from National Instruments that is specially designed for easy and powerful data acqui-sition purpose. Thus, LABVIEW software was used for data recording and visualization, due to its known capabilities [1]. Finally, LABVIEW were used again to implement real-time filtering of the signal.
II. METHODOLOGY
vital parts First phase is that the acquiring of the signal, here we have a tendency to use the ECG signal within the system and provides to our program for the analysis. The second phase is the filtering of the raw ECG signal to remove un-wanted noises. A third is the core phase to extracting the features from the signal i.e. ECG signal in terms of its parameters by the actual analysis of it. The last is the detection of different types of abnormalities on the basis of different values of parameters obtained [3]. The parameters are obtained in LabVIEW soft-ware where its features are known.
Fig. 1 Flowchart of the proposed system
A. Signal Amplification
The combinations of differential amplifiers are used to construct to achieve the obtained output from the noised input signal which is collected from bio-potentials that is called an instrumentation ampli-fier. In this proposed project we have used INA126 instrumentation amplifier. An instrumentation ampli-fier is typically the very first point in an instrumenta-tion system. This is as for the very small voltages generally received from the probes have to be ampli-fied. The ECG signal is too small and contains a lot of added noise. Also, the signal extracted from the heart has an amplitude of approximately 0.5mV. Since it is essential to amplify the signal and remove the noise, and then extract the QRS complex. The INA126 is used for the low-level amplification. The gain of the amplifier is 13v/v.
B. Signal Conditioning
The Filtering circuit includes Bandpass filter with the non-inverting amplifier. In that, the fre-quency range of the Bandpass filter is 0.5-30 Hz and the Gain of the non-inverting amplifier is 100v/v. Thus, after the filtering stage noise will be removed and get the better signal of ECG. After that with the use of a summing amplifier, the signal has been summed in the range of 0-5v. There are many types of noises which are removed using this filtering tech-nique such as power line interference, Electrode con-tact noise, muscle artifact, motion artifact and base-line wander.
C. Summing Amplifier
The signal must be in a range of 0 to 5 volts so that the signal will be converted from ana-log to digital form to perform analysis on it.
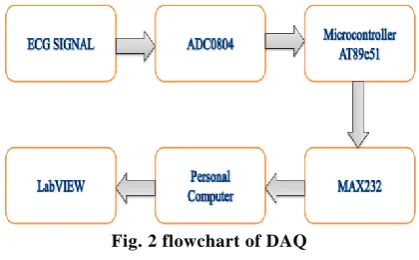
D. Data Acquisition
Analog to digital conversion is one of the most important things in the data acquisition sys-tem. It is basically performed using ADC0804. Which is generally done in two ways: First, paral-lel mode where data is transferred at a faster rate with more number of lines which is used for short-range data transfer and Secondly in Serial mode where it uses one or two data lines which are used for longer range data transfer.
Fig. 2 flowchart of DAQ
E. LabVIEW (Laptop)
A Virtual ECG Instrumentation system is a new Instrumentation system, which is much bet-ter and flexible with the aid of compubet-ter intelli-gent resource.
1. Continuous Wavelet Transform
A Continuous wavelet transform is used to divide a continuous time function into wavelets. It is a convolution of the input data sequence with a set of functions generated by the mother wavelet. It is represented as:
2. Discrete wavelet transform
A discrete wavelet transform is used for func-tional analysis and numerical analysis. The DWT of signal x is calculated by using a series of filters. The sample is passed through a low pass filter with the impulse response g resulting in a convolution of both parameters.
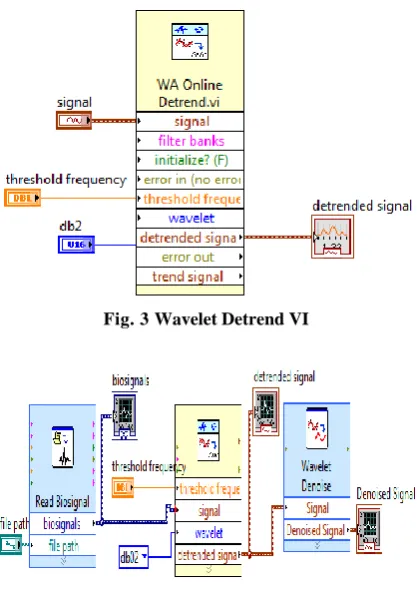
3. Feature Extraction
Fig. 3 Wavelet Detrend VI
Fig. 4: VI diagram to remove Baseline Wandering and Wideband Noise
III.RESULT ANDCONCLUSION
This evaluation system was tested and validated on a few healthy subjects. Our extracted parameters are Heart rate, P wave amplitude, T wave amplitude, S value, Q value, R-value. The display window of our VI also gives the location of P, Q, R, S and T wave. It also gives output value of P offset location, P onset location, T onset location and T offset location. Heart measurement is done by detecting the R-pecks which is detected by providing threshold value to the ECG signal. If the signal is exceeded from the threshold value it will be counted as an R peak. We have put 0.8 mV threshold values according to the ideal peak value of R. In our analysis first, Wavelet detrend VI is used which removes baseline wander of ECG sig-nal. So, the output of this VI will remove the trend of ECG signal. The Output of Wavelet detrend VI ap-plies to the Wavelet denoise. Transform type of Wavelet denoise is UWT (Undecimated Wavelet Transform) with db02 and level 5, which denoise the signal and wideband type noise. The output shows the smoother ECG signal and it displays sharp peaks. After filtering of ECG signal, Each and every indi-vidual ECG superimposed on single ECG cycle and after overlapping of ECG signal we can get averaged ECG signal.
Fig. 5(a): Row ECG signal
Fig. 5(b): R-peak detection
Fig. 5(c): Detrended ECG signal
Fig. 5(d): denoised ECG signal
Fig. 5(e): Overlapping of ECG waveforms
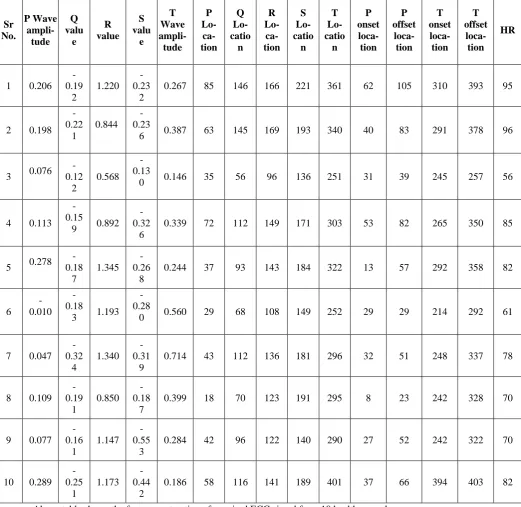
Table 1: ECG Analysis and feature extraction components
Above table shows the features extraction of acquired ECG signal from 10 healthy people.
Sr No. P Wave ampli-tude Q valu e R value S valu e T Wave ampli-tude P Lo- ca-tion Q Lo-catio n R Lo- ca-tion S Lo-catio n T Lo-catio n P onset loca-tion P offset loca-tion T onset loca-tion T offset loca-tion HR
1 0.206 -0.19 2 1.220 -0.23 2
0.267 85 146 166 221 361 62 105 310 393 95
2 0.198 -0.22 1 0.844 -0.23
6 0.387 63 145 169 193 340 40 83 291 378 96
3 0.076 -0.12 2 0.568 -0.13
0 0.146 35 56 96 136 251 31 39 245 257 56
4 0.113 -0.15
9 0.892 -0.32
6
0.339 72 112 149 171 303 53 82 265 350 85
5 0.278 -0.18 7 1.345 -0.26 8
0.244 37 93 143 184 322 13 57 292 358 82
6 -0.010
-0.18
3 1.193 -0.28
0 0.560 29 68 108 149 252 29 29 214 292 61
7 0.047 -0.32 4 1.340 -0.31 9
0.714 43 112 136 181 296 32 51 248 337 78
8 0.109 -0.19 1 0.850 -0.18 7
0.399 18 70 123 191 295 8 23 242 328 70
9 0.077 -0.16 1 1.147 -0.55 3
0.284 42 96 122 140 290 27 52 242 322 70
10 0.289 -0.25 1 1.173 -0.44 2
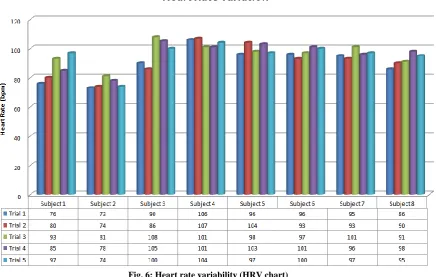
Analysis of heart rate variability of various subjects is shown in below figure 6.
Fig. 6: Heart rate variability (HRV chart)
IV.CONCLUSION
In the proposed work, After the complete anal-ysis of all ECG signal, we were able to determine and calculate the parameters with high precision and use these parameters to detect and confirm heart abnormalities. We additionally checked for baseline wandering because of motion artifact, so that we do not come out with wrong measurements due to movement of electrodes. Hence the analy-sis could be a very economical technique and much quicker than the present technology. This is less expensive, very less time consuming and can be done without any expert. Therefore we are able to term this methodology as a life-saving system. We have with efficiency calculated the Various ECG signal parameters however they might be used a lot effectively to seek out more heart abnormalities with higher accura-cies exploitation a lot of advanced case structures. We can conjointly study and analyze the ECG patterns of various diseases using the parameters found higher than which can help in deciding higher algorithms for heart diseases. We have targeted solely on software System design however the work may be extended as portable hardware design that a user will wear continually and instantly sees the heart condition.
ACKNOWLEDGMENT
This work is supported by Parul University, Vadodara. We would like to express our gratitude to
our guide Prof. Dimpal Khambhati, Assistance Pro-fessor at Department Of Biomedical Engineering, Parul Institute of Technology, Vadodara for all her diligence, guidance, encouragement and help throughout the period of work. Also we would like to express our sincere thanks to each and every person who supported our project and data collection.
REFERENCE
[1] Sahil Dalal,Rajesh Birok , „ECG Signals Analysis using PCA with Neural Network and Fuzzy Logic‟,IJARECE-journal, Volume 5, Issue 7, July 2016.
[2] Islam, M. K., G. Tangim, T. Ahammad, and M. R. H. Khon-dokar. "Study and analysis of ecg signal using matlab &labview as effective tools." International journal of Com-puter and Electrical engineering 4, no. 3 (2012): 404. [3] Olarte, N., and D. Lara. "Design of Medical Information
Stor-age System–ECG Signal." World Academy of Science, Engi-neering and Technology, International Journal of Medical, Health, Biomedical, Bioengineering and Pharmaceutical Engi-neering 5, no. 11 (2011): 608-612.
[4] Kumar, Amit, Lillie Dewan, Mukhtiar Singh, and H. A. R. Y. A. N. A. Kurukshetra. "Real time monitoring system for ECG signal using virtual instrumentation." WSEAS Transactions on biology and biomedicine 3, no. 11 (2006): 638-643.
[5] Ashok Kumar Dohare ,„Wonder Baseline Drift Removing in the Electrocardiogram Signals Using Variable Window in Me-dian Filter‟ , IJARCSSE, Volume 5, Issue 5, May 2015. [6] Chandel, Savita, and Kuldeep Singh. "ECG denoising using
wavelet transform and soft thresholding." International Journal of Advanced Research in Computer Science and Software En-gineering 6, no. 9 (2016).
[7] Priyanka and Gurjit Kaur,„Noise Removal in ECG Signal us-ing Windowus-ing Technique and its Optimization‟, Adv Biotech & Micro (Juniper Publishers), Volume 6 Issue1 - August [8] Rajni, Rajni, and Inderbir Kaur. "Electrocardiogram signal
[9] Bhat, Abdul Qayoon, Vineet Kumar, and Sunil Kumar. "De-sign of ECG data acquisition system." International Journal of Advanced Research in Computer Science and Software Engi-neering 3, no. 4 (2013).
[10] Vimala, K., and Dr V. Kalaivani. "Classification of cardiac vascular disease from ECG signals for enhancing modern health care scenario." Health Informatics-An International Journal (HIIJ) 2, no. 4 (2013): 63-72.
[11] Srivastava, V. K., and Devendra Prasad. "DWT-based feature extraction from ECG signal." American J. of Eng. Research (AJER) 2, no. 3 (2013): 44-50.
[12] Anjali Deshmukh, Yogendra Gandole , „Simulation of ECG signal using Advanced Virtual Instrumentation system Based on LAB VIEW‟, International Journal of Science and Research (IJSR), Volume 3 Issue 9, September 2014 .
[13] Abed, Bassam H., Raaed K. Ibrahim, and Mahmood Hamza Almuifraje. "Design and Implementation of ECG (Electrocar-diograph) Feature Extraction using Biomedical Workbench and LabView." International Journal of Computer Science and Mobile Computing 4, no. 5 (2015): 29-32.
[14] Savita Chandel , „A Review on Wavelet Techniques for Dif-ferent Noises Removal from ECG Signal‟, International Jour-nal of Advanced Research in Computer Science and Software Engineering, Volume 6, Issue 5, May 2016.
[15] Prasad, S. Varadarajan , „ECG Signal Processing Using Digital Signal Processing Techniques‟ , International Journal of Scien-tific & Engineering Research,Volume 4, Issue 12, December- 2013.
[16] Kumar, Rakesh, and Rajvir Singh. "Design and Comparative Analysis of ECG Data Acquisition System using Low Power Microcontroller." International Journal of Bio-Science and Bio-Technology 7, no. 5 (2015): 11-20.
[17] Subha, B., Subha SV, M. Anitha, M. Eniya, and M. Gaayathri. "DESIGNING A VIRTUAL MACHINE FOR IDENTIFICA-TION OF CARDIAC ARRHYTHMIAS USING LAB VIEW." (2013).
[18] Kumar, Anil, Jagannath Malik, and Vinod Kumar. "Virtual Lab: Real-time Acquisition and Analysis of ECG Signal." In-ternational Journal of Online and Biomedical Engineering (iJOE) 7, no. 3 (2011): 19-23.
[19] Nayak, Seema, M. K. Soni, and Dipali Bansal. "Filtering tech-niques for ECG signal processing." International Journal of Research in Engineering & Applied Sciences 2, no. 2 (2012): 671-679.
[20] Kaur, Harjeet, and Rajni Rajni. "Electrocardiogram signal analysis for R-peak detection and denoising with hybrid lin-earization and principal component analysis." Turkish Journal of Electrical Engineering & Computer Sciences 25, no. 3 (2017): 2163-2175.
[21] Mohamed, Muhidin A., and Mohamed A. Deriche. "An ap-proach for ECG feature extraction using daubechies 4 (DB4) wavelet." International Journal of Computer Applications 96, no. 12 (2014).
[22] Saritha, C., V. Sukanya, and Y. Narasimha Murthy. "ECG sig-nal asig-nalysis using wavelet transforms." Bulg. J. Phys 35, no. 1 (2008): 68-77.
[23] Khelil, Besma, Abdennaceur Kachouri, Mohamed Ben Mes-saoud, and Hamadi Ghariani. "P wave analysis in ECG signals using correlation for arrhythmias detection." In 4th Interna-tional multi-conference on systems, signals & devices, vol. 3. 2007.
[24] van Alste, Jan A., W. Van Eck, and O. E. Herrmann. "ECG baseline wander reduction using linear phase filters." Com-puters and Biomedical Research 19, no. 5 (1986): 417-427. [25] Lascu, Mihaela, and Dan Lascu. "LabVIEW electrocardiogram
event and beat detection." WSEAS Trans (2008).
[26] Joshi, Anand Kumar, Arun Tomar, and Mangesh Tomar. "A review paper on analysis of electrocardiograph (ECG) signal for the detection of arrhythmia abnormalities." International Journal of Advanced Research in Electrical, Electronics and Instrumentation Engineering 3, no. 10 (2014): 12466-12475 [27] “The ECG Leads, Polarity and Einthoven‟s Triangle – The
Student Physiologist.” [Online]. Available: https://thephysiologist.org/study-materials/the-ecg-leads-polarity-and-einthovens-triangle/. [Accessed: 16-Feb-2019]
[28] Crawford, Jacqui, and Linda Doherty. "Recording a standard 12-lead ECG: filling in gaps in knowledge." Journal of Para-medic Practice 1, no. 7 (2009): 271-278.
[29] Kumar, Amit, Lillie Dewan, Mukhtiar Singh, and H. A. R. Y. A. N. A. Kurukshetra. "Real time monitoring system for ECG signal using virtual instrumentation." WSEAS Transactions on biology and biomedicine 3, no. 11 (2006): 638-643
[30] Agham, N., and V. Thool. "Labview based physiological pa-rameters monitoring system for patient health-care." Int. J. Eng. Res. Technol 3 (2014).
[31] C. Bhyri, V. Kalpana, S. Hamde, and L. Waghmare, “Estima-tion of ECG features using LabVIEW,” Int. J. Comput. …, vol. 2, no. 1, pp. 320–324, 2009.
[32] Bhyri, Channappa, V. Kalpana, S. T. Hamde, and L. M. Waghmare. "Estimation of ECG features using LabVIEW." In-ternational Journal of Computing Science and Communication Technologies 2, no. 1 (2009): 320-324.
[33] Lascu, Mihaela, and Dan Lascu. "LabVIEW electrocardiogram event and beat detection." WSEAS Trans (2008).
[34] Sörnmo, Leif, and Pablo Laguna. "Electrocardiogram (ECG) signal processing." Wiley encyclopedia of biomedical engi-neering (2006).
[35] van Alste, Jan A., W. Van Eck, and O. E. Herrmann. "ECG baseline wander reduction using linear phase filters." Com-puters and Biomedical Research 19, no. 5 (1986): 417-427. [36] Bhyri, Channappa, Satish T. Hamde, and Laxman M.
Wagh-mare. "ECG Acquisition and Analysis System for Diagnosis of Heart Diseases." Sensors & Transducers 133, no. 10 (2011): 18.
[37] Chowdhury, E., and L. C. Ludeman. "Discrimination of car-diac arrhythmias using a fuzzy rule-based method." In Com-puters in Cardiology 1994, pp. 549-552. IEEE, 1994. [38] Bailey, James J., Alan S. Berson, Arthur Garson Jr, Leo G.
Horan, Peter W. Macfarlane, David W. Mortara, and Christoph Zywietz. "Recommendations for standardization and specifica-tions in automated electrocardiography: bandwidth and digital signal processing. A report for health professionals by an ad hoc writing group of the Committee on Electrocardiography and Cardiac Electrophysiology of the Council on Clinical Car-diology, American Heart Association." Circulation 81, no. 2 (1990): 730-739.
[39] Ara, Iffat, Md Najmul Hossain, and Md Abdur Rahim. "ECG signal analysis using wavelet transform." Int J Sci Eng Res 5 (2014).