Application of Data Mining in Census Data
Analysis using Weka
Ms.Dhwani Sondhi
Research Scholar701-B, JG-2, Vikaspuri, New Delhi, India
Abstract-Data mining which is the automatic process of extraction of useful data by using statistical and visualization techniques has become the new preference for statisticians, scientists and researchers alike. It helps in looking out for the most important trends in data and taking business -oriented decisions. The paper here presents an application of data mining in the analysis of census and looksat the noticeable trends. The objective of the paper is to discover the relevant information of gender inequality in all spheres from the primary census of the Raigarh district in Maharashtra with the help of appropriate data mining methods like clustering, visualization using the Weka tool.
Keywords: WEKA, Census, Gender inequality, data mining
I. INTRODUCTION
Observing trends and patterns in a large dataset has been a cause of concern amongst researchers and scholars. Data mining is an exercise that focuses primarily on extraction of potentially vital information from data houses which may allow researchers to look at the relevant patterns. Many statistical softwares help in carrying out such data mining and analyzing exercises. Weka is one of them and it helps in showing links among the different data points through its visualization methods. Though teacher student educational system has been studied from the point of view of data mining exercises as in [2], but this paper delves into the economic application of such kind of exercise. A census report of the Raigarh district in Maharashtra in the year 2011 is used here for capturing important trends in gender inequality using the Weka tool.
The paper begins with a brief summary in section 2 of recent work done related to the subject of data mining in general and Weka in particular.
Section 4 talks about the implementation of Weka tool for census analysis and then the chosen dataset is explained. Section 5 concludes and looks upon the future scopes of applications of data mining followed by references.
II. LITERATURE REVIEW
Data mining has played a very important role when it comes to exploring science and technology and taking informative decisions. Although manual data analysis is also efficient but it becomes cumbersome when it comes to large sized data. The initial studies of data mining were concerned with the educational system where the attributes of teachers and numeric variables from dataset were used to seek information for observing trends [2].„Educational data mining‟ is the application of data mining to judge students‟ navigation trends, group them according to their skills, gender etc. [14] Data mining that helps in „knowledge discovery in databases‟ helps in detecting financial frauds and for predicting customer behavior for better marketing outcomes. [6]It has contributed to the bioinformatics arena as well for example experimenting with automatic cancer detection and advancing models for „frame shifting sites‟. [8]Healthcare abuse and frauds have been identified and reduced by effective data mining methods. Along with that, it helps healthcare industry in identifying effective solutionsfor diseases. [10] Specific diseases like „breast cancer diagnosis‟ can be treated with appropriate data mining methods. [4] Trends and patterns can be identified in „course management‟ for online teachers through clustering techniques which identifies the type of students. [13]
III. ASPECTS OF DATA MINING
The data mining process consists of various steps which are-
Data amalgamation that is combining the relevant data
Data selection that is getting the data from respective database
Data modification that is the transfiguration of data into suitable forms for mining
Data mining that is using methods to see the patterns in data
Pattern study that is identifying the trends
Knowledge perception which is usageof visualization techniques to present the discovered knowledge.
1.Classification- It is a data mining task that delineates the data into groups and classes which is done in two steps which are “model construction” and “model usage” [4].
2.Clustering- Grouping of similar objects or attributes is performed per se and it is one of the most important independent techniques in WEKA because the similar attributes can be easily distinguished from the others.
3.Association- It is meant to show dependency relations between data points. Association rule generation is done through steps which are application of least support to find the most frequent data points in the dataset and then confidence restraints are used to make rules.
Figure 1-Data mining [11]
IV. IMPLEMENTATION
A.. WEKA as a mining tool
Weka (Waikato Environment for Knowledge Analysis) is software which contains various visualization tools for revealed modeling in real mining problems. [11]Weka is a very beneficial tool due to its easy availability and usability. To predict trends in a data through Weka, we need a dataset which contains both nominal and numeric attributes. There are options of data preprocessing, clustering, classification and regression analysis.
B. Dataset
The data used here is the primary census for the year 2011 for the district Raigarh in the state of Maharashtra which has been taken from the data.gov website (https://data.gov.in/catalog/villagetown-wise-primary-census-abstract-2011-maharashtra )
It consists of 99 villages with eight attributes regarding the population, literacy, composition of population, presence or absence of gender inequality etc. Generally WEKA accepts .arff file format but some versions accept .csv format too which was the case here.
There are eight variables and attributes in the dataset among which total male population, total female population, literate male population, literate female population, scheduled caste population and scheduled tribe population are the numeric attributes whereas gender inequality and comparison of scheduled caste to scheduled tribes are the nominal attributes where the responses are recorded as „yes‟ or „no‟ as per the software.
C. Working
Figure 2- Importing the file to get basic results
The visualisation of all data in preprocess gives the below results.
Figure 3: Two dimensional visualization graphs
The plot matrices are as follows
Figure 4- plot matrices
The cluster visualization of the dataset is as follows.
Figure 5-visualization of male population (Total male population against instance number)
Figure 6-visualization of female population
The above figure visualizes the total female population and the average of the same comes out to be 2215.
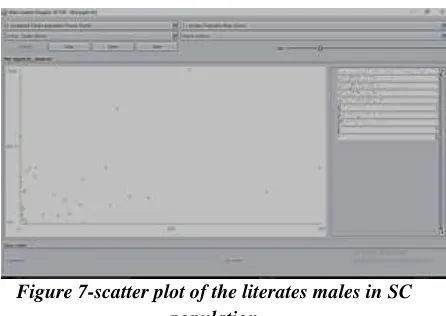
Figure 7-scatter plot of the literates males in SC population
and they are literate too where the average literate males are around 1991.
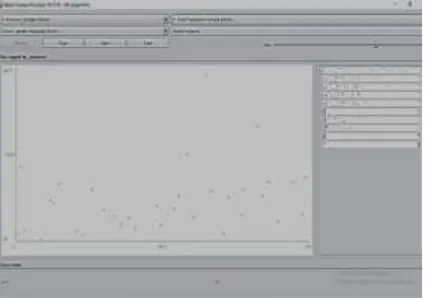
Figure 8-scatter plot of literate females in SC population
The above figure visualizes literate females in the scheduled castes population and the average comes out to be around 1360. The scatter plots of literate males and females per SC population clearly show the gap between males and females in terms of education.
The results are same for the scheduled tribes as well.
Figure 9-female population where gender inequality is marked
The figure above marks the presence of gender inequality factor in the total female population and it can be clearly seen that majority of the population is in the „yes‟ cluster group of gender inequality attribute.
Figure 10- Result of cluster visualize
As it is clear from the above picture, majority of the female population is marked in as yes for the question of gender inequality and it makes clear that there is bias against women in terms of both education and sex ratio which is clear from the above scatter plots and this kind of inequality is present in all parts of the population.
V. CONCLUSION AND FUTURE SCOPE
The paper attempts to study how the Weka tool may be used for census data analysis. Various data mining techniques have been applied to look at relationships. Clustering technique is done through the EM clustering method whose results easily show that the accuracy is quite high and such kind of exercises can be done for analyzing census datasets. Gender inequality is observed at all levels and all parts of population in the dataset.
REFERENCES
1. Agrawal, R., & Shim, K. (1996, August). Developing Tightly-Coupled Data Mining Applications on a Relational Database System. In KDD (pp. 287-290).
2. Baker, R. S. J. D. (2010). Data mining for education. International encyclopedia of education, 7(3), 112-118.
3. Berkhin, P. (2006). A survey of clustering data mining techniques. Grouping multidimensional data, 25, 71. 4. Diz, J., Marreiros, G., & Freitas, A. (2016). Applying Data
Mining Techniques to Improve Breast Cancer Diagnosis. Journal of medical systems, 40(9), 203.
5. Elder, J. (2009). Handbook of statistical analysis and data mining applications. Academic Press.
6. Fayyad, U., Piatetsky-Shapiro, G., & Smyth, P. (1996). From data mining to knowledge discovery in databases. AI magazine, 17(3), 37.
7. Frank, E., Hall, M., Holmes, G., Kirkby, R., Pfahringer, B., Witten, I. H., & Trigg, L. (2009). Weka-a machine learning workbench for data mining. In Data mining and knowledge discovery handbook(pp. 1269-1277). Springer US.
8. Frank, E., Hall, M., Trigg, L., Holmes, G., & Witten, I. H. (2004). Data mining in bioinformatics using Weka. Bioinformatics, 20(15), 2479-2481.
9. Han, J., Pei, J., &Kamber, M. (2011). Data mining: concepts and techniques. Elsevier.
10. Koh, H. C., & Tan, G. (2011). Data mining applications in healthcare. Journal of healthcare information management, 19(2), 65.
11. Markov, Z., & Russell, I. (2006). An introduction to the WEKA data mining system. ACM SIGCSE Bulletin, 38(3), 367-368.
12. Mining, W. I. D. (2006). Data Mining: Concepts and Techniques. Morgan Kaufinann.
13. Romero, C., Ventura, S., & García, E. (2008). Data mining in course management systems: Moodle case study and tutorial. Computers & Education, 51(1), 368-384.
14. Romero, C., & Ventura, S. (2013). Data mining in education. Wiley Interdisciplinary Reviews: Data Mining and Knowledge Discovery, 3(1), 12-27.
15. Shmueli, G., Bruce, P. C., Yahav, I., Patel, N. R., & Lichtendahl Jr, K. C. (2017). Data Mining for Business Analytics: Concepts, Techniques, and Applications in R. John Wiley & Sons.
16. Tan, P. N. (2006). Introduction to data mining. Pearson Education India.
17. Varlamis, I., Apostolakis, I., Sifaki-Pistolla, D., Dey, N., Georgoulias, V., & Lionis, C. (2017). Application of data mining techniques and data analysis methods to measure cancer morbidity and mortality data in a regional cancer registry: The case of the island of Crete, Greece. Computer Methods and Programs in Biomedicine, 145, 73-83. 18. Witten, I. H., Frank, E., Hall, M. A., & Pal, C. J.
![Figure 1-Data mining [11]](https://thumb-us.123doks.com/thumbv2/123dok_us/8583736.1719476/2.612.73.288.478.645/figure-data-mining.webp)