ISSN: 2231-5381
http://www.ijettjournal.org
Page 61
Arena Software Application In Order To
Identify the Productivity and Growth Capacity
in a Jeans Factory in Minas Gerais, Brazil
Thaís Zignago Borges¹, Tiago Bittencourt Nazaré², Patrícia Werneck Silva de Oliveira³ ¹Student ofIndustrialEngineering, Faculdades Integradas de Cataguases-FIC/UNIS ²Master in Engineering systems management, Universidade Católica de Petrópolis-UCP
³Expert in Sociology, Universidade Federal de Juiz de Fora-UFJF Cataguases/MG, Brazil
Abstract
The permanence and continuity for a company in the labour market rely on the necessity of continuous search to increase the productivity and to grow the competitivity. Therefore, this project aims to identify in a jeans factory the productive capability, in addition, to offer a new scenario where this can be expanded. For this research to be concluded there was a data collection over the process of time and motion study and it wascompleted during the company field visits. The data has been processed through a computer simulation that was done in the Arena Student 14 software, and it stated that recruiting more than two employees the productive capacity increased in 97,76%.
Keywords:Clothing Factory, Production, Computer Simulation.
I. INTRODUCTION
The quest for productivity and the growth of competitivity are the main terms for business to
survive. According to [1], “the clothing company
represents a significant area of the textile industry and it is practically widespread in the economy all over the world, what makes it more competitive” [2].
To be possible the analysis and evaluation of some cases that would not be able to do in real life, the computer simulation was used and turned to be a powerful tool to have an observation of the relevant processes and systems.In a place where the competition is growing, this has been an essential methodology for those who have to make the right decisions in many areas [3].
In a highly competitive world, many companies are more and more worried in excel themselves in the labour market to make difference in their area, for this issue it is necessary to provide an expand in the production capability in order to optimise their resources.
The main reason for this project, carried on a small-sized clothing factory based in Minas Gerais, a state of Brazil, and is focused on denim jeans, is to
identify the productive capacity and to offer a line production balancing through technics of computer simulation from collected data in the time and motion study using Student 14 Arena® software. The specific study objectives are: to create a 2D model of the actual structure to visualise better the scenario and to verify the processes that have a high occupation rate.
II. LITERATURE REVISION
A. Mapping and optimisation process
According to [4], the mapping process is a method used across the process management to improve the business performance, and it enables all the fabrication steps of product or service to bemore detailed.
The mapping process becomes an extremely renowned tool for the important role that it can perform, due to the help to understand structural dimensions of workflow, in order to have a development evaluation done and to give directions to a programme of activities redesign. [5] [6][7] expressed that the optimisation consists in finding the best solution for a certain problem. For this purpose, it is vital to analyse the possible solutions and establish a criterion to justify the choice.
III. METHODOLOGY
The study was supported by a
bibliographical research fulfilled in books, articles, monographs and in other electronic information sources, in order to find theoretical background, further appropriate topics and things related to possible tools to be used.
ISSN: 2231-5381
http://www.ijettjournal.org
Page 62
It was conducted some visits to thecompany, as an object for this project, during the working period with the intention to collect the necessary data for the research completion. The business hours start at 8a.m and finish 17p.m, with a break time of one hour. The visits were on 21st, 23rd,
24th,and 25thMay 2018, from 12p.m to 17p.m.
The production schedule is done in view of the fact when there is order demand. After that, what comes is the procedure implementation. Taking this into considerationthe available days for the visits and timing process the denim jeans was selected product.
A. The process’ flowchart
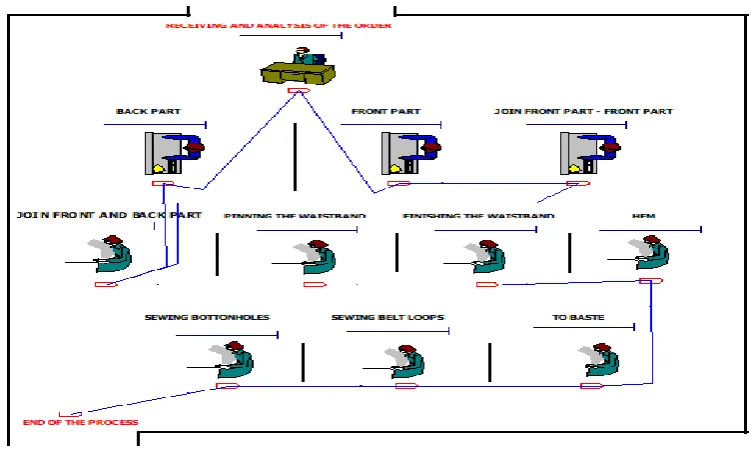
The productive process’ flow of the clothing factory, which had been done in the software Microsoft Office Visio 2013, shown in Fig. 1, can be seen the activity sequence performed by the company through the procedure.
When the order arrives, there is an analysis done by the company’s supervisors with the objective to check how many denim jeans will be produced and the availability of feedstock to be used to grant costumers’ necessities. Then, there is a division in the number of fabric pieces which 50% of them will be making the jeans’ front part e the other 50% the back part.
Fig. 1: Productive Process’ Flowchart of Denim Jeans
Later it starts the production itself, where simultaneously both front and back parts of the jeans are made. Soon there is the joint process of the middle to the front, and after that all the parts together. Then it is pinned the waistband in the jeans where it is sewed and received the finishing. Thereafter there is the hem confection which is the process where the bottom part of the clothing will be finished. Later, it is the basting process which is done in strategic places to secure the clothing, so that the seam will not be undone during the washing. Subsequently, features that help the use of accessories (belt, for instance) are sewed, which are known as belt loops. Sewing bottom hole is the end of the process.
B. Simulation Software: Arena
According to [10], the simulation is a kind of way to do experiments in a model, verifying which
answers the system will give towards to the modifications that have been made. For each change that was done, it is possible to check the results and analysethe system development based on the reports got from the software.
For [11], the Arena is formed by a range of groups (or units) which describes the real application and what works as a command of programming language. The basic elements of modeling in Arena are the ones that represent people, as well as the object, transactions, etc. which are changing during the use of the system; the work sectors display where will have the service or transformation done, and to finish, the flow that represents the ways the company will face through the stations.
[12] depicts about what you can do with Arena:
To form their processes to define, record and
ISSN: 2231-5381
http://www.ijettjournal.org
Page 63
To simulate the system’s future development
so that can be understood and identified opportunities to have better conditions.
To have a view of the activities with a
dynamicgraphic animation.
To analyse the system’s development and
also make the better choice to be executed in the business.
IV. RESULTS AND DISCUSSION
A. Company’s Scenario Analysis
The production area in a corporation is formed by twelve varied workingstations, each group found in Arena software is represented by an employee who does a specific activity.
These workingstations are divided into three sections
Arrivals, analysis,and division of the pieces;
The jeans fabrication process;
Completing the orders.
B. Workingstations Current Layout
The layout presents a production disposition where is formed by twelve main machines, which is shown in Fig. 2: 1 – the arrival and analysis of the order, 2- front and back part division, 3- back part, 4- front part, 5- join middle front/front, 6- join front and back parts, 7- waistband pinning, 8- finishing the waistband, 9- hem, 10- basting, 11- beltloops sewing, 12- buttonholes sewing.
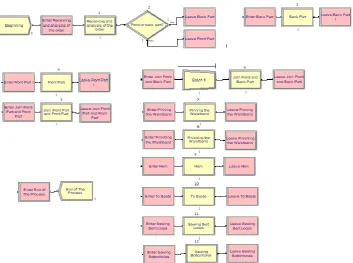
Fig. 2: Current productive process model made by Arena ®Student 14th Version software
The process wassimulated by using
reapplication parameters every 8 hours in a day, according to the company’s working hours. The model has shown that the production process could make 269 pieces/day, as it was expressed in Fig. 2.
C. 2D Modeling
For the current production of denim jeans to be represented, it was created a model in 2D by the software Arena® Student 14th Version, as it can be seen in Fig. 3. As it could be checked in Fig. 3, the productive process initiates with pieces analysis and their separation in parts: front and back.
ISSN: 2231-5381
http://www.ijettjournal.org
Page 64
After that, both parts have to go to differentprocesses until they are gathered again, and so, they are led to finishing steps, like waistband pinning and finishing, hem, buttonholes sewing, belt loops sewing and to baste. In the end, the piece of clothing will be delivered.
D. Processes with a Highoccupation Rate
Through the report represented in Fig. 4, which was created by Arena® Student 14th Version software, it can be seen the occupation index of each function during the process of making denim jeans.
There was the possibility to observe each performance and identify which activities have major occupation indexes. Among the twelve productive stages, the process of making both front and back parts of jeans show the highest occupation rate, 99,89%, and 99,95% respectively. These stages were considered the critical steps of the process, once it was analysed the high demand for both due to the many varied tasks which the employees have to do.
Fig. 4: The function’s occupation index during the productive stages
E. Offered Balancing in the Production Line
Considering what the productive process represents nowadays, it was made a new computer simulation for the company (Fig. 5), disregarding the costs due to the modifications. This new offer includes two more employees, being set like: one for the front part sector, and the other, to the back part.
Fig. 5: Production simulation in Arena® Student 14 with the offered scenario.
In this simulation could be seen a rise in the productive capability which raised the production of 269 pieces/day to 532 pieces/day, corresponding to be 97,76% higher than before.
V. CONCLUSIONS
ISSN: 2231-5381
http://www.ijettjournal.org
Page 65
an increase in the daily quantity of pieces produced.The data was collected through the process of time and motion simulated in the software.
It was stated through the computer simulation that the company with the workforce and machines, which it already has, is capable of producing 269 denim jeans a day currently. It was found two processes whose indexes are higher related to occupation: the sectors of the front and back parts of the clothing.For this reason, it was offered a new computer simulation where two new employees were added, each one in a sector mentioned. The scenario proposed to disregard the costs due to the modifications.
In this way, with a rise of 16,66% in the workforce, it could reach a significant improvement in the daily production, where it was 269 pieces/day and would become 532 pieces/day, increasing the production in 97,76%.
REFERENCES
[1] Henriques, Reynaldo Pinto; et al. Modelo de Simulação de Lotes para a Produção na Indústria de Confecção. Available
in:<http://www.aedb.br/seget/arquivos/artigos07/1183_Mo delo%20de%20Simulacao%20de%20Lotes%20para%20a %20Producao%20na%20Industria%20de%20Confeccao.p df>. Accessed September 9, 2018.
[2] Henriques, Reynaldo Pinto; et al. Modelo de Simulação de Lotes para a Produção na Indústria de Confecção. p 1.
Available in
:<http://www.aedb.br/seget/arquivos/artigos07/1183_Mod elo%20de%20Simulacao%20de%20Lotes%20para%20a% 20Producao%20na%20Industria%20de%20Confeccao.pdf >.Accessed September 2, 2018.
[3] Vogel, C. C; Schmidt, C. A. P.; Santos, J. A. A.; Silva, A. L. Aplicação de técnicas de simulação e de ergonomia ao processo de paletização de caixas de leite UHT: um estudo de caso,Scientia Plena, v. 9, n.6, 1-10, 2013.
[4] SIlva, Ricardo William; OLIVEIRA, Iara Silva. Gerenciamento de processos para melhora da prestação do serviço público: um estudo de caso em um órgão público na cidade de Belém. João Pessoa, 2016.
[5] Gomes, Diogo Rodrigues. Mapeamento de Processos como ferramenta de avaliação de processo produtivo: Um estudo de caso em uma empresa do pólo de cerâmica de Campos - RJ. 2009. p. 3. Trabalho de Conclusão de Curso (Graduação) - Curso de Engenharia de Produção, Universidade Estadual Norte Fluminense Darcy Ribeiro, Campos Dos Goytacazes, 2009. Available in: < http://www.uenf.br/Uenf/Downloads/LEPROD_6975_125 1810639.pdf>. Accessed March 20, 2018.
[6] Correia, Kwami S. A; Leal, Fabiano; Almeida, Dagoberto A. de. Mapeamento de Processo: Uma Abordagem para Análise de Processo de Negócio. XXII ENEGEP – Encontro Nacional de Engenharia de Produção Curitiba
PR. 2002. Available in:
<http://www.abepro.org.br/biblioteca/ENEGEP2002_TR1 0_0451.pdf>. Accessed April 6, 2018.
[7] Triboli, Edson Paulo de Ros. Estudo e otimização de processo de secagem de iogurte por otimização com secador em escala piloto. São Paulo, 2014.
[8] Patton, M. G. Qualitative Research and Evaluation Methods, 3 ed. Thousand Oaks, CA: Sage, 2002. [9] Martins, Petrônio G. Laugeni, Fernando Piero.
Administração da produção. 2. ed. São Paulo: Saraiva, 2010.
[10] Gomes, Diogo Rodrigues. Mapeamento de Processos como ferramenta de avaliação de processo produtivo: Um estudo de caso em uma empresa do pólo de cerâmica de Campos - RJ. 2009.Trabalho de Conclusão de Curso (Graduação) - Curso de Engenharia de Produção, Universidade Estadual Norte Fluminense Darcy Ribeiro, Campos Dos Goytacazes, 2009. Available in: < http://www.uenf.br/Uenf/Downloads/LEPROD_6975_125 1810639.pdf>. Accessed June 17, 2018.
[11] Prado, D. Usando o Arena em Simulação. 5. ed. Belo Horizonte: Editora de Desenvolvimento Gerencial, 2004. [12] Yadav, P. Sharma, S.Enhancement of Productivity through