Copyright © The Author(s). All Rights Reserved. Published by American Research Institute for Policy Development DOI: 10.15640/jcsit.v6n2a3 URL: https://doi.org/10.15640/jcsit.v6n2a3
The Quadratic Entropy Approach to Implement the Id3 Decision Tree Algorithm
Adewole Adetunji Philip
1& Udeh Stanley Nnamdi
2Abstract
Decision trees have been a useful tool in data mining for building useful intelligence in diverse areas of research to solve real world problems of data classifications. One decision tree algorithm that has been predominant for its robust use and wide acceptance has been the Iterative Dichotomiser 3 (ID3). The splitting criteria for the algorithm have been the Shannon algorithm for evaluating the entropy of the dataset. In this research work, the implementation of the ID3 algorithm using the Quadratic entropy algorithm in a bid to improve the accuracy of classification of the ID3 algorithm was carried out. The results show that the implementation of the ID3 algorithm using the quadratic entropy with some selected datasets have a significant improvement in the areas of its accuracy as compared with the traditional ID3 implementation using the Shannon entropy. The formulated model makes use of similar process of the ID3 algorithm but replaces the Shannon entropy formula with the Quadratic entropy.
Keywords: Decision tree, ID3, Entropy, Quadratic entropy, Data mining, Classification 1.0 Introduction
Data mining, according to [1], is the extraction of hidden predictive information and unknown data, patterns, relationships and knowledge by exploring the large data sets which are difficult to find and detect with traditional statistical methods. Data mining is also known as analyzing data to discover a pattern and using that pattern to make a prediction for future occurrence of same or similar situation. The major tasks in analyzing data cuts across these three stages given below:
1) Descriptive analytics 2) Predictive analytics 3) Prescriptive analytics
Data mining is concerned more with the predictive analytics. But it suffices here to say that, without proper descriptive analytics there would be no proper predictive analytics which will in turn enhance the prescriptive analytics. Data mining has been a useful tool in analyzing data from loads of different kinds of databases to discover useful patterns in order to develop a working model that can help in the development of useful intelligence that aid decision making. The illustrations of [2] are employed here as it presents data mining with simple, easy to grasp illustrations and connections. Data mining is more about explaining the past and predicting the future by employing the means of data analysis. Hence the two broad categories of data mining; diagnosis and prognosis which is about studying to understand the past and predicting the future.
2.0 Literature Review
The first mention of the ID3 algorithm was in the work done by John Ross Quinlan [3] in his work on Induction of Decision trees. In his work Quinlan employed the Occam’s razor principle in order to achieve the preference of simpler trees that produce fast and reliable decision models. A comparative analysis implementing the C4.5 algorithm based on different entropies was carried out by [4]. Some of the entropies considered were:
Shannon entropy
Quadratic entropy
Havrda and Charvt entropy
R’enyi entropy and
Taneja entropy
The result of this comparative analysis compared the classification outcomes of implementing the C4.5 algorithm using each of these entropy techniques. The efficiency of the quadratic entropy was shown to have a better result in most of the datasets used. Therefore, this study implements the quadratic entropy based on information gain with the ID3 algorithm and compares its result with the ID3 algorithm based on Shannon entropy to show their outcomes.
3.0 Research Methodology 3.1 ID3 Algorithm
The ID3 algorithm leverages on some principles such as the:
Occam’s Razor [3]
Information Theory [5] and
Top-Down Induction of Decision Trees [3].
These principles form the basis for the development of this algorithm and hence modulates its working principle. The most important section that determines the power of classification of the ID3 algorithm is that of attribute selection. The choice of which attribute to select for splitting is one that affects the performance of the algorithm in general.
The ID3 algorithm uses the Information theory proposed by Claude E. Shannon in his work “A Mathematical Theory of Communication” in 1948 [5]. The major highlight from the work done by Shannon is that of “Entropy”. Entropy, which is known as the degree of orderliness/disorderliness in a system, as defined by science but was used as the amount of uncertainty involved in the value of a random variable. This forms the basis for deciding at every node of the tree what variable to split on by calculating the information gain and the class with the highest information gain is taking as the attribute to split on.
The Shannon entropy is given thus:
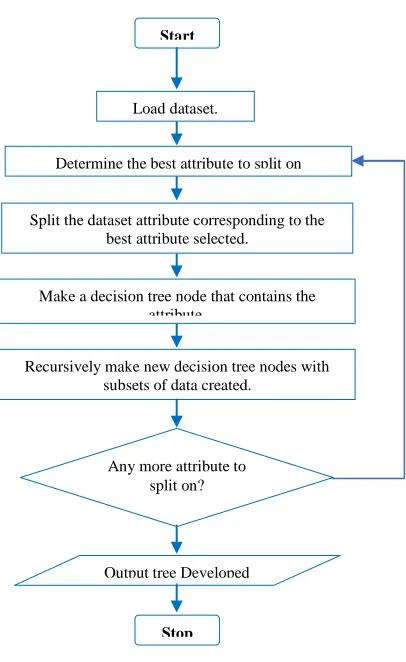
Figure 1: ID3 Algorithm Flowchart 3.2 Entropy
One of the most important part of the decision tree algorithm of ID3 is the splitting criteria. The choice on how to split and in what direction to go when traversing and building a tree from a dataset is one that has shown from literature to have a significant impact on the eventual outcome of the tree produced by the algorithm. Among all the definitions of entropy, we adopt the definition given by [6] as contained in [7], that entropy is the measure of disorder in the range between total ordered (structured) and total disordered (unstructured) data in a given data set. The ID3 algorithm implements its algorithm based on the Shannon entropy [5]. However, several works have been carried out around this point to seek the improvement in classification by introducing other splitting algorithm which tends to provide better information than the information being gained from the Shannon entropy.
3.3 Quadratic Entropy
The quadratic entropy was first introduced in [8]. This work considers the finite discrete random variable X with a complete probability collection given below:
𝑝𝑖 ≥ 0 𝑖 = 1 … 𝑘 , 𝑘𝑖=1𝑝𝑖 = 1 ……….. (2)
The quadratic entropy is defined below: 𝐸 𝑥 = 𝑘 𝑝𝑖 1 − 𝑝𝑖
𝑖=1 ……….. (3)
3.4 Information Gain
The information Gain of a given dataset gives the attribute to split upon. It takes the values evaluated from entropy at the set level and at the subset level and evaluates the Information Gain. The value of the Information Gain from this evaluation is compared for each attribute in the dataset and the attribute with the greatest Information Gain value is taken as the attribute to split upon and the case where there is a tie, any of the tied attribute suffices and the cycle continues in that fashion.
Start
Stop Load dataset.
Determine the best attribute to split on
Split the dataset attribute corresponding to the best attribute selected.
Make a decision tree node that contains the attribute.
Recursively make new decision tree nodes with subsets of data created.
Any more attribute to split on?
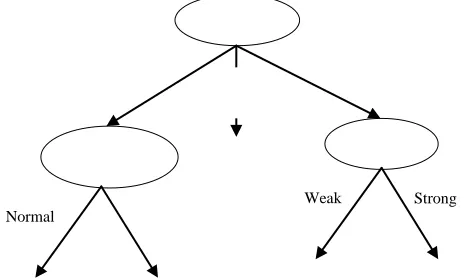
Outlook
Wind Humidity
Overcast
Rainy
High Sunny
Normal
Yes
Yes No
Yes No
Strong Weak
The Information Gain is evaluated thus:
𝐺 𝑆, 𝐴 = 𝐸𝑛𝑡𝑟𝑜𝑝𝑦 𝑆 − 𝑆𝑣
𝑆 𝐸𝑛𝑡𝑟𝑜𝑝𝑦 𝑆𝑣
𝑉∈𝑉𝑎𝑙𝑢𝑒𝑠 (𝐴) …(4)
3.5 Play Tennis Dataset
Table 1 Play Tennis Dataset
Day Outlook Temp. Humid Wind Play?
1 Sunny Hot High Weak No
2 Sunny Hot High Strong No
3 Overcast Hot High Weak Yes
4 Rain Mild High Weak Yes
5 Rain Cold Normal Weak Yes
6 Rain Cold Normal Strong No
7 Overcast Cold Normal Strong Yes
8 Sunny Mild High Weak No
9 Sunny Cold Normal Weak Yes
10 Rain Mild Normal Weak Yes
11 Sunny Mild Normal Strong Yes
12 Overcast Mild High Strong Yes
13 Overcast Hot Normal Weak Yes
14 Rain Mild High Strong No
The dataset above shows the behavioral observations of a tennis player and what drives his decision making. There are four attribute classes with various possibilities. The classification column has two possibilities; yes or no. This shows the decision made by the tennis player whether to play or not. The attributes here are Outlook (Sunny, Overcast and Rain), Temperature (Hot, Mild or Cold), Humidity (High or Normal) and Wind (Weak or Strong).
Here we apply the quadratic entropy to create the decision tree using the ID3 algorithm in the following steps:
Calculate entropy on each attribute relative to the general dataset
Calculate entropy of each of the possibilities of the various attributes relative to the attribute data
Evaluate the Information gain
Determine the attribute to split on by choosing the attribute with the highest Information Gain.
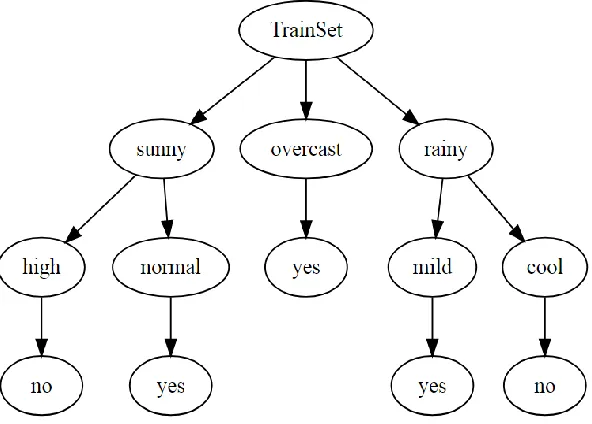
Figure 2: Tree produced by the ID3 algorithm implementing the quadratic entropy as the best tree for making future predictions.
3.6 Data Prediction
Table 2 Model Test set
Day Outlook Temp. Humidity Wind Play?
Today Sunny Cold Normal Weak ?
Tomorrow Sunny Mild Normal Weak ?
Based on the model above, the prediction can be made for the given test cases as Yes on both cases. The player will most likely play tennis on those days based on the data given.
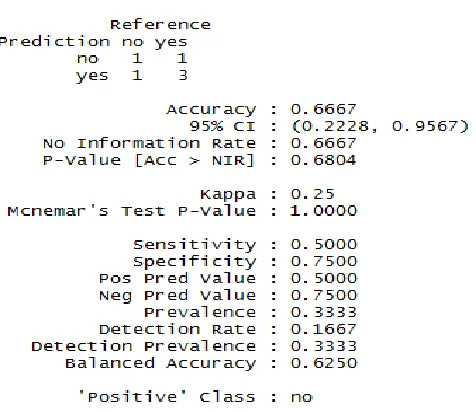
3.7 Confusion Matrix
The confusion matrix is an expression that shows the reliability of an algorithm. It shows its accuracy of prediction and general performance. It shows a cross comparison of the results of the algorithm with the original given data set values. For a reliability data model there will be minimal discrepancies in their outcomes at various instances being reviewed.
4.0 Experimentation and Result
The R programming language was employed in the implementation of both algorithms and the results can be seen as presented later below. For a given model prediction, assume a 2 by 2 matrix for its confusion matrix expressed below:
Reference
Predicted Event No Event 𝐸𝑣𝑒𝑛𝑡
𝑁𝑜 𝐸𝑣𝑒𝑛𝑡 𝐴 𝐵𝐶 𝐷
Sensitivity = A/(A+C) Specificity = D/(B+D)
Prevalence = (A+C)/(A+B+C+D)
PPV = (sensitivity * prevalence)/((sensitivity*prevalence) + ((1-specificity)*(1-prevalence))) NPV = (specificity * (1-prevalence))/(((1-sensitivity)*prevalence) + ((specificity)*(1-prevalence))) Detection Rate = A/(A+B+C+D)
Detection Prevalence = (A+B)/(A+B+C+D) Balanced Accuracy = (sensitivity + specificity)/2
Figure 4: Model validation using traditional ID3 algorithm
Figure 5: Model formed using Q-ID3 algorithm
4.1 Result Discussion
The above data/model visualizations was implemented using the R-Studio IDE of the R programming language. The dataset is of a small size of 14 instances and was split into training and test sets on a 60:40 ratio respectively. The algorithm spelt out initially in this work was followed as stated and the results when applied to the specified algorithms were shown. There are some significant differences between the two models as can be seen in their various outputs where the ID3 algorithm implemented using the quadratic entropy shows a better accuracy than the ID3 algorithm implemented with the Shannon entropy methodology. Though the size of the dataset is significantly small but it goes to show that the ID3 algorithm can be improved upon in terms of accuracy of prediction when implemented using the Quadratic entropy.
5.0Conclusion
The quadratic entropy has been implemented as against the traditional Shannon entropy. This has shown that the ID3 algorithm has better results in its accuracy level when applied considering a different approach to evaluating the entropy of the dataset. THOUGH, IT HAS BEEN AN ONGOING WORK IN RESEARCH FIELD TO LOOK FOR WAYS OF IMPROVING ON EXISTING SYSTEMS AND MECHANISMS TO YIELD BETTER RESULTS THAN THEY ARE ALREADY
DOING AT THE MOMENT. THIS WORK IS AN EXTENSION OF SUCH EFFORTS TO BUILD ON THE POWER OF THE ID3
ALGORITHM. THE RESULTS SHOW THE OUTCOME OF SUCH A PROPOSITION AS THIS.
5.1 Limitations of the Study
This study has been carried out to implement the model formulation of the ID3 algorithm by implementing a different approach to evaluating the entropy of the dataset. It has some limitations of which we present some of them below:
This study does not consider missing value handling as it allows the ID3 algorithm to handle missing values in dataset, if any, in its traditional method.
The study does not extend to the pruning abilities of the ID3 algorithm.
This study also did not cover areas of weighted attributes. 5.2 Areas for Further Research
Here are some suggestions for further research as a direction for continuous studies:
Extend the study to handle missing values with a better methodology than what the algorithm has at the moment.
Extend the performance of the algorithm by improving on its data type; continuous or discrete.
References
Kaur, S., & Bawa, R. K. (2015). Future Trends of Data Mining in Predicting the Various Diseases in Medical Healthcare System. International Journal of Energy, Information and Communications.
Sayad, S. (2017). An Introduction to Data Mining. Retrieved from http://www.saedsayad.com/ Quinlan, R. J. (1986). Induction of Decision Trees. Machine Learning 1, 81-106.
Sharma, S., Agrawal, J., & Sharma, S. (2013). Classification Through Machine Learning Technique: C4.5 Algorithm based on Various Entropies. International Journal of Computer Applications, 20-27.
Shannon, C. E. (1948). A Mathematical Theory of Communication. Bell System Technical Journal, 379–423. Holzinger, A. (2012). On knowledge discovery and interactive intelligent visualization of biomedical data
Challenges in Human–Computer Interaction & Biomedical Informatics. International Conference on Data Technologies and Applications (DATA), (pp. 5-16). Rome.
Holzinger, A., Hortenhuber, M., Mayer, C., Bachler, M., Wassertheurer, S., Pinho, A. J., & Koslicki, D. (2014). On Entropy-Based Data Mining. Knowledge Discovery and DataMining, LNCS 8401, 209-226.
![Vad jag i min verksamhet som språkvårdare skulle vilja att datorlingvistiken bidrog med (What I in my practice as a language consultant would want that computational linguistics contributed with) [In Swedish]](data:image/gif;base64,R0lGODlhAQABAIAAAP///wAAACH5BAEAAAAALAAAAAABAAEAAAICRAEAOw==)