(UDC: 004.922:612.15)
Blood flow in arterial segments: rigid vs. deformable walls simulations
P. K. Siogkas1,2, A. I. Sakellarios1,2, T. P. Exarchos1,2, K. Stefanou1,2, D. I. Fotiadis1,2, K.
Naka3, L. Michalis3, N. Filipovic4, O. Parodi5
Foundation of Research and Technology Hellas -Biomedical Research Institute, Ioannina, Greece
Unit of Medical Technology and Intelligent Information Systems, Dept of Material Science and Engineering, University of Ioannina, Ioannina, Greece.
[email protected], [email protected], [email protected], [email protected], [email protected]
Medical School, University of Ioannina, Ioannina, Greece [email protected], [email protected]
University of Kragujevac, Kragujevac,Serbia [email protected]
Instituto di Fisiologia Clinica, Consiglio Nazionale delle Ricerche, Pisa, Italy [email protected]
Abstract
In this work, a comparative study between Fluid Structure Interaction (FSI) simulations and simulations in which the arterial wall is assumed to be rigid on two 3D coronary arterial models is performed to draw some interesting conclusions about the main advantages and disadvantages of the two simulation methods. The obtained results indicate a strong correlation between the two methods regarding the distributed Wall Shear Stress (WSS), the average WSS as well as the areas of low WSS.
Key words: Fluid Structure Interaction, Rigid Wall, Wall Shear Stress.
1. Introduction
The study and the in depth understanding of the mechanisms of atherosclerosis are of great critical importance nowadays since cardiovascular diseases are the major cause of death in developed countries. Atherosclerosis is a cardiovascular disease which causes the thickening and hardening of the arterial wall, resulting to reduced or completely obstructed blood flow. Computational Fluid Dynamics (CFD) combined with 3D arterial models generated from medical images such as Intravascular Ultrasound (IVUS) with angiographies, Magnetic Resonance Imaging (MRI) and Computed Tomography images (CT) have set the ground for accurate blood flow simulations, providing some insight to the complex mechanisms of the generation and development of atheroma.
al. 2008). Therefore, the interaction between the arterial wall and the blood domain is not taken into account. This method has the advantage that only the arterial lumen needs to be reconstructed and discretized. Consequently, blood flow simulations are carried out on the lumen, resulting thus to quick, yet relatively accurate results.
Recent advances in CFD however gave the opportunity of combining the arterial wall domain with the blood domain, taking into account the interaction between the blood and the arterial wall (Leach et al. 2010, Kock et al. 2008, Bluestein et al. 2008, Tang et al. 2001, Lee et al. 2002, Borghi et al. 2008, Torii et al. 2008, Tang et al. 2004, Li et al. 2007, Torii et al. 2009). The use of Fluid Structure Interaction (FSI) models is gaining ground over the past few years, since they can incorporate the deformation that blood causes to the arterial wall and vice versa. FSI methods suffer from the drawback that the required time for the simulations is evidently larger than the simulations with rigid walls. This is due to the fact that both the lumen and the arterial wall need to be reconstructed and discretized. However, the simulations are more realistic and approach the human circulatory system more accurately.
In this work, we present a comparative study between the two types of simulations on two patient-specific coronary arteries. Results on WSS distributions as well as areas of low WSS are obtained in order to demonstrate the advantages and disadvantages of the two methods.
2. Materials and methods
a) Rigid Wall assumption
We assume that the flow is laminar and incompressible and the blood is modelled as a Newtonian fluid. Blood flow is modelled using the Navier-Stokes and the continuity equations:
( ) '
v v v f
t
(1)
(v) 0
(2)
where v is the blood velocity vector, τ is the stress tensor and fBare the total body forces. The stress tensor is defined as:
2
ij ij
p
τ (3)
whereij is the Kronecker delta,
is the blood dynamic viscosity, p is the blood pressure andij
is the strain tensor which is defined as:
1 2
T ij
v v
(4)
b) Fluid Structure Interaction (FSI)
In FSI simulations, the blood domain is deformable. Therefore, the equation of momentum conservation is used:
Bt
v
v w v τ f
(5) where is the blood density, v is the blood velocity vector, wis the moving mesh velocity
vector, τ is the stress tensor and fBare the total body forces. The stress tensor is decribed above.
In our simulations, blood was treated as Newtonian fluid with a density ρ=1060 kg/m3 and dynamic viscosity μ=0.0035 Pa s.
Regarding the arterial wall domain, the following momentum conservation equation is used:
,
s s s s
B
τ f d (6)
where τs is the arterial wall stress tensor, s
B
f are the body forces per unit volume, s is the
arterial wall density and ds is the local acceleration of the solid.
The fluid and the solid domain are coupled together through displacement compatibility and traction equilibrium as it is shown in the following equations:
ˆ ˆ , , S F ,
s s f f x y z FSI FSI
τ n τ n (7)
, ,
S F .s fx y z FSI FSI
d d (8)
where SFSIis a group of points on the arterial wall and F FSI
is a group of points on the lumen.
Eq. (7) shows that the solid and the fluid stresses acting on the common surface of the two domains are in equilibrium, whereas Eq. (8) shows that the common surfaces of the two domains have the same displacements.
In our FSI simulations, the arterial wall is treated as a hyperelastic material due to the lack of in vivo data on wall fiber direction. We use a nine parameter Mooney-Rivlin formulation to model the arterial wall (Torri et al. 2009). The strain energy function is calculated by the following equation:
_ _ _ _ _
2
2 1 1 2
10 01 20 11
_ _ _ _
2 3 2
2 1 1 2
02 30 21
_ _ _
3 2
1 2 2
12 2 03
( 3) ( 3) ( 3) ( 3)( 3)
( 3) ( 3) ( 3) ( 3),
1
( 3)( 3) ( 3) ( 1)
W c I c I c I c I I
c I c I c I I
c I I c I J
d
(9)
where I1 is the first deviatoric strain invariant, I2 is the second deviatoric invariant and J is
2 ,
d K
(10)
where K is the bulk modulus which is set equal to 1x10⁻⁵.
Again, the applied boundary conditions for the fluid domain are the same as in the rigid walls simulations whereas, for the wall domain, the distal ends of both arteries are assumed as fixed supports to restrict motion at these points.
Fig. 1. The top row images depict the inlet and outlet boundary conditions for the first arterial model, whereas the bottom row images depict the boundary conditions for the second one,
respectively.
c) Arterial Segments
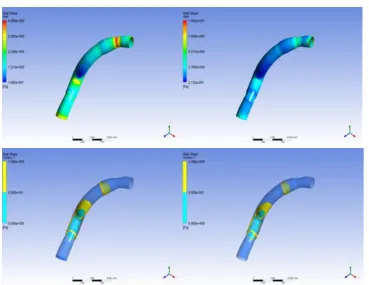
Fig. 2. Calculated WSS distribution for the FSI (top left) and rigid wall (top right) simulations. Areas of low WSS (0-1 Pa) for the FSI (bottom left) and rigid wall (bottom right) simulations
(Arterial Model 1).
The generated models are then discretized. In order to define the mesh size, we performed a sensitivity analysis to identify which mesh size values achieve accurate results in the best possible simulation time. The two lumen models are discretized into 200000 hexahedral elements, whereas the two wall models are discretized into 275000 tetrahedral elements.
3. Results
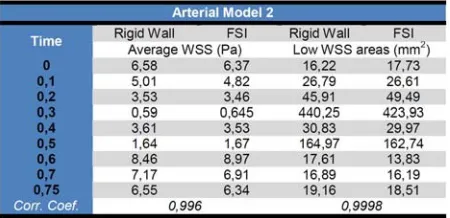
We performed transient simulations on both arterial models producing results on average WSS as well as areas of low WSS (Figs 2, 3). We finally calculated the correlation coefficient so as to see how the results of the two methods correlate (Tables 1, 2).
4. Discussion
phase of the cardiac cycle. From the obtained results, we observe that WSS distribution is very similar for both types of simulation. Furthermore, the areas of low WSS, which have a high clinical value due to their complication to atherosclerotic plaque development, are both qualitatively and quantitatively similar. Comparing the average WSS for every timestep, we calculated a correlation coefficient of 0.989 and 0.996 for the first and second arterial model, respectively. Moreover, the correlation coefficient is increased for the case of the region of low WSS, as it is 0.998 and 0.999 for the two case studies.
Table 1. Calculated results for the two simulation methods for the first arterial model.
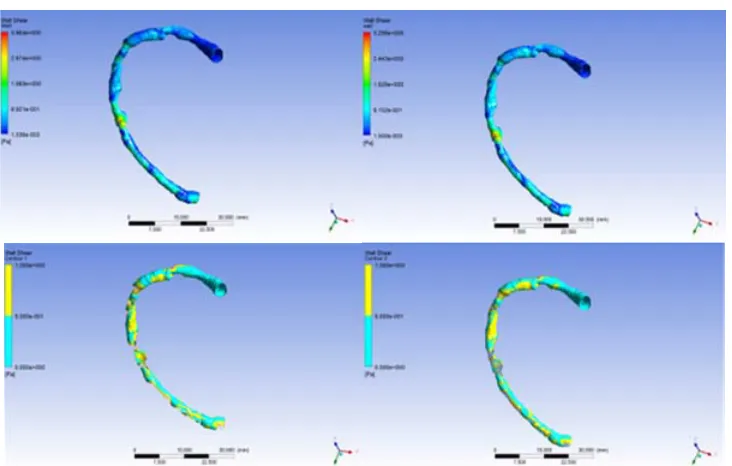
Fig. 3. Calculated WSS distribution for the FSI (top left) and rigid wall (top right) simulations. Areas of low WSS (0-1 Pa)for the FSI (bottom left) and rigid wall (bottom right) simulations
(Arterial Model 2).
It should be noted that, in contrast to the similar simulation results, the computational time between the simulation with rigid walls and the one with deformable walls is evidently different. In particular, while the time required for the simulation with rigid walls is approximately 30-40 minutes, the computational time for the FSI simulation is a almost 5 hours for the same mesh for the blood fluid domain and an adequate mesh size for the wall domain. All simulations were carried out on an HP Workstation with a Xeon E5405 quad-core CPU and 8 GB of RAM.
However, FSI analyses have the advantage that they are considered to be more accurate and realistic since they incorporate the interaction between the blood and the wall domain. Moreover, as future work, the material characteristics of the atherosclerotic plaque will be incorporated into the arterial wall domain, making thus FSI simulations even more accurate and realistic.
Проток
крви
у
артеријским
крвним
судовима
:
симулације
крутих
у
односу
на
деформабилне
зидове
K. P. Siogkas1,2, I. A. Sakellarios1,2, P. T. Exarchos1,2, K. Stefanou1,2, I. D. Fotiadis1,2, K.
Naka3, L. Michalis3, N. Filipovic4, O. Parodi5
Foundation of Research and Technology Hellas -Biomedical Research Institute, Ioannina, Greece
Unit of Medical Technology and Intelligent Information Systems, Dept of Material Science and Engineering, University of Ioannina, Ioannina, Greece.
[email protected], [email protected], [email protected], [email protected], [email protected]
Medical School, University of Ioannina, Ioannina, Greece [email protected], [email protected]
University of Kragujevac, Kragujevac,Serbia [email protected]
Instituto di Fisiologia Clinica, Consiglio Nazionale delle Ricerche, Pisa, Italy [email protected]
Резиме
U ovom radu, vršeno je poređenje simulacija Solid-Fluid Interakcija (SFI) i simulacija u kojima se podrazumeva da je arterijski zid krut u 3D modelu koronarne arterije kako bi se izvukli zanimljivi zaključci o glavnim prednostima i manama dve simulacijske metode. Dobijeni rezultati ukazuju na jaku povezanost između dve metode u pogledu distribuiranog smičućeg naponu na zidu (SNZ), prosečnog SNZ kao i područja malog SNZ.
Кључнеречи: Солид – Флуидинтеракција, Крутизид, Смичућинапонназиду
References
Bluestein D., Alemu Y., “Influence of microcalcifications on vulnerable plaque mechanics using FSI modeling,” J Biomech., vol. 41, pp. 1111-1118, 2008
Borghi A., Wood N. B., Mohiaddin R. H., Xu X. Y, “Fluid-Solid interaction simulation of flow and stress pattern in thoracoabdominal aneurysms: A patient-specific study”, J. of Fluids and Structures., vol. 24, pp. 270-280, 2008.
Kock S.A., Nygaard J.V., “Mechanical stresses in carotid plaques using MRI-based fluid– structure interaction models,” J Biomech., vol. 41, no. 8, pp. 1651-1658, 2008.
Koshiba N, Ando J, Chen X, Hisada T. “Multiphysics simulation of blood flow and LDL transport in a porohyperelastic arterial wall model”, Transactions of the ASME, Journal of Biomechanical Engineering, vol. 129, pp. 374–385, 2007.
Leach J.R., Rayz V.L., Mofrad M.R.K., Saloner D., “An efficient two-stage approach for image-based FSI analysis of atherosclerotic arteries”, Biomech Model Mechanobiol., vol. 9, pp. 213-223, 2010.
Li M.X., Beech-Brandt J.J., John L.R., Hoskins P.R., Easson W.J., “Numerical analysis of pulsatile blood flow and vessel wall mechanics in different degrees of stenoses”, J. of Biomech., vol. 40, pp. 3715-3724, 2007.
Papafaklis M., Bourantas C., Theodorakis P., Katsouras C., Fotiadis D., Michalis L., "Relationship of Shear Stress with In-stent Restenosis: Bare Metal Stenting and the Effect of Brachytherapy." Int. J. of Card. 2009, Vol. 134, pp. 25-32.
Perktold K., Hofer M., Rappitsch G., Loew M., Kuban B., Friedman M., "Validated Computation of Physiologic Flow in a Realistic Coronary Artery Branch." J. of Biomech. 1998, Vol. 31, pp. 217-228.
Soulis J., Giannoglou G., Chatzizisis Y., Seralidou K., Parcharidis G., Louridas G., "Non-Newtonian models for molecular viscosity and wall shear stress in a 3D reconstructed human left coronary artery." Med. Eng. & Phys. 2008, Vol. 30, pp. 9-19.
Steinman D., Thomas J., Ladak H., Milner J., Rutt B., Spence D., "Reconstruction of Carotid Bifurcation Hemodynamics and Wall Thickness Using Computational Fluid Dynamics and MRI." Magn. Res. in Med. 2002, Vol. 47, pp. 149–159.
Tang D., Yang C., Kobayashi S., Ku D. N., “Generalized finite difference method for 3-D viscous flow in stenotic tubes with large wall deformation and collapse”, Ap. Num. Math., vol. 38, pp. 49-68, 2001.
Tang D., Yang C., Zheng J., Woodard P.K., Sicard G.A., Saffitz J.E., Yuan C., “3D MRI-Based Multicomponent FSI Models for Atherosclerotic Plaques”, Annals of Biomed. Eng., vol. 32, no. 7, pp. 947-960, 2004.
Taylor C., Hughes T., Zarins C., "Finite Element Modeling of Blood Flow in Arteries." Com. Meth. in Ap. Mech. and Eng. 1998, Vols. 158:1-2, pp. 155-196.
Torii R., Oshima M., Kobayashi T., Takagi K., Tezduyar T. E., “Fluid-Structure interaction modeling of a patient-specific cerebral aneurysm: influence of structural modeling”, Comput. Mech., vol. 43, pp. 151-159, 2008.