DOI: https://doi.org/10.20896/saci.v5i2.271
©2017 Som and Mishra. This is an Open Access article distributed under the terms of the Creative Commons Attribution License (http://creativecommons.org/licenses/by/2.0), which permits unrestricted use, distribution, and reproduction in any medium, provided the original work is properly c ited.
RESEARCH
OPEN ACCESS
An Inter-District Efficiency Measurement of RCH Program Using Data Envelopment
Analysis in Madhya Pradesh, India
Kalyan Sundar Som†* and Professor R. P. MishraῘ
Abstract
Reproductive Child Health (RCH) programme is one of the most important programmes for reproductive women and child health development in India and Madhya Pradesh, the Empowered Action Group (EAG) is one of them. Using Data Envelopment Analysis (DEA) method, this study calculates and analyses the technical efficiency of RCH programme in Madhya Pradesh. The main objective was to assess the degree of efficiency of RCH programme in the districts of Madhya Pradesh and to recommend performance targets for those districts, which come under inefficient technical inefficiency.
The findings show that 64.45 percent of the districts of the state are technically inefficient and scale inefficient, and used more resources that they actually did not need. The results broadly pointed out to grave inefficiency in the RCH at district level and that significant amounts of resources could be saved if measures were put to curb the wastage.
Keywords: RCH programme, DEA analysis, Efficiency, Madhya Pradesh, EAG states of India
†
Senior Research Fellow (UGC), Department of General & Applied Geography, Dr. Hari Singh Gour Central University, Sagar, Madhya Pradesh, Email: [email protected]
*
Corresponding Author
Ῐ
Introduction
Maternal and child health are the two most important parameters of sustainable development goal, which stimulates to uplift a society’s position. The study of Infant Mortality Rate (IMR) is important for implementation and evaluation of public health policies and programmes (Som and Mishra, 2016; Bhattacharyya, 2016). In India, only six out of 29 states have achieved the Millennium Development Goals (MDG) in context of IMR, and Madhya Pradesh is yet to achieve this target (Bhaumik, 2013). The IMR of Madhya Pradesh stands at 56 (SRS, 2013; also Bhattacharyya, 2016) which is comparable to Africa’s least developed country, Senegal, whose IMR stood at 55 in 2012 (CIA Factsheet, 2013). In the context of Maternal Mortality Rate (MMR) too, Madhya Pradesh is very high (Som and Mishra, 2016) — its MMR stands at 230 and can be compared to another sovereign state of Central Africa, Gabon, whose MMR was 230 in 2011-12.
Madhya Pradesh is a scarce resource region, especially when it comes to health service. Observations suggest that even this scarce resource is not used efficiently. This study aims to assess the degree of efficiency of Reproductive Child Health (RCH) programme in the districts of Madhya Pradesh. Using Data Envelopment Analysis (DEA) method, the study calculates and analyses the technical efficiency of RCH programme in the state. Based on the findings, it recommends performance targets for those districts, which come under inefficient technical inefficiency.
The study begins with a brief review of literature. This follows a discussion of the objectives and methodologies of the research, followed by results and discussion section.
Review of Literature
Over the years, the journal Lancet has dedicated to publishing a large number of studies on child and maternal health across countries (Byass, 2016; Manden and Smits, 2017; Kruk et al., 2016; Victora et al., 2011). However, as far as we are concerned, there is
very little research on efficiency measurements on programmes/schemes linked to maternal and child health. Notwithstanding, every organisation tries to work as efficiently as possible to reduce the allied cost. Private firms assess their performance by the financial figures, while in public organisations financial data do not play an important role while evaluating their performance. Health sector, various service centres and different areas have different input-output factors by which relative efficiency is measured by using a popular method, that is, DEA analysis.
As already stated above, amongst all the sectors of public health, maternal and child health (MCH) is one of the most vulnerable and deprived sectors (Akhtar and Izhar, 2010; Bhattacharyya, 2016; Lule, et al. 2005; Boopathy et al. 2014; Taneja, 2015; Mondal, 2003). From the adolescence to the end point of their reproductive years, women need sexual and reproductive health services whether they produced child(ren)or not. Women who give birth(s) need essential care to protect their health and ensure that their newborn(s) survive (Singh et al., 2014). During the last few decades in the developing countries, a significant decline in the maternal and infant deaths is a welcome sign that increased global attention and resources devoted to safe motherhood and child survival (Byass, 2016; Manden and Smits, 2017; Kruk et al., 2016; Singh et al., 2014; Victora et al., 2011). Yet, many remote areas especially from the developing countries suffer from a number of constraints—lack of access to clean drinking water, poor sanitation and hygiene,1 meagre immunisation and nutritional facilities; long-distance travel through poorly maintained pot-holed and rugged roads to access maternal and child health facilities, etc. (Bhattacharyya, 2014; 2016; Ghosh and Mistri, 2016; 2017; Sarma and Bhattacharyya, 2015).
1
The toilet scam under the Samagra Swachta Abhiyaan
further reinforces this. Under Samagra Swachta
Abhiyaan, the Raisen district of Madhya Pradesh
Government of India has launched a number of health programmes to uplift the health scenario and status of these segments of its population. Reproductive and child health (RCH) programme is one of the important health schemes of the country. Similarly, the state of Madhya Pradesh has also implemented the RCH programme during the year 1996-97 to provide quality health services in the health sector and achieve multiple objectives, particularly for the women and child. The principle focus of this programme is to reduce the infant mortality rate (IMR), maternal mortality ratio (MMR) and total fertility rate (TFR) along with universal access to public health services such as providing fresh drinking water, sanitation and hygiene, immunisation and nutritional services at household level, etc.
Madhya Pradesh has recorded high maternal mortality rate and highest infant mortality rate (NFHS-4, 2007-08; also, Bhattacharyya, 2016), which indicates lower reproductive and child health status, though infant mortality rate has reduced from 97 in 1996 to 54 in 2013 (Vital Statistics, Census of India, 2016). Similarly, maternal mortality ratio has also reduced from 498 in 1998 to 277 in 2013,2 however, the rate of decrease is insufficient which suggests that the impact of the programme is there, but the level of rate and its decrease requires an urgent check. In such a situation, the efficiency measure of the programme implementation needs proper efficiency throughout the state. This has been reinforced by a number of studies recommending the performance target for inefficient facilities (Ersoy et al., 1997; Kirigia et al., 2004; Parkin and Hollingsworth, 1997; Zavras et al., 2002). Indeed, this method was very popular in the 1990s. For instances, a Greek public insurance company which runs 133 primary health centres estimates its relative efficiency using DEA approach. Similarly, this method was being used by Ersoy et al. (1997), and Parkin and Hollingsworth (1997) to calculate the production efficiency of
2
Medium Term Health Sector Strategy Madhya Pradesh, retrieved from
http://www.health.mp.gov.in/archives/mths.pdf (accessed 10 October 2017)
hospitals in Turkey and Scotland respectively. In 1995, Thanassoulis et al., also used this method to explore output quality targets of prenatal care in England. Seemingly, this method has been used by nursing homes of Netherlands, psychiatric hospitals, defence hospitals and Florida based general hospitals (Kooreman, 1994; Ozcan and others, 1996; Ozcan and Bannick, 1994 and Huang, 1990). The following sections outline the objectives and methodologies.
Objectives and Methodology
The main objective of this study is to calculate and analyse the efficiency of RCH programme at district level in the state of Madhya Pradesh. This study examines whether these districts optimally utilise inputs for reproductive child health programme to provide good output for women and child(ren) or not. The study also analyses underutilisation and misuse of resources (if any), which are already scarce.
Madhya Pradesh is one of the EAG (Empowered Action Group) states of India.3 Reproductive and child health scenario has been problematic in the state (Som and Mishra, 2014). It is the second largest state of the country with an area of 0.3 million sq. km constituting 9.38% of the total geographical area of the country. It lies between 78˚08ʹE - 82˚49ʹE and 21˚17ʹ N - 26˚52ʹN (Figure 1). The state is bordered by Rajasthan and Gujarat in the west, Chhattisgarh and Jharkhand in the east, Uttar Pradesh in the north and Maharashtra in the south (Mishra, 1989). For administrative purpose, Madhya Pradesh is divided into 50 districts. The districts are further divided into sub-divisions and developmental blocks.
3
Figure 1: Location Map of Madhya Pradesh
The population of the state was 72.6 million (Census, 2011) with a decadal growth rate of 24.34 %. The population density is 236 persons per sq. km. The sample registration system reported that TFR in Madhya Pradesh was 3.1 children while the country’s average was 2.3 in 2011. In this state, IMR has slashed down by 35.9 percent in the last four decades from 156 per thousand in1981 to 56 per thousand in 2012; even then, it is still higher than that of the country’s average, which stands at 42 per thousand. Similarly, CBR (Crude Birth rate) has curved down from 39.1 in 1971 to 26.6 in 2012. This is an interesting fact that the CBR in Madhya Pradesh (26.6 in 2012) is higher than that of the average (21.6 in 2012) of the country (Data Book for Planning Commission, December 2014).
The economy of Madhya Pradesh is dominated by industrial and services activities, which contributes 63 percent of the GDP (Madhya Pradesh Budget analysis, 2016-17). However, about 60 percent of the population depends on agricultural sector for their livelihood. Most of the population resides in rural area (72.37%). Overall, the literacy rate of the state stands at 70.63 percent—while the male literacy rate is 80.5 percent, the female literacy rate is 60 percent. Very high rural-urban differential and
gender disparity prevail in literacy rate in Madhya Pradesh (Census 2011). High infant mortality rate and maternal mortality rate is seen in the study area which is an outcome of low level of female education. About 32 percent population of the state lives below the poverty line (World Bank, 2014), out of which 21.09 percent are schedule tribes. Before discussing on database and methodology, it is important to have a perception of scarcity of hospital beds in the state as per available data. That is, in 2013 each hospital bed had to serve 2669 patients against the recommended figure of 1000, thus demonstrating a vide gap between recommendations and actual availability (Report of Public Health and Family Welfare Department of Madhya Pradesh 2011).
efficiency are known as overall efficiency measure (Coelli, 1996).
Technical efficiency can be measured in two ways—input oriented and output oriented. Input oriented method means input minimisation for same output while output oriented method deals that output maximisation with same input bundles (Daraio and Simar, 2007). The degree of technical efficiency is measured in terms of how much unnecessary resources have been used in an area. The number of activities being conducted in a district may be sometimes too large and therefore, may experience inefficiency in the scale. Besides, a health centre may be too small for its level of operation, and thus experience efficiencies of scale. Inefficiency due to congestion (scale inefficiency) refers to too many inputs leading to decreased output (Akazili et al., 2008) which is perhaps the case for Madhya Pradesh too (see, Singh et al., 2013).
Traditional methodology for measuring efficiency in health sector is normally known as the production frontier approach. The functions that estimate to determine efficiency are known as stochastic frontier approach (SFA). The present study has used the Data Envelopment analysis (DEA) – a leading methodology used to measure technical efficiency in various sectors. This method involves construction of a best-practice frontier based on the output produced per unit of input by the best performers (Dutta et al., 2014). It enables efficiency comparisons without any prior specification of the production function (Saha and Debnath, 2015).
DEA accommodates multiple inputs and multiple outputs in a single measure of efficiency when compared to SFA and has become the dominant approach to measure the efficiency in health care and in many other
sectors of the economy (Giuffrida and other, 2001). The districts are taken as the decision making unit (DMU) as the implementing agencies work under the guidance of the district.
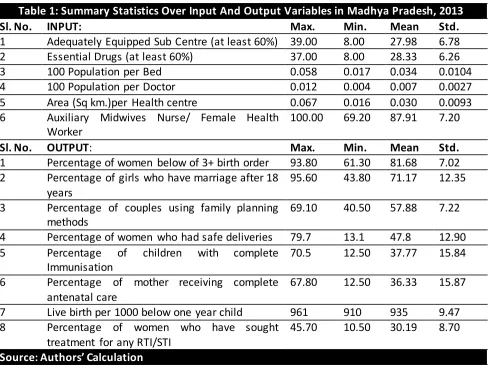
The output related to the objective of the RCH programme provides better health and wellbeing for women and children will fulfil the sustainable development goals. If the percentages of women below the3rdorder birth is higher and the percentage of girls who are married after the age of 18 years then chances of pregnancy complications may be lower. Couples using family planning methods help in reduction of unwanted fertility and consequently chance of reproductive transmission infection (RTI) may be reduced. Those women having awareness about RTI/STI have minimum chance of occurrence of these diseases. Percentage of children with complete immunisation and percentage of mother receiving complete antenatal care are safe from various diseases. Percent of women who have safe deliveries and the outcome of this, live birth below one-year- child is also a good indication of reproductive and child health status. These eight suitable outputs give better representation of reproductive and child health status. The input used in the study are-adequately equipped sub-centre, essential drugs, population-bed ratio, population-doctor ratio, health centre per sq. km. and auxiliary midwives nurse/ female health worker.
In the study, the analysis is based on 45 districts of Madhya Pradesh. Each district has six inputs and eight outputs. Here, the 45 districts are indexed by i=1 to 45, six inputs by j=1 to 6 and eight outputs by k=1 to 8. The relative efficiency score of a test DMUp or the benchmark is obtained by solving the following model proposed and used by Charnes et al. (2013):
𝑀𝑎𝑥 ∑8𝑘=1𝑉𝐾𝑌𝑘𝑝
∑6𝑗=1𝑈𝑗𝑋𝑗𝑝 subjected to
𝑀𝑎𝑥 ∑8𝑘=1𝑉𝐾𝑌𝑘𝑖 ∑6𝑗=1𝑈𝑗𝑋𝑗𝑖 ≤ V-i
𝑉𝑘 𝑈𝑗 ≥ 0 𝑣 − 𝑘, j
Thus, Xjiis the jth input of the ith DMU, yki is the
kth output of the ithDMU and Vk is the weight of
kth output and uj is the weight of jth input. Since,
fraction so the above formula is transformed by setting up the denominator of the objective function equal to 1. This allows the linear
programming to maximise the numerator. So, the transformed linear program is:
𝑀𝑎𝑥 ∑8𝑘 =1𝑉𝐾 𝑌𝑘𝑝 subjected to ∑𝑗=16 𝑈𝑗𝑋𝑗𝑝=1, 𝑀𝑎𝑥 ∑𝑘 =18 𝑉𝐾𝑌𝑘𝑖-∑6𝑗=1𝑈𝑗𝑋𝑗𝑖 ≤ 0 v-I𝑉𝐾,
𝑈𝑗≥ 0 𝑣 − 𝑘, 𝑗
Constant Returns to Scale (CRS) Model
The constant returns to scale model assumes a production process in which the optimal mix of inputs and outputs are independent of the scale of operation. The CRS model measures overall technical efficiency for each of the sample health centre.
Variable Returns to Scale (VRS) Model
The VRS model, though similar to the CRS model, measures pure technical efficiency, and returns to scale for each of the sample health centres. Scale efficiency can be measured by dividing the CRS efficiency score by the VRS efficiency score.
Table 1: Summary Statistics Over Input And Output Variables in Madhya Pradesh, 2013
Sl. No. INPUT: Max. Min. Mean Std.
1 Adequately Equipped Sub Centre (at least 60%) 39.00 8.00 27.98 6.78 2 Essential Drugs (at least 60%) 37.00 8.00 28.33 6.26
3 100 Population per Bed 0.058 0.017 0.034 0.0104
4 100 Population per Doctor 0.012 0.004 0.007 0.0027
5 Area (Sq km.)per Health centre 0.067 0.016 0.030 0.0093 6 Auxiliary Midwives Nurse/ Female Health
Worker
100.00 69.20 87.91 7.20
Sl. No. OUTPUT: Max. Min. Mean Std.
1 Percentage of women below of 3+ birth order 93.80 61.30 81.68 7.02 2 Percentage of girls who have marriage after 18
years
95.60 43.80 71.17 12.35
3 Percentage of couples using family planning methods
69.10 40.50 57.88 7.22
4 Percentage of women who had safe deliveries 79.7 13.1 47.8 12.90 5 Percentage of children with complete
Immunisation
70.5 12.50 37.77 15.84
6 Percentage of mother receiving complete antenatal care
67.80 12.50 36.33 15.87
7 Live birth per 1000 below one year child 961 910 935 9.47 8 Percentage of women who have sought
treatment for any RTI/STI
45.70 10.50 30.19 8.70
Source: Authors’ Calculation Results and Discussion
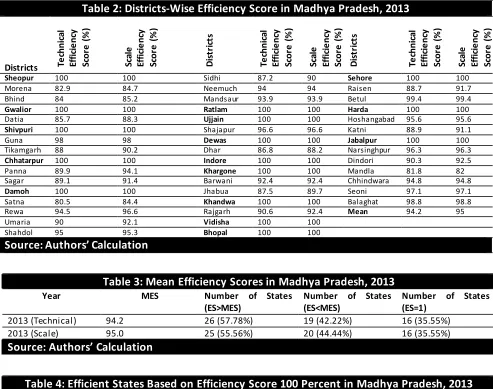
Technical and scale efficiency score for the each district is given in Table 2, these efficiency scores range from 0 (totally inefficient) to 100 percent (totally efficient). Out of the 45 districts, only 16 (35.55%) are found to be relatively efficient with a score of 100 percent (Table 3), whereas 29 (64.45%) districts are technically inefficient. The average efficiency of all the districts stand at 94.2 percent, suggesting that on an average, the districts
could produce at least 5.8% more output with same amount of input, so that they may become as the best-practice frontier districts. The highest slack in input utilisation is observed for 100 populations per bed and 100 populations per doctor.
of technically efficient districts in the year 2013 (Table 4), but three districts Satna (TE-85%), Mandla (TE-81.8%), and Morena (TE-82.9%) are the least efficient districts of the state (Table 1).
25 districts were scale efficient while in 20 districts scale efficiency is greater than the
state mean scale efficiency (SE-95 percent) (Table 3).Out of the inefficient districts 3 had a scale efficiency score of less than 85 percent and 4 had in between 85 to 90 percent (Table 2).
Table 3: Mean Efficiency Scores in Madhya Pradesh, 2013
Year MES Number of States (ES>MES)
Number of States (ES<MES)
Number of States (ES=1)
2013 (Technical) 94.2 26 (57.78%) 19 (42.22%) 16 (35.55%) 2013 (Scale) 95.0 25 (55.56%) 20 (44.44%) 16 (35.55%)
Source: Authors’ Calculation
Table 4: Efficient States Based on Efficiency Score 100 Percent in Madhya Pradesh, 2013
Year Efficient States (ES-1)
2013 (Technical) Sheopur, Gwalior, Shivpuri, Chhatarpur, Damoh, Ratlam, Ujjain, Dewas, Indore, Khargone, Khandwa, Vidisha, Bhopal, Sehore, Harda, and Jabalpur.
2013 (Scale) Sheopur, Gwalior, Shivpuri, Chhatarpur, Damoh, Ratlam, Ujjain, Dewas, Indore, Khargone, Khandwa, Vidisha, Bhopal, Sehore, Harda, and Jabalpur.
Source: Authors' Calculation Spatial Analysis
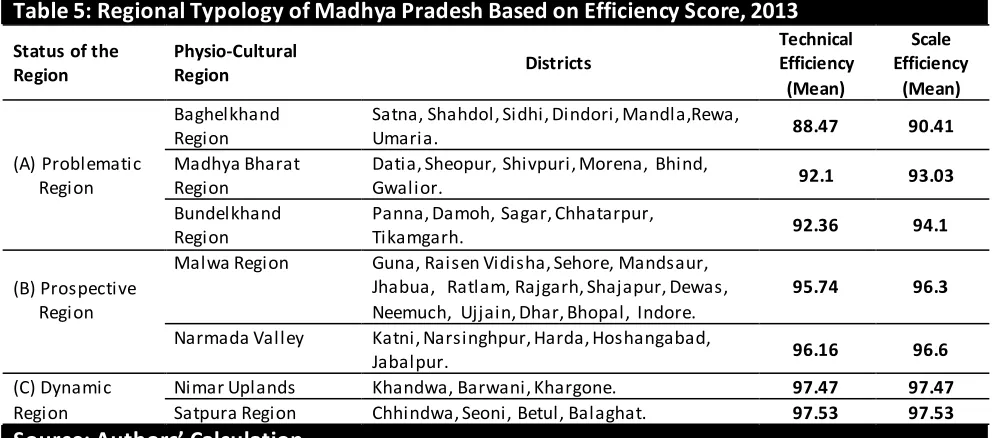
The average technical efficiency score were calculated for the seven physio-cultural regions of the state — (i) Baghelkhand plateau, (ii) Madhya Bharat region, (iii) Bundelkhand region, (iv) Malwa region, (v) Narmada valley, (vi) Nimar Uplands and (vii) Satpura region. The districts of Madhya Pradesh grouped into these seven regions of the state are — (i) Baghelkhand plateau comprises even districts
of north-eastern part of the state, and they are Satna, Shahdol, Sidhi, Dindori, Mandla, Rewa and Umaria; (ii)Madhya Bharat plateau includes six northern districts of the state — Datia, Sheopur, Shivpuri, Morena, Bhind and Gwalior; (iii) Bundelkhand upland comprises five districts, and they are — Panna, Damoh, Sagar, Chhatarpur, Tikamgarh; (iv) Malwa plateau comprises fifteen districts of western part of the state which are — Guna, Raisen, Vidisha, Sehore, Mandsaur, Jhabua, Ratlam, Rajgarh,
Table 2: Districts-Wise Efficiency Score in Madhya Pradesh, 2013
Districts Te
chni ca l Ef fi ci e nc y Sc or e ( % ) Sc al e Ef fi ci e nc y Sc or e ( % ) D is tr ic ts Te chni ca l Ef fi ci e nc y Sc or e ( % ) Sc al e Ef fi ci e nc y Sc or e ( % ) D is tr ic ts Te chni ca l Ef fi ci e nc y Sc or e ( % ) Sc al e Ef fi ci e nc y Sc or e ( % )
Sheopur 100 100 Sidhi 87.2 90 Sehore 100 100
Morena 82.9 84.7 Neemuch 94 94 Raisen 88.7 91.7
Bhind 84 85.2 Mandsaur 93.9 93.9 Betul 99.4 99.4
Gwalior 100 100 Ratlam 100 100 Harda 100 100
Datia 85.7 88.3 Ujjain 100 100 Hoshangabad 95.6 95.6
Shivpuri 100 100 Shajapur 96.6 96.6 Katni 88.9 91.1
Guna 98 98 Dewas 100 100 Jabalpur 100 100
Tikamgarh 88 90.2 Dhar 86.8 88.2 Narsinghpur 96.3 96.3
Chhatarpur 100 100 Indore 100 100 Dindori 90.3 92.5
Panna 89.9 94.1 Khargone 100 100 Mandla 81.8 82
Sagar 89.1 91.4 Barwani 92.4 92.4 Chhindwara 94.8 94.8
Damoh 100 100 Jhabua 87.5 89.7 Seoni 97.1 97.1
Satna 80.5 84.4 Khandwa 100 100 Balaghat 98.8 98.8
Rewa 94.5 96.6 Rajgarh 90.6 92.4 Mean 94.2 95
Umaria 90 92.1 Vidisha 100 100
Shahdol 95 95.3 Bhopal 100 100
Shajapur, Dewas, Neemuch, Ujjain, Dhar, Bhopal and Indore. (v) Narmada valley embraces five districts of the central part, and they are — Katni, Narsinghpur, Harda, Hoshangabad and Jabalpur; (vi) Nimar Uplands includes Khandwa, Barwani, Khargone; (vii) Satpura highlands incorporates Chhindwa, Seoni, Betul, and Balaghat district (Figure 2).
On the basis of the level of efficiency, the regions of the state are classified into three major regions; they are problematic regions (Baghelkhand, Madhya Bharat, Bundelkhand), prospective regions (Malwa and Narmada valley) and dynamic regions (Nimar region and Satpura). Spatially, technical efficiency score of RCH programme is highest in Satpura region followed by Nimar uplands, Narmada valley, Malwa plateau, Bundelkhand upland and
Madhya Bharat plateau, while it is the lowest in the Baghelkhand plateau, the eastern part of Madhya Pradesh (Table 5).
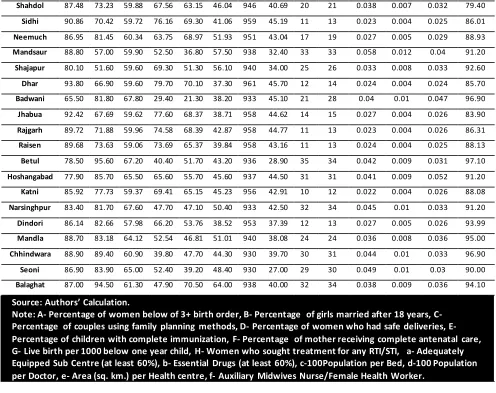
Table 6 presents an analysis of 14 indicators (8 outputs and 6 inputs) in 45 districts, which provide the magnitude through which specific inputs per inefficient health centre could be reduced. On the basis of this information, policy makers may improve the efficiency of primary delivery by transferring auxiliary nurse midwife and doctor that will enhance the capacity of RCH programme. The bed and essential drugs may be transferred to areas of more efficient facilities to reduce cost burden and to enhance the efficiency. Table 7 presents a summary of total input saving of Madhya Pradesh, if the inefficient districts were to operate efficiently.
Table 5: Regional Typology of Madhya Pradesh Based on Efficiency Score, 2013
Status of the Region
Physio-Cultural
Region Districts
Technical Efficiency (Mean)
Scale Efficiency
(Mean)
(A) Problematic Region
Baghelkhand Region
Satna, Shahdol, Sidhi, Dindori, Mandla,Rewa,
Umaria. 88.47 90.41
Madhya Bharat Region
Datia, Sheopur, Shivpuri, Morena, Bhind,
Gwalior. 92.1 93.03
Bundelkhand Region
Panna, Damoh, Sagar, Chhatarpur,
Tikamgarh. 92.36 94.1
(B) Prospective Region
Malwa Region Guna, Raisen Vidisha, Sehore, Mandsaur, Jhabua, Ratlam, Rajgarh, Shajapur, Dewas, Neemuch, Ujjain, Dhar, Bhopal, Indore.
95.74 96.3
Narmada Valley Katni, Narsinghpur, Harda, Hoshangabad,
Jabalpur. 96.16 96.6
(C) Dynamic Region
Nimar Uplands Khandwa, Barwani, Khargone. 97.47 97.47
Satpura Region Chhindwa, Seoni, Betul, Balaghat. 97.53 97.53
Source: Authors’ Calculation
Table 6: Inputs Reduction and/or Output Increases Needed to Make Individual Inefficient Districts Efficient, Madhya Pradesh
Districts A B C D E F G H a b c d e f
Morena 93.80 66.90 59.60 79.70 70.10 37.30 961 45.70 12 14 0.024 0.004 0.024 85.70
Bhind 92.75 68.15 59.64 78.44 69.82 38.64 960 45.52 12 14 0.024 0.004 0.024 85.81
Datia 88.63 74.69 62.95 70.03 59.16 49.59 955 41.32 13 14 0.024 0.004 0.031 89.13
Guna 91.80 69.30 51.30 50.40 25.90 16.60 923 18.00 32 33 0.051 0.01 0.022 90.90
Tikamgarh 92.48 69.41 61.51 76.08 64.11 42.34 958 43.41 13 15 0.025 0.004 0.028 87.54
Panna 89.02 70.06 55.69 69.41 55.28 30.19 953 37.21 15 16 0.028 0.005 0.023 88.13
Sagar 82.30 82.72 59.26 64.67 62.86 48.88 953 41.62 10 11 0.022 0.004 0.027 89.18
Satna 86.64 75.46 59.89 71.10 68.16 46.44 957 44.46 10 12 0.021 0.004 0.026 86.44
Rewa 84.65 77.84 59.97 68.70 67.62 48.98 956 44.11 10 11 0.021 0.004 0.027 86.65
Shahdol 87.48 73.23 59.88 67.56 63.15 46.04 946 40.69 20 21 0.038 0.007 0.032 79.40
Sidhi 90.86 70.42 59.72 76.16 69.30 41.06 959 45.19 11 13 0.023 0.004 0.025 86.01
Neemuch 86.95 81.45 60.34 63.75 68.97 51.93 951 43.04 17 19 0.027 0.005 0.029 88.93
Mandsaur 88.80 57.00 59.90 52.50 36.80 57.50 938 32.40 33 33 0.058 0.012 0.04 91.20
Shajapur 80.10 51.60 59.60 69.30 51.30 56.10 940 34.00 25 26 0.033 0.008 0.033 92.60
Dhar 93.80 66.90 59.60 79.70 70.10 37.30 961 45.70 12 14 0.024 0.004 0.024 85.70
Badwani 65.50 81.80 67.80 29.40 21.30 38.20 933 45.10 21 28 0.04 0.01 0.047 96.90
Jhabua 92.42 67.69 59.62 77.60 68.37 38.71 958 44.62 14 15 0.027 0.004 0.026 83.90
Rajgarh 89.72 71.88 59.96 74.58 68.39 42.87 958 44.77 11 13 0.023 0.004 0.026 86.31
Raisen 89.68 73.63 59.06 73.69 65.37 39.84 958 43.16 11 13 0.024 0.004 0.025 88.13
Betul 78.50 95.60 67.20 40.40 51.70 43.20 936 28.90 35 34 0.042 0.009 0.031 97.10
Hoshangabad 77.90 85.70 65.50 65.60 55.70 45.60 937 44.50 31 31 0.041 0.009 0.052 91.20
Katni 85.92 77.73 59.37 69.41 65.15 45.23 956 42.91 10 12 0.022 0.004 0.026 88.08
Narsinghpur 83.40 81.70 67.60 47.70 47.10 50.40 933 42.50 32 34 0.045 0.01 0.033 91.20
Dindori 86.14 82.66 57.98 66.20 53.76 38.52 953 37.39 12 13 0.027 0.005 0.026 93.99
Mandla 88.70 83.18 64.12 52.54 46.81 51.01 940 38.08 24 24 0.036 0.008 0.036 95.00
Chhindwara 88.90 89.40 60.90 39.80 47.70 44.30 930 39.70 30 31 0.044 0.01 0.033 96.90
Seoni 86.90 83.90 65.00 52.40 39.20 48.40 930 27.00 29 30 0.049 0.01 0.03 90.00
Balaghat 87.00 94.50 61.30 47.90 70.50 64.00 938 40.00 32 34 0.038 0.009 0.036 94.10
Source: Authors’ Calculation.
Note: A- Percentage of women below of 3+ birth order, B- Percentage of girls married after 18 years, C- Percentage of couples using family planning methods, D- Percentage of women who had safe deliveries, E- Percentage of children with complete immunization, F- Percentage of mother receiving complete antenatal care, G- Live birth per 1000 below one year child, H- Women who sought treatment for any RTI/STI, a- Adequately Equipped Sub Centre (at least 60%), b- Essential Drugs (at least 60%), c-100Population per Bed, d-100 Population per Doctor, e- Area (sq. km.) per Health centre, f- Auxiliary Midwives Nurse/Female Health Worker.
Table 7: Total Input Savings From Inefficient District
Type of Input Actual Inputs Use Inputs that owe to be used Input Savings
Adequately Equipped Sub Centre (at least 60%) 904 549 355
Essential Drugs (at least 60%) 906 589 317
100 Population per Bed 0.04033 0.03183 0.0085
100 Population per Doctor 0.00931 0.00631 0.003
1 Sq. km. Area per Health center 0.03795 0.02990 0.00805
ANM/FHW 92.60 89.39 3
Source: Authors’ Calculation
The present study also highlights that the prevalent scale inefficiency recorded increasing returns to scale. In the case of increasing returns to scale, expansion of output reduces per unit cost. Because increasing the level of output requires an increase in the demand for RCH care, which is beyond the control of the programme management, a merger of two centres in close geographic proximity can be an option. However, this option may create a problem when we consider the indicators of the low density of population in nearby areas; consequently, the residents may pay an addition cost burden for travel expenditure and
health care services in Birbhum district of West Bengal. From the findings of our research, it can be interpreted that health centres could play better role if their efficiency level is known. Thus, the results from this study might provide
bases for government policies and other relevant stakeholders, who would be able to set targets to reduce the inefficiency of the districts.
Figure 2: Distribution of Technical and Scale Efficiency Scores in Madhya Pradesh Conclusion
This study set out to highlight the role of DEA in order to identify the least and the most RCH programme efficient districts of Madhya Pradesh, one of the EAG states of India. The results are murky demonstrating that 64.45 percent of the districts of the state are technically inefficient and scale inefficient. Despite these districts being resource scarce, they used more resources, which were actually not needed. Thus, the findings pointed out to serious inefficiency in the RCH at district level signalling that significant amounts of resources could be saved if measures are introduced to reduce wastage. This study is one of the first of its kind, which can be replicated to examine other health programmes not only within the
state of Madhya Pradesh and other EAG states but also across the states of India.
References
Akazili, J., Adjuik, M., Jehu-Appiah, C., & Zere, E. (2008).Using data envelopment analysis to measure the extent of technical efficiency of public health centres in Ghana. BMC
international health and human rights, 8(1), 11.
Akhtar, R., & Izhar, N. (2010). Global medical geography.Rawat Publication, Jaipur (ISBN-81-316-0198-6).
Annual Health Survey- 2011–12. Ministry of Home Affairs, Government of India. New Delhi. Available:
Bhattacharyya, R. (2016). An Account of India’s under-5 Mortality Rate, International Journal of
Social Work and Human Services Practice, 4(4),
82-88, DOI: 10.13189/ijrh.2016.040402
Bhattacharyya, R. (2014). Good Governance and Development Mandate, Space and Culture,
India, 2(1), 1-4. doi:10.20896/saci.v2i1.65
Bhaumik, S. (2013). Child mortality: will India achieve the 2015 target?. BMJ: British Medical
Journal (Online), 346.
Boopathy, G. M., Maitra, S., Bhaskar, S., Pratap, R., & Shanti, R. (2014). Millennium
Development Goals India Country Report 2014.Social Statistics Division Ministry of Statistics and Program Implementation,
Government of India.
Byass, Peter (2016). Child mortality is (estimated to be) falling, The Lancet, http://dx.doi.org/10.1016/ S0140-6736(16)32169-9
Census of India (2011). Provisional population totals paper 1 of 2011 of supplement district Levels, New Delhi, India: Office of the Registrar
General & Census Commissioner.
Coelli, T. (1996). A guide to DEAP version 2.1: a data envelopment analysis (computer)
program. Centre for Efficiency and Productivity
Analysis, University of New England, Australia.
Charnes, A., Cooper, W. W., Lewin, A. Y., & Seiford, L. M. (Eds.). (2013). Data envelopment analysis: Theory, methodology, and
applications. Springer Science & Business
Media.
Daraio, C., & Simar, L. (2007). Advanced robust and nonparametric methods in efficiency
analysis: Methodology and applications.
Springer Science & Business Media.
Das, S.R. (2015, 08 June). Toilet Scam in
Madhya Pradesh District, ₹ 1 Crore Embezzled, Say Sources, NDTV, retrieved from,
https://www.ndtv.com/india-news/toilet-scam-
in-madhya-pradesh-district-rs-1-crore-embezzled-say-sources-769773
Dutta, A., Bandyopadhyay, S., & Ghose, A. (2014).Measurement and determinants of
public hospital efficiency in West Bengal, India.
Journal of Asian Public Policy, 7(3), 231-244.
Ersoy, K., Kavuncubasi, S., Ozcan, Y. A., & Harris II, J. M. (1997). Technical efficiencies of Turkish hospitals: DEA approach. Journal of Medical
Systems, 21(2), 67-74.
Eyob, Z. A. (2000). Hospital efficiency in Sub-Africa: Evidence from South Africa. Working Paper No. 187, The United Nations University World Institute for Development Economics
Research, 1-39.
Ghosh, A. &Mistri, D. (2017). Obstacles in the Utilisation of Maternal Health Care Services in Murarai-II C.D. Block, Birbhum District, West Bengal, India, Space And Culture, India, 4(3), 40-61. DOI:10.20896/saci.v4i3.224
Ghosh, A. & Mistri, B. (2016).Impact of Distance in the Provision of Maternal Health Care Services and its Accountability in Murarai-II Block, Birbhum District. Space and Culture,
India, 4(1), 81-99, DOI:
10.20896/saci.v4i1.182
Giuffrida, A., & Gravelle, H. (2001).Measuring performance in primary care: econometric analysis and DEA. Applied Economics, 33(2), 163-175.
Gulati, S. C., & Patnaik, R. (1996). Women's
status and reproductive health rights.
Har-Anand Publications.
Gulati, S. C., & Sharma, S. (2001). Reproductive and child health status in India: District level
analysis. Institute of Economic Growth,
University of Delhi Enclave, North Campus.
Hollingsworth, B., &Parkin, D. (1995).The efficiency of Scottish acute hospitals: an application of data envelopment analysis. Mathematical Medicine and Biology: A Journal
of the IMA, 12(3-4), 161-173.
Huang, Y. G. L. (1990). An application of data envelopment analysis: measuring the relative performance of Florida general hospitals.
Journal of medical systems, 14(4), 191-196.
facility survey (DLHS 3) 2007-08: India. Madhya Pradesh 2010, Mumbai.
International Institute of Population Sciences and ORC Macro (2014-15). National Family Health Survey-4: State Fact Sheet. Available from:
http://www.rchiips.org/nfhs/factsheet_NFHS-4.shtml .
Kirigia, J. M., Sambo, L. G., & Scheel, H. (2001).Technical efficiency of public clinics in Kwazulu-Natal province of South Africa. East
African Medical Journal, 78(3), 1-14.
Kirigia, J. M., Emrouznejad, A., & Sambo, L. G. (2002).Measurement of technical efficiency of public hospitals in Kenya: using data
envelopment analysis. Journal of medical
systems, 26(1), 39-45.
Kooreman, P. (1994). Nursing home care in The Netherlands: a nonparametric efficiency analysis. Journal of health economics, 13(3), 301-316.
Kruk, Margaret E, Leslie, Hannah H, Verguet, Stéphane, Mbaruku, Godfrey M, Adanu, Richard M K and Langer, Ana (2016).Quality of basic maternal care functions in health Facilities of five African countries: an analysis of national health system surveys, The Lancet Global
Health,
http://dx.doi.org/10.1016/S2214-109X(16)30180-2
Lule, E., Ramana, G. N. V., Ooman, N., Epp, J., Huntington, D., & Rosen, J. E. (2005). Achieving the millennium development goal of improving maternal health: determinants, interventions and challenges.
Mishra, R. P. (1989). Population and Food
Supply in Madhya Pradesh. Northern Book
Centre.
Mondal, S. K. (2003). Health Nutrition and
Morbidity: A Study of Maternal Behaviour.
Development Evaluation Society of India (DESI). Bookwell Publication, New Delhi.
Monden, Christiaan W S and Smits, Jeroen (2017). Mortality among twins and singletons in sub-Saharan Africa between 1995 and 2014: a pooled analysis of data from 90 Demographic and Health Surveys in 30 countries, Lancet
Global Health, http://dx.doi.org/10.1016/
S2214-109X(17)30197-3
Ozcan, Y. A., &Bannick, R. R. (1994).Trends in Department of Defense hospital efficiency.
Journal of Medical Systems, 18(2), 69-83.
Ozcan, Y. A., McCue, M. J., & Okasha, A. A. (1996).Measuring the technical efficiency of psychiatric hospitals. Journal of Medical
Systems, 20(3), 141-150.
Parkin, D., & Hollingsworth, B.
(1997).Measuring production efficiency of acute hospitals in Scotland, 1991-94: validity issues in data envelopment analysis. Applied
Economics, 29(11), 1425-1433.
PRS Legislative Research (2016). Madhya
Pradesh Budget Analysis. Retrieved from
http://www.prsindia.org/parliamenttrack/state -budgets/madhya-pradesh-budget-analysis-2016-17-4187/.
Registrar General of India. Sample registration system (SRS) statistical report 2013. New Delhi: 2013.
Sarma, J.B. & Bhattacharyya, R. (2015). Half empty or half filled? notes on universal health coverage in northeast India, The Clarion, 4(1), 154-184.
Saha, P., &Debnath, S. (2015). Implementation efficiency of MGNREGA: A study of Indian states using data envelopment analysis. Indian
Journal of Economics and Development, 11(3),
631-636.
Singh, S., Darroch, J. E., & Ashford, L. S. (2014). Adding it up: The costs and benefits of investing in sexual and reproductive health 2014.
Som, K. S.,& Mishra, R. P. (2014). BIMARU States: Need a Rethinking. IOSR Journal of
Humanities and Social Science, 19(7), 34-41.
https://doi.org/10.9790%2F0837-19713441.
Som, K. S., & Mishra, R. P. (2016).Fertility and RCH-Status in Madhya Pradesh: A District Level Analysis. Transactions, 38(2), 281-290.
Som, K. S., & Mishra, R. P. (2016).Trend, Pattern and Determinants of Infant Mortality in
Madhya Pradesh: A District Level Analysis.
Singh, P. K., Kumar, C., Rai, R. K., & Singh, L. (2013). Factors associated with maternal
healthcare services utilization in nine high focus states in India: a multilevel analysis based on 14 385 communities in 292 districts. Health policy
and planning, 29(5), 542-559.
Taneja, D. D. (2015). Health policies and
programmes in India. Doctors Publications.
The World Factbook 2013. Washington, DC:
Central Intelligence Agency, 2013.
(https://www.cia.gov/library/publications/the-world-factbook/index.html)
Victora, Cesar G., Aquino, Estela M L, Carmo Leal, Maria do, Monteiro, Carlos Augusto, Barros, Fernando C and Szwarcwald, Celia L. (2011). Health in Brazil 2-Maternal and child health in Brazil: progress and challenges, The
Lancet, DOI: 10.1016/S0140-6736(11)60138-4
World Bank.2014. Madhya Pradesh poverty,
growth, and inequality. India state briefs.
Washington, D.C.: World Bank Group.
http://documents.worldbank.org/curated/en/4
54421467996665040/Madhya-Pradesh-poverty-growth-and-inequality.
Zavras, A. I., Tsakos, G., Economou, C.,
&Kyriopoulos, J. (2002). Using DEA to evaluate efficiency and formulate policy within a Greek national primary health care network. Journal
of Medical Systems, 26(4), 285-292.
Acknowledgements
Authors are highly indebted to the editor and two anonymous reviewers for their useful comments and suggestions facilitating improvements in the paper.
About the Authors
Prof R. P. Mishra presently holds the post of Director of Population Research Centre – Madhya Pradesh and Chhattisgarh region (MOFH) and Dean School of Applied Science in Dr. Harisingh Gour Central University, Sagar. His research interest covers population problem, food security, and developmental issues.