Risk factor mapping and case map of environmentally based disease in Yogyakarta
Hariza Adnani,1 Achmad Arman Subiyanto,2 Diffah Hanim,3 Endang Sutisna Sulaeman4
Community Research
ABSTRACT
BACKGROUND A geographic information system (GIS) is required to guide interventions into prevent acute respiratory infection (ARI) and reduce the incidence of cases. The purpose of this study is to find out whether there is spatial autocorrelation in the spread of ARI; to obtain spatial information about the ARI risk factors, the ARI case map, and the factors related to the occurrence of ARI.
METHODS This study is a quantitative research study with case-control study design. The sampling technique was purposive sampling. Spatial analysis techniques used were buffers and spatial clustering. The measurement of spatial autocorrelation was calculated by Moran’s Index method.
RESULTS The risk factors for ARI based on the history of ARI disease were cough and cold in the last one year, and cough and cold lasting more than two weeks (OR = 15.691; 95% CI = 6.558–37.546 and OR = 6.645; 95% CI = 3.013–14.652). The risk factors for ARI based on the house physical environment were the room density, existence of glass windows on the house roof, electricity as a light source, presence of family members who smoke, and proximity to pollution exposure and waste disposal. Moran's Index value shows positive spatial autocorrelation.
CONCLUSIONS GIS produces ARI distribution patterns. Based on the results of the cluster, the incidence of ARI cases in this region are interrelated or one case with another case is closely related, due to its close position.
KEYWORDS case study, geographic information system, health risk assessment, infectious diseases, map
pISSN: 0853-1773 • eISSN: 2252-8083 https://doi.org/10.13181/mji.v28i2.3093 Med J Indones. 2019;28:174–82 Received: August 15, 2018 Accepted: January 28, 2019 Authors' affiliations:
1Graduate Program in Health Promotion
and Community Empowerment, Universitas Sebelas Maret, Surakarta, Indonesia, 2Masters Program in Family
Medicine, Universitas Sebelas Maret, Surakarta, Indonesia, 3Master Program
in Nutrition, Universitas Sebelas Maret,
Surakarta, Indonesia, 4Master Program in
Public Health, Universitas Sebelas Maret, Surakarta, Indonesia
Corresponding author:
Hariza Adnani
Graduate Program in Health Promotion and Community Empowerment, Universitas Sebelas Maret, Jalan Ir. Sutami Nomor 36 A, Kentingan, Surakarta 57126, Central Java, Indonesia Tel/Fax: +62-271-632450
E-mail: [email protected]
Copyright @ 2019 Authors. This is an open access article distributed under the terms of the Creative Commons Attribution-NonCommercial 4.0 International License (http:// creativecommons.org/licenses/by-nc/4.0/), which permits unrestricted non-commercial use, distribution, and reproduction in any medium, provided the original author and source are properly cited.
Acute respiratory infections (ARIs) are classified as upper respiratory tract infections (URIs) or lower respiratory tract infections. The upper respiratory tract consists of the airways from the nostrils to the vocal cords in the larynx, including the paranasal sinuses and the middle ear. The lower respiratory tract covers the continuation of the airways from the trachea and bronchi to the bronchioles and the
alveoli. ARIs are not confined to the respiratory tract and have systemic effects because of the possible extension of infection or microbial toxins, inflammation, and reduced lung function. Diphtheria, pertussis (whooping cough), and measles are vaccine-preventable diseases that may have a respiratory tract component but also affect other
ARI is one of the environmental based diseases often founded in developing countries (their mortality rate in toddlers is over 40 of 1,000 live births). Its incidence is 15–20% per year in toddlers. According to World Health Organization, approximately 13 million toddlers in the world die every year, and ARI is one of the major causes of death by killing 4 million toddlers annually. Indonesia is still burdened with environmentally based communicable diseases, such as dengue hemorrhagic fever, pulmonary tuberculosis (TB), malaria, diarrhea, ARIs, HIV/AIDS, filariasis, worms, skin diseases, poisoning, and health issues because of poor working
environments. Based on Riset Kesehatan Dasar
(RISKESDAS) in 2013, the number of pneumonia ARI cases tended to increase for the period when the prevalence of pneumonia of all ages rise from 2.1% in 2007 to 2.7% in 2013. The prevalence of pulmonary TB remains in the same position for both 2007 and 2013 at 0.4%. There was an increase in the prevalence of hepatitis in all age groups from 0.6% in 2007 to 1.2% in 2013. In contrast, there was a decrease in the period prevalence rate of diarrhea from 9.0% in 2007
to 3.5% in 2013.2
In Indonesia, Riskesdas in 2013 showed that the period prevalence of ARI based on the diagnosis of health personnel and community complaints was 25%. The incidence and the prevalence of ARI in Indonesia in 2013 were 1.8% and 4.5%, respectively. ARI risk factors can be divided into two groups: internal and external factors. Internal factors are conditions within the patient (toddler), which makes the individual easier to be exposed to ARI disease agents that include sex, birth weight, breastfeeding status, and immunization status. External factors are conditions that are outside the patient (toddler) in the form of physical, biological, social, and economic environment that make them easier to be exposed to disease agents, including: cigarette smoke pollution, kitchen smoke pollution, density of residence, geographical condition, ventilation of 10% of the floor area, and lighting.3
ARI disease in the working area of Puskesmas Imogiri I was one of the top 10 diseases but was not the most important in both 2016 and 2017. Based on the data of the top 10 diseases at Puskesmas Imogiri I, the most common disease in January–December 2016, was fever of unknown origin (2,400 people or 17.03%), and the most common disease in the community in
January–May 2017, was dyspepsia (807 people or 16.60%).
Prevention efforts can also be implemented by knowing the spatial distribution of the patients. Almost all Puskesmas in Bantul Regency process the data of ARI case distribution and ARI risk factors manually and semi-automatically, and their presence is still limited to the forms of tables and graphs. Moreover, there is no presentation in the form of maps. Therefore, a geographic information system (GIS) is required to create risk factor maps, case maps, and other activity maps, which ultimately helps to guide interventions to prevent ARI and reduce the incidence of cases.
Information exposure through a GIS can be used by the Puskesmas to obtain information and provide information for the community regarding the distribution of prone areas. A GIS is one of the health information systems that can generate spatial information about a particular situation so that it can assist in decision-making. Therefore, this research combined information from engineering and health sciences to create a disease map by utilizing the functionality of GIS.
Based on the above explanation, the aim of the
study was to create a map of case distribution and risk factors of environment-based disease (ARI) in Bantul District and to find out factors related to ARI risk factors in toddlers. The selected ARI is URI.
METHODS
This study was a quantitative research study
with epidemiologic case-control study design.6 The
research was conducted in the working area of Puskesmas Imogiri Bantul. It covered four villages: Wukirsari, Imogiri, Karang Talun, and Girirejo. The population was 777 patients who went to Puskesmas Imogiri with complaints of nasopharyngitis ARI. Total sampling was used as the sampling method. There were two groups based on the following criteria: parents whose toddlers suffered from nasopharyngitis (170 toddlers as the case group), and parents whose toddlers were healthy or did not suffer from nasopharyngitis (170 toddlers as the control group).
in toddlers. A chi-square test was performed to find out whether there was a correlation between two variables (nominal data), and, if so, its strength. The riskiest variables used an odds ratio (OR). Moran’s Index was one of the spatial analysis techniques used to determine the presence of spatial autocorrelation between observation locations. In the significance test, a normal approach was used to determine whether there was a spatial autocorrelation. The value in the calculation of Moran’s Index was between -1 and 1, and if the value was 0, it meant that it was not in the group.
RESULTS
The distribution of ARI cases in toddlers based on risk factors is shown in Table 1. It showed that toddlers with a densely occupied room (>2 persons) were more numerous than toddlers with non-occupancy (1–2 persons). The number of toddlers’ rooms with non-permanent floors (not tiled yet) was bigger than that with permanent floors. There were more houses with non-permanent walls than those with permanent walls. There were more toddlers’ rooms with bright light than those without bright light. There were more toddlers’ rooms without glass windows on the roof than those with glass windows on the roof. The number of houses using electricity as the lighting source was higher than that which did not use electricity as the lighting source. Table 1 also shows that smoke from the kitchen mostly did not go into toddlers’ rooms. Most toddlers’ family members continued to smoke. Most toddlers’ houses were away from highway pollution. Clean water was difficult to access in the ARI group; water reservoirs for daily activities were mostly open. The distance of septic tanks from the clean water source was mostly less than 10 m. Most toddlers’ families had an absorbing well. Most toddlers’ families did not destroy their garbage even though the garbage dump was typically less than 10 m from the house.
Table 1 shows the correlation between 15 indicators of house physical environment variables and ARI disease in toddlers. A correlation was seen from the
value of Pearson’s chi-square (λ2) and the sign values
of the room density, house floor type, light entering the house, light source, presence of smoking family members, proximity to pollution exposure, existence of a clean water source, condition of water reservoirs, distance of septic tank to clean water source, waste
disposal behavior, sewerage conditions, existence of an absorbing well, and distance between the house and garbage dump. The indicators that did not show a correlation between house physical environment and ARI disease in toddlers were the house walls, existence of glass windows on the house roof, kitchen
smoke, and behavior of waste destruction (λ2 = 3.034
and sign = 0.082, λ2 = <0.001 and sign = 0.986, λ2 = 0.204
and sign = 0.652; λ2 = 0.282 and sign = 0.595). Seven
risk factors increased the incidence of ARI in toddlers: the room occupancy density, glass window on house roof, electricity source, presence of smoking family members, and proximity to both pollution exposure and waste destruction. It was seen from the value of the OR and confidence interval (CI) that the lower and upper limits were >1. The allegation was made stronger since the room occupancy density, house roof without glass windows, electricity source, presence of smoking family members, proximity to pollution exposure, and not performing waste destruction were risk factors of ARI. Ten risk factors reduced the risk of ARI incidence in toddlers. They were having permanent types of floors, permanent walls, lighting, a clean water source, a closed and clean garbage dump, a septic tank at a distance over 10 m, garbage thrown out appropriately, a closed sewage channel, an absorbing well, and the distance between the garbage dump and the clean water source over 10 m.
Table 2 shows the results of physical quality measurements in toddlers’ rooms. It shows that the temperature of most toddlers’ rooms temperature was unacceptable (<18°C or >30°C). The humidity of most rooms was good. The light source was mostly
less than 60 lux. The room space was mostly <8 m2
with a ventilation area ≥1/10 of the floor area. Table 2 shows that there was a relationship between toddlers’ room temperature, humidity of most rooms, light source, room space, and ventilation
area withARI disease in toddlers (λ2 = 19.018 and sign
= <0.001, λ2 = 29.224 and sign = <0.001, λ2 = 74.558 and
sign = <0.001, λ2 = 12.815 and sign = <0.001, λ2 = 46.364
and sign = <0.001). These five risk factors increased the incidence of ARI in toddlers. It was seen from the values of OR and CI that the lower and upper limits were >1. The allegation was made stronger since they were risk factors of ARI.
two weeks, not exclusively breastfed, and incomplete immunization. It also indicates that there was a relationship between two indicators, the history of ARI and ARI disease, in toddlers in the working area of Puskesmas Imogiri 1 Bantul. This relationship was seen
from the value of Pearson chi-square (λ2) and the sign
value of cough and cold in the last one year, and lasting
over two weeks (λ2 = 57.647 sign = <0.001 and λ2 = 6.645
and sign = <0.001). It was seen from the OR and CI
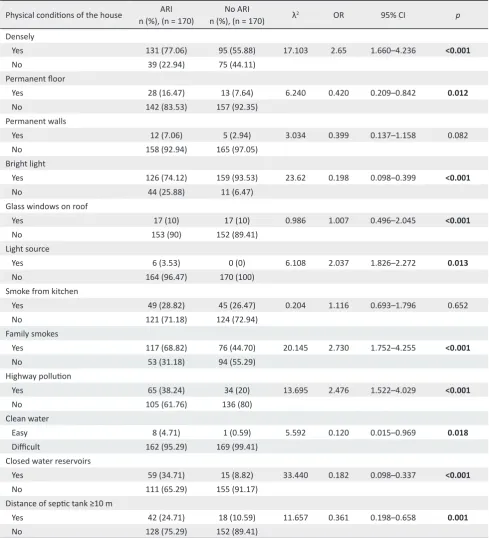
Table 1. Distribution of ARI cases based on the physical conditions of the house
lower limit and upper limit >1. The allegation was made stronger: since a toddler who had a cough and cold in the last one year and lasting for over two weeks were risk factors for ARI. The indicators that did not relate to the history of ARI were exclusive breastfeeding and
immunization completeness (λ2 = 2.116 sign = 0.146 and
λ2 = 0.298 and sign = 0.585). These two risk factors
reduced the risk of ARI in toddlers in the working area of Puskesmas Imogiri Bantul.
Physical conditions of the house n (%), (n = 170)ARI n (%), (n = 170)No ARI λ2 OR 95% CI p
Densely
Yes 131 (77.06) 95 (55.88) 17.103 2.65 1.660–4.236 <0.001
No 39 (22.94) 75 (44.11)
Permanent floor
Yes 28 (16.47) 13 (7.64) 6.240 0.420 0.209–0.842 0.012
No 142 (83.53) 157 (92.35)
Permanent walls
Yes 12 (7.06) 5 (2.94) 3.034 0.399 0.137–1.158 0.082
No 158 (92.94) 165 (97.05)
Bright light
Yes 126 (74.12) 159 (93.53) 23.62 0.198 0.098–0.399 <0.001
No 44 (25.88) 11 (6.47)
Glass windows on roof
Yes 17 (10) 17 (10) 0.986 1.007 0.496–2.045 <0.001
No 153 (90) 152 (89.41)
Light source
Yes 6 (3.53) 0 (0) 6.108 2.037 1.826–2.272 0.013
No 164 (96.47) 170 (100)
Smoke from kitchen
Yes 49 (28.82) 45 (26.47) 0.204 1.116 0.693–1.796 0.652
No 121 (71.18) 124 (72.94)
Family smokes
Yes 117 (68.82) 76 (44.70) 20.145 2.730 1.752–4.255 <0.001
No 53 (31.18) 94 (55.29)
Highway pollution
Yes 65 (38.24) 34 (20) 13.695 2.476 1.522–4.029 <0.001
No 105 (61.76) 136 (80)
Clean water
Easy 8 (4.71) 1 (0.59) 5.592 0.120 0.015–0.969 0.018
Difficult 162 (95.29) 169 (99.41)
Closed water reservoirs
Yes 59 (34.71) 15 (8.82) 33.440 0.182 0.098–0.337 <0.001
No 111 (65.29) 155 (91.17)
Distance of septic tank ≥10 m
Yes 42 (24.71) 18 (10.59) 11.657 0.361 0.198–0.658 0.001
Table 1. (Continued)
AR=acute respiratory infection; OR=odds ratio; CI=confidence interval
Table 2. Distribution of ARI cases based on physical quality measurements in toddlers’ rooms
ARI=acute respiratory infection; OR=odds ratio; CI=confidence interval
Physical conditions of the house n (%), (n = 170)ARI n (%), (n = 170)No ARI λ2 OR 95% CI p
Garbage disposal
Yes 34 (20) 38 (22.35) 0.282 1.152 0.684–1.939 0.595
No 136 (80) 132 (77.64)
Infiltration wells
Yes 72 (42.35) 34 (20) 19.794 0.340 0.210–0.552 <0.001
No 98 (57.65) 136 (80)
Distance of garbage dump ≥10 m
Yes 64 (37.65) 13 (7.64) 43.669 0.137 0.072–0.261 <0.001
No 106 (62.35) 157 (92.35)
ARI
n (%), (n = 170) n (%), (n = 170)No ARI λ2 OR 95% CI p
Room temperature (°C)
18–30 10 (5.88) 38 (22.35) 19.018 4.606 2.211–9.594 <0.001
<18 or >30 160 (94.11) 132 (77.65) Relative humidity (RH), (%)
40–60 121 (71.18) 159 (93.53) 29.224 5.853 2.920–11.733 <0.001
<40 or >60 49 (28.82) 11 (6.47)
Light source (lux)
≥60 19 (11.17) 94 (55.29) 74.558 9.830 5.588–17.292 <0.001
<60 151 (88.82) 76 (44.71)
Ventilation area (floor area)
≥1/10 116 (68.24) 144 (84.71) 12.815 2.578 1.521–4.371 <0.001
<1/10 54 (31.76) 26 (15.29)
Room space (m2)
≥8 80 (47.06) 140 (82.35) 46.364 5.250 3.196–8.623 <0.001
<8 90 (52.94) 30 (17.65)
Spatial analysis
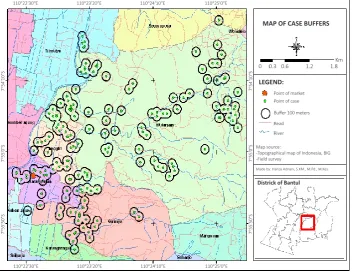
Figure 1 shows the result of a map of ARI case distribution in toddlers based on patient location. Buffering in the working area of Puskesmas Imogiri I Bantul is shown by black circles containing green dots. The spread of non-pneumonia ARI cases in toddlers is clustered at various locations around the Imogiri market (red pentagons). This pattern indicated that the market was a risky place for contracting ARI both inside and outside the market community. In addition, ARI cases also spread evenly around the working area of Puskesmas, especially in Karang Talun, Imogiri, and Wukirsari. The fewest cases were found in Girirejo.
Buffer analysis was done to identify areas around geographical features. For example, Figure 1 is a boundary area of 100 m. In this picture, many buffers that intersected (coincided) were compared with those that did not intersect with other ARI cases. This means there were indications that people with ARI transmit viruses to each other. The more buffers that intersect indicate an increased number of risk factors for ARI.
ARI
n (%), (n = 170) n (%), (n = 170)No ARI λ2 OR 95% CI p
Cough and cold in the last 1 year
Yes 164 (96.47) 108 (63.53) 57.647 15.691 6.558–37.546 <0.001
No 6 (3.53) 62 (36.47)
Cough and cold lasting over 2 weeks
Yes 42 (24.71) 8 (4.71) 27.106 6.645 3.013–14.652 <0.001
No 128 (75.29) 162 (95.29)
Exclusive breastfeeding
Yes 16 (9.41) 9 (5.29) 2.116 0.538 0.231–1.254 0.146
No 154 (90.59) 161 (94.71)
Immunization completeness
Complete 8 (4.71) 6 (3.53) 0.298 0.741 0.251–2.183 0.585
Incomplete 162 (95.29) 164 (96.47)
Table 3. The distribution of ARI cases based on the history of ARI
ARI=acute respiratory infection; OR=odds ratio; CI=confidence interval
dispersed from each other; this is called a negative
spatial autocorrelation.7 Spatial cluster analysis plays
an important role in quantifying geographic variation patterns. This analytical method was commonly used in disease surveillance, spatial epidemiology, population genetics, landscape ecology, crime analysis, and many other fields, but the underlying
principles are the same.8 Clustering analysis is
performed by placing a circle window on the study map according to the analysis and the specified model.
Figure 1. A map of acute respiratory infection case distribution in toddlers based on patient location
ARI is a disease that tends to cause clustering. Clustering occurs because most ARI sufferers tend to live in groups with individuals at risk of ARI so that increases the risk of ARI. This grouping makes it possible to detect differences in the incidence of cases between geographical locations.
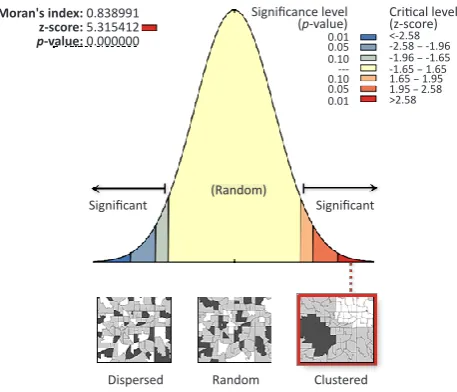
Based on the coordinate distribution of cases, spatial clusters are made using the automatic correlation Index method that produces cluster analysis as in Figure 2. The conclusion is that case distribution occurs in clusters.
MAP OF CASE BUFFERS
LEGEND:
Districk of Bantul
Point of market 110°25'0"E
110°25'0"E 110°24'10"E
110°24'10"E 110°23'20"E
110°23'20"E 110°22'30"E
110°22'30"E
7
°
54'10"S
7
°
54'10"S
7
°
55'0"S
7
°
55'0"S
7
°
55'50"S
7
°
55'50"S
Map source:
-Topographical map of Indonesia, BIG -Field survey
Point of case
Buffer 100 meters
Made by: Hariza Adnani, S.KM., M.Pd., M.Kes. Read
River
Figure 2. Moran’s Index cluster
A case will occur in a cluster if the results of Moran’s Index analysis indicate p < 0.1. The results of cluster analysis, in this case, have a p < 0.1 to produce a cluster. Based on the cluster results, it can be interpreted that the incidence of ARI cases in this region is interrelated or one case with another case is closely related because of its adjacent position. Moran’s Index value = 0.838991 shows positive spatial autocorrelation, but a small correlation because the value is close to 0.
DISCUSSION
Based on the measurement results of the physical conditions of toddlers’ rooms, there were some physical requirements for these rooms. Some rooms did not meet the requirements. Two requirements that were not fulfilled were room temperature and room lighting. They can be risk factors of ARI incidence in toddlers. The Regulation of Ministry of Health No. 1077/MENKES/PER/V/2011 regarding Guidelines for improving indoor air quality in the home state the physical requirements of a good room. A good room requires the temperature to be 18–30°C and lighting at a minimum of 60
lux.9 According to both Winslow and the American
Public Health Association, the requirements of physiological needs of houses include lighting, ventilation, adequate space, and avoiding noise. The conditions of room humidity, room size, and ventilation size were mostly good (40–60% RH and ≥1/10 of the floor area).
The study results showed that there was a correlation between the history of ARI and ARI disease in toddlers, and two risk factors increased ARI incidence in toddlers. The two risk factors were cough and cold in the last one year, and cough and cold lasting over two weeks. The factors that reduced the risk of ARI in toddlers were exclusive breastfeeding and complete immunization. The results of this study
are in line with the study of Jackson et al10 that stated
that the risk factors of ARI disease were a previous history of ARI, lack of exclusive breastfeeding, and incomplete immunization at one year. Dharmage et
al11 stated that the risk factors for ARIs are the history
of wheezing, and not being exclusively breastfed up to the completion of four months. In addition, breastfeeding is an important factor to prevent ARI.
Azizi et al12 did not explain the exact duration of
breastfeeding, but they only stated that breastfeeding should be for at least one month. The study by Deb stated that immunization played a protective role against pneumonia, breastfeeding pneumonia, and
severe disease.13
The study results showed that there was a correlation between the variable of the house physical environment and ARI in toddlers. Risk factors increasing ARI incidence in toddlers were the room occupancy density, glass window on the house roof, electricity source, presence of smoking family members, and proximity to both pollution exposure and waste destruction. The results of this study are in
line with the research of Dharmage et al11 stated that the
risk factors for ARIs were passive smokers and sharing
of sleeping space. The study of Tupasi et al14 stated
that household crowding was associated with URI.
The study of Azizi et al12 stated that home environment
factors, especially crowding, could predispose to ARI, but air pollution was not a risk factor of ARI. In line with Azizi et al12 the research of Deb stated that air
pollution was not a risk factor of ARI.13 The study of
Cardoso et al15 stated that the house density was a risk
factor of respiratory infection, but sharing a bedroom with the child did not relate to respiratory illnesses.
Gergen et al16 stated that environmental tobacco
smoke contributed to the respiratory health of children aged two months to five years. Contaminated environments, mainly affected by cigarette smoke,
were also a risk factor of respiratory infections.17 The
risk factors of ARI were indoor air pollutants and crowding-more than seven persons per household,
Moran's index: 0.838991
z-score: 5.315412
p-value: 0.000000 0.01
0.05 0.10 ---0.10 0.05 0.01
Significance level
(p-value) Critical level(z-score)
<-2.58 -2.58 − -1.96 -1.96 − -1.65 -1.65 − 1.65 1.65 − 1.95 1.95 − 2.58 >2.58
Significant Significant
whereas parental smoking was also associated
with ARI, but it was not significant.9 The risk factors
of ARI were the social, economic, environmental, behavioral, and nutritional status. These included parents’ education, settlement density, house type, house ventilation, illumination, and behaviors that produce an increasing amount of pollution in rooms such as smoking, and malnutrition. These are some of the factors contributing to the risks of ARI. In addition, the mother’s breast milk also plays a role
in the increase of respiratory tract diseases.6,18 The
study of Jedrychowski et al19 stated that ETS increases
the susceptibility of children to ARI and that central heating in the household was shown to have a protective effect when compared with children from households where coal or gas was used for home heating.
Ten factors reduced the risk of ARI in toddlers. They were permanent floor types, permanent walls, lighting, existence of a clean water source, closed and clean garbage dumps, septic tank distance over 10 m, throwing the garbage in its place, a closed sewage channel, having an absorbing well, distance between the garbage dump and the clean water source over 10 m. The results of this study are in line with the research
results of Suriyasa et al.20 They found that non-dirt
floors decreased ARI incidence by 51% compared with dirt house floor. The research of Cardoso et al15 also
supported that cases of respiratory illnesses would arise when the house did not meet the physical requirements (construction types, building materials, measurement of the floor area, wall height, windows, and solar orientation) and did not have adequate waste disposal.
Conclusions
The measurements of the physical conditions of the toddlers’ rooms show that physical requirements that are not fulfilled are the room temperature and room lighting source. There is a correlation between the history of ARI and ARI in toddlers. Two risk factors increase the incidence of ARI in toddlers; they are cough and cold in the last one year and lasting for over two weeks. The factors that reduce the risk of ARI incidence in toddlers are exclusive breastfeeding and complete immunization. There is a correlation between the house physical environment and ARI disease in toddlers. Six risk factors increase ARI incidence in toddlers. They are the room occupancy density, glass
window on the house roof, electricity source, presence of smoking family members, and proximity to both pollution exposure and waste destruction. Ten factors reduce the risk of ARI in toddlers. They are permanent floor types, permanent walls, lighting, existence of a clean water source, closed and clean garbage dumps, a septic tank distance over 10 m, throwing the garbage in its place, a closed sewage channel, having an absorbing well, and a distance between the garbage dump and clean water source over 10 m. A pattern of ARI distribution can be seen because of the presence of location clustering of one patient to the other and the proximity of the patients’ house to the market, road, or stream.
In conclusion, GIS produces a pattern of ARI distribution, the distance between patients, and the distance of the patient's house to the market, road, or river flow. Based on the cluster results, it can be interpreted that the occurrence of ARI cases in this region was interrelated or one case with another case was closely related because of their adjacent position.
Conflict of Interest
None of the authors entered as editorial board members or reviewers so that they were not involved in the review or decision-making process of the article. The authors state that this work was a case-control epidemiology study using primary data.
Acknowledgment
Acknowledgments to the Ministry of Research and Technology of Higher Education and STIKES Surya Global Yogyakarta who funded this research. Thanks to my promoter and co-promoter at the Graduate Programs in Health Promotion and Community Empowerment Universitas Sebelas Maret, Central Java, Indonesia, and my colleagues.
Funding Sources
The researchers were not funded by any pharmaceutical company, but funds were provided to them by the Indonesian government.
REFERENCES
1. Eric A. F. Simoes, Thomas Cherian, Jeffrey Chow, Sonbol A. Shahid-Salles, Ramanan Laxminarayan, and T. Jacob John. Disease Control Priorities in Developing Countries. 2nd edition.
New York: Oxford University Press; 2006.
2. WHO. Epidemic-prone & pandemic-prone acute respiratory diseases: Infection prevention & control in health-care facilities. Summary guidance 2007: 2008.
3. Ministry of Health RI. The Basic Health Research (Riskesdas) in 2013, Jakarta: Agency for Health Research and Development: 2013.
4. Zaman K, Baqui AH, Yunus M, Sack RB, Bateman OM, Chowdhury HR, et al. Acute respiratory infections in children: a community-based longitudinal study in rural Bangladesh. J Trop Pediatr. 1997:43(3); 133–7.
children and adults who develop common acute respiratory infectious conditions: a systematic review and meta-analysis. Br J Nutr. 2014:112(1); 41–54.
6. Creswel WJ. 2002. Research Design Qualitative, Quanitative, and Mixed Methods Approaches, Second Edition. London; Sage Publication: 2002.
7. Boots, BN and Getis, A,. Poin Patern Analysis. Newbury Park, Ca: Sage Production: 1988.
8. Jacquez, GM. Spatial Cluster Analysis. Chapter 22. In The Handbook of Geographic Information Science. S. Fotheringham and J. Wilson (Eds.). Blackwell Publishing, 2008. p 395–416. 9. Ministry of Health RI, 2011. Decree of the Minister of Health of
the Republic of Indonesia Number: 1077/MENKES/PER/V/2011 regarding Guidelines for Improving Indoor Air.
10. Jackson S, Mathews KH, Pulanic D, Falconer R, Rudan I, Campbell H, et al. Risk factors for severe acute lower respiratory infection in children: a systematic review and meta-analysis. Croat Med J. 2013;54(2):110–21.
11. Dharmage SC, Rajapaksa LC, Fernando DN. Risk factors of acute lower respiratory tract infections in children under five years of age. Southeast Asian J Trop Med Public Health. 1996;27(1):107–10. 12. Azizi BH, Zulkifli HI, Kasim MS. Protective and risk factors for acute respiratory infections in hospitalized urban Malaysian children: a case-control study. Southeast Asian J Trop Med Public Health. 1995;26(2):280–5.
13. Deb SK. Acute respiratory disease survey in Tripura in case of children below five years of age. J Indian Med Assoc. 1998;96(4):111–6.
14. Tupasi TE, de Leon LE, Lupisan S, Torres CU, Leonor ZA, Sunico ES, et al. Patterns of acute respiratory tract infection in children: a longitudinal study in a depressed community in Metro Manila. Rev Infect Dis. 1990:12 Suppl 8:S940–9.
15. Cardoso MR, Cousens SN, de Góes Siqueira LF, Alves FM, D’Angelo LA. Crowding: risk factor or protective factor for lower respiratory disease in young children?. BMC Public Health. 2004;4:19.
16. Gergen PJ, Fowler JA, Maurer KR, Davis WW, Overpeck MD. The burden of environmental tobacco smoke exposure on the respiratory health of children 2 months through 5 years of age in the United States: Third National Health and Nutrition Examination Survey, 1988 to 1994. Pediatrics. 1998;101(2):E8.
17. Cerqueiro MC, Murtagh P, Halac A, Avila M, Weissenbacher M. Epidemiologic risk factors for children with acute lower respiratory tract infection in Buenos Aires, Argentina: a matched case-control study. Rev Infect Dis. 1990;12 Suppl 8:S1021–8. 18. Biswas A, Biswas R, Manna B, Dutta K. Risk factors of acute
respiratory infections in underfives of urban slum community. Indian J Public Health. 1994;43(2):73–5.
19. Jedrychowski W, Maugeri U, Flak E, Mroz E, Bianchi I. Predisposition to acute respiratory infections among overweight preadolescent children: an epidemiologic study in Poland. Public Health. 1998;112(3):189–95.