Prasanthi et la. World Journal of Pharmaceutical and Medical Research
ANALYTICAL METHOD DEVELOPMENT AND VALIDATION OF RP-HPLC FOR
ESTIMATION OF PREGABALIN AND EPALRESTAT IN PURE AND
PHARMACEUTICAL DOSAGE FORM
D. Prasanthi*, Ch. M.M. Prasada Rao and D. Dhachinamoorthi
Department of Pharm. Analysis and Quality assurance, QIS College of Pharmacy, Ongole-523272.
Article Received on 19/07/2019 Article Revised on 07/08/2019 Article Accepted on 28/08/2019
INTRODUCTION
Liquid chromatography (3) is an analytical chromatographic technique that is useful for separating ions or molecules that are dissolved in a solvent. If the sample solution is in contact with a second solid or liquid phase to differing degrees due to differences in adsorption, ion exchange, partitioning or size. These differences will allow the mixture components to be separated from each other by using these differences to determine the time of the solutes through a column. During 1970’s, most chemical separations were carried out using a variety of techniques including open-column chromatography, paper chromatography and thin layer
chromatography (TLC). However, these
chromatographic techniques were inadequate for quantification of compounds and resolution between similar compounds. During this time pressure liquid chromatography began to be used to decreased flow through time, thus reducing separation time of compounds being isolated by column chromatography. However, flow rates were inconsistent, and the question of whether it was better to have constant flow rate or constant pressure debated. High pressure liquid chromatography quickly improved with the development of column packing materials. Additional convenience of on-line detectors became rapidly a powerful separation
technique and is today called as High Performance Liquid Chromatography (HPLC).
Epalrestat is a carboxylic acid derivative and a noncompetitive and reversible used for the treatment of which is one of the most common long-term complications in patients with. It reduces the accumulation of intracellular sorbitol which is believed to be the cause of diabetic neuropathy, retinopathy and nephropathy It is well tolerated, with the most commonly reported adverse effects being gastrointestinal issues such as nausea and vomiting, as well as increases in certain liver enzymes. Chemically, epalrestat is unusual in that it is a drug that contains a group. Aldose reductase is the key enzyme in the polyol pathway whose enhanced activity is the basis of diabetic neuropathy. Aldose reductase inhibitors (ARI) target this enzyme. Out of the many ARIs developed, ranirestat and fidarestat are in the trial stage. Others have been discarded due to unacceptable adverse effects or weak efficacy. Epalrestat is the only ARI commercially available. It is easily absorbed into the neural tissue and inhibits the enzyme with minimum side effects.
ISSN 2455-3301
WJPMR
AND MEDICAL RESEARCH
www.wjpmr.com
*Corresponding Author:D. Prasanthi
Department of Pharm. Analysis and Quality assurance, QIS College of Pharmacy, Ongole-523272.
ABSTRACT
A simple, Accurate, precise method was developed for the simultaneous estimation of the Pregabalin and Epalrestat in Tablet dosage form. Chromatogram was run through Std Azilent 150 x 4.6 mm, 5. Mobile phase containing Buffer: Acetonitrile taken in the ratio 45:55 was pumped through column at a flow rate of 1.0 ml/min. Buffer used in this method was 0.1% OPA buffer. Temperature was maintained at 30°C. Optimized wavelength selected was 241 nm. Retention time of Pregabalin and Epalrestatwere found to be 2.930 min and 2.179 min. %RSD of the Epalrestat and Pregabalin were and found to be 0.4and 0.2 respectively. % Recovery was obtained as 98.98% and 99.32% for Epalrestat and Pregabalin respectively. LOD, LOQ values obtained from regression equations of Epalrestat and Pregabalin were 0.02, 0.06 and 0.26, 0.77 respectively. Regression equation of Epalrestat is y = 20545x + 16173, and y = 18476x + 10803of Pregabalin. Retention times were decreased and run time was decreased, so the method developed was simple and economical that can be adopted in regular Quality control test in Industries.
Structure
PREGABALIN
Description: Pregabalin is an anticonvulsant drug used for neuropathic pain, as an adjunct therapy for partial seizures, and in generalized anxiety disorder. It was designed as a more potent successor to gabapentin. Pregabalin is marketed by Pfizer under the trade name Lyrica. It is considered to have a dependence liability if misused, and is classified as a Schedule V drug in the U.S.
Structure
EXPERIMENTAL WORK MATERIALS
Epalrestat and Pregabalin pure drugs (API), Combination Epalrestat and Pregabalin tablets (PREALDONIL 150MG TABLET) received from spectrum lab Distilled water, Acetonitrile, Phosphate buffer, Methanol, Potassium dihydrogen ortho phosphate buffer, Ortho-phosphoric acid. All the above chemicals and solvents are from Rankem Ltd.
METHODOLOGY
Diluent: Based up on the solubility of the drugs, diluent was selected, Acetonitrile and Water taken in the ratio of 50:50.
Preparation of Standard stock solutions: Accurately weighed 75 mg of Epalrestat, 75 mg of Pregabalin and transferred to 50ml&50ml volumetric flasks. 3/4 th of diluents was added and solicited for 10 minutes. Flasks were made up with diluents and labeled as Standard stock solution 1and 2.(1500µg/ml EPAL of and 1500µg/ml of PREGA).
Preparation of Standard working solutions (100% solution): 1ml from each stock solution was pipetted out and taken into a 10ml volumetric flask and made up with diluent. (150 µg/ml of EPAL and 150µg/ml of PREGA).
Preparation of Sample stock solutions: 5 tablets were weighed and the average weight of each tablet was calculated, then the weight equivalent to 1 tablet was transferred into a 100 ml volumetric flask, 50ml of diluents was added and sonicated for 25 min, further the volume was made up with diluent and filtered by HPLC filters. (1500 µg/ml of EPAL and 1500 µg/ml of PREGA).
Preparation of Sample working solutions (100% solution): 1ml of filtered sample stock solution was transferred to 10ml volumetric flask and made up with diluent. (150µg/ml of EPAL and 150µg/ml of PREGA).
Preparation of buffer
0.01N KH2PO4 Buffer:Accurately weighed 1.36gm of
Potassium dihyrogen Ortho phosphate in a 1000ml of Volumetric flask add about 900ml of milli-Q water added and degas to sonicate and finally make up the volume with water then PH adjusted to 5.4 with dil. Orthophosphoric acid solution.
0.1%OPA Buffer: 1ml of Ortho phosphoric acid was diluted to 1000ml with HPLC grade water.
VALIDATION
System suitability parameters
The system suitability parameters were determined by preparing standard solutions of Epalrestat (150ppm) and Pregabalin (150ppm) and the solutions were injected six times and the parameters like peak tailing, resolution and USP plate count were determined.
The % RSD for the area of six standard injections results should not be more than 2%.
Specificity: Checking of the interference in the optimized method.We should not find interfering peaks in blank and placebo at retention times of these drugs in this method. So this method was said to be specific.
PRECISION
Preparation of Standard stock solutions: Accurately weighed 75 mg of Epalrestat, 75 mg of Pregabalin and transferred to 50ml&50ml volumetric flasks. 3/4 th of diluents was added and solicited for 10 minutes. Flasks were made up with diluents and labeled as Standard stock solution 1and 2.(1500µg/ml EPAL of and 1500µg/ml of PREGA)
Preparation of Standard working solutions (100% solution): 1ml from each stock solution was pipetted out and taken into a 10ml volumetric flask and made up with diluent. (150 µg/ml of EPAL and 150µg/ml of PREGA).
weighed and the average weight of each tablet was calculated, then the weight equivalent to 1 tablet was transferred into a 100 ml volumetric flask, 50ml of diluents was added and sonicated for 25 min, further the volume was made up with diluent and filtered by HPLC filters.(1500 µg/ml of EPAL and 1500 µg/ml of PREGA)
Preparation of Sample working solutions (100% solution): 1ml of filtered sample stock solution was transferred to 10ml volumetric flask and made up with diluent. (150µg/ml of EPAL and 150µg/ml of PREGA)
LINEARITY
Preparation of Standard stock solutions: Accurately weighed 75 mg of Epalrestat, 75 mg of Pregabalin and transferred to 50ml&50ml volumetric flasks. 3/4 th of diluents was added and solicited for 10 minutes. Flasks were made up with diluents and labeled as Standard stock solution 1and 2.(1500µg/ml EPAL of and 1500µg/ml of PREGA)
25% Standard solution: 0.25ml each from two standard stock solutions was pipetted out and made up to 10ml. (37.5µg/ml of EPAL, and 37.5 µg/ml of PREGA) 50% Standard solution: 0.5ml each from two standard stock solutions was pipetted out and made up to 10ml. (75µg/ml of EPAL, and 75 µg/ml of PREGA)
75% Standard solution: 0.75ml each from two standard stock solutions was pipetted out and made up to 10ml. (112.5µg/ml of EPAL, and 112.5µg/ml of PREGA) 100% Standard solution: 1.0ml each from two standard stock solutions was pipetted out and made up to 10ml. (150µg/ml of EPAL, and 150µg/ml of PREGA)
125% Standard solution: 1.25ml each from two standard stock solutions was pipetted out and made up to 10ml. (187.5µg/ml of EPAL and 187.5µg/ml of PREGA) 150% Standard solution: 1.5ml each from two standard stock solutions was pipettede out and made up to 10ml. (225µg/ml of EPAL and 225µg/ml of PREGA)
Accuracy
Preparation of Standard stock solutions: Accurately weighed 75 mg of Epalrestat, 75 mg of Pregabalin and transferred to 50ml&50ml volumetric flasks. 3/4 th of diluents was added and solicited for 10 minutes. Flasks were made up with diluents and labeled as Standard stock solution 1and 2.(1500µg/ml EPAL of and 1500µg/ml of PREGA)
Preparation of 50% Spiked Solution: 0.5ml of sample stock solution was taken into a 10ml volumetric flask, to that 1.0ml from each standard stock solution was pipetted out, and made up to the mark with diluent. Preparation of 100% Spiked Solution: 1.0ml of sample stock solution was taken into a 10ml volumetric flask, to that 1.0ml from each standard stock solution was pipetted out, and made up to the mark with diluent. Preparation of 150% Spiked Solution: 1.5ml of sample stock solution was taken into a 10ml volumetric flask, to that 1.0ml from each standard stock solution was pipetted out, and made up to the mark with diluent.
Acceptance Criteria
The % Recovery for each level should be between 98.0 to 102
Robustness: Small deliberate changes in method like Flow rate, mobile phase ratio, and temperature are made but there were no recognized change in the result and are within range as per ICH Guide lines.
Robustness conditions like Flow minus (0.9ml/min), Flow plus (1.1ml/min), mobile phase minus, mobile phase plus, temperature minus (25°C) and temperature plus(35°C) was maintained and samples were injected in duplicate manner. System suitability parameters were not much effected and all the parameters were passed. %RSD was within the limit.
LOD sample Preparation: 0.25ml each from two standard stock solutions was pipetted out and transferred to two separate 10ml volumetric flasks and made up with diluents. From the above solutions 0.1ml each of Epalrestat, Pregabalin, solutions respectively were transferred to 10ml volumetric flasks and made up with the same diluents
LOQ sample Preparation: 0.25ml each from two standard stock solutions was pipetted out and transferred to two separate 10ml volumetric flask and made up with diluent. From the above solutions 0.3ml each of Epalrestat, Pregabalin, solutions respectively were transferred to 10ml volumetric flasks and made up with the same diluent.
DEGRADATION STUDIES Oxidation
To 1 ml of stock solution of Epalrestat and Pregabalin, 1 ml of 20% hydrogen peroxide (H2O2) was added separately. The solutions were kept for 30 min at 600c. For HPLC study, the resultant solution was diluted to obtain 150µg/ml&150µg/ml solution and 10 µl were injected into the system and the chromatograms were recorded to assess the stability of sample.
Acid Degradation Studies
To 1 ml of stock s solution Epalrestat and Pregabalin, 1ml of 2N Hydrochloric acid was added and refluxed for 30mins at 600c. The resultant solution was diluted to obtain 150µg/ml&150µg/ml solution and 10 µl solutions were injected into the system and the chromatograms were recorded to assess the stability of sample.
Alkali Degradation Studies
Dry Heat Degradation Studies
The standard drug solution was placed in oven at 105°C for 6 h to study dry heat degradation. For HPLC study,
the resultant solution was diluted to
150µg/ml&150µg/ml solution and10µl were injected into the system and the chromatograms were recorded to assess the stability of the sample.
Photo Stability studies
The photochemical stability of the drug was also studied by exposing the 1500µg/ml&1500µg/ml solution to UV Light by keeping the beaker in UV Chamber for 7days or 200 Watt hours/m2 in photo stability chamber. For HPLC study, the resultant solution was diluted to obtain 150µg/ml&150µg/ml solutions and 10 µl were injected into the system and the chromatograms were recorded to assess the stability of sample.
Neutral Degradation Studies
Stress testing under neutral conditions was studied by refluxing the drug in water for 6hrs at a temperature of 60º. For HPLC study, the resultant solution was diluted
to 150µg/ml&150µg/ml solution and 10 µl were injected into the system and the chromatograms were recorded to assess the stability of the sample.
RESULTS AND DISCUSSION Optimized method
Chromatographic conditions
Mobile phase : 40% OPA (0.1%): 60% Acetonitrile
Flow rate : 1 ml/min
Column : Azilent C18 (4.6 x 150mm, 5µm)
Detector wave length : 241nm Column temperature : 30°C Injection volume : 10L
Run time : 7 min
Diluent : Water and Acetonitrile in the ratio 50:50
Results : Both peaks have good resolution, tailing factor, theoretical plate count and resolution.
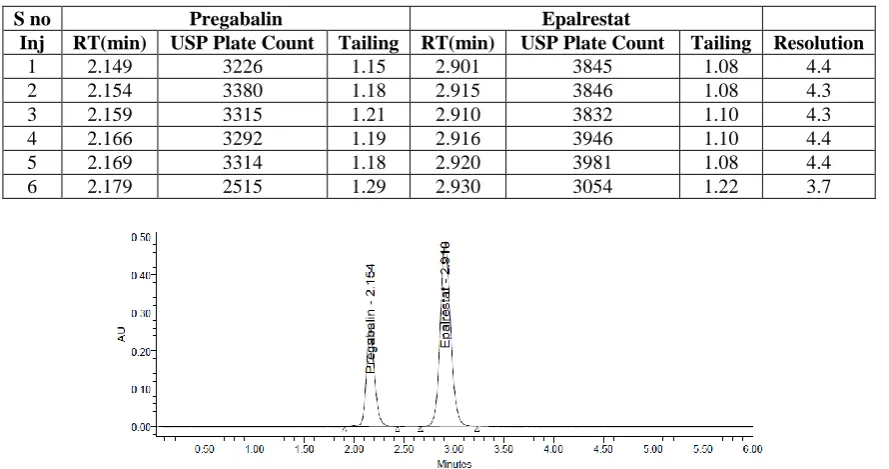
Fig 6.8 Optimized Chromatogram. Table: 6.1 System suitability parameters for Epalrestat and Pregabalin.
S no Pregabalin Epalrestat
Inj RT(min) USP Plate Count Tailing RT(min) USP Plate Count Tailing Resolution
1 2.149 3226 1.15 2.901 3845 1.08 4.4
2 2.154 3380 1.18 2.915 3846 1.08 4.3
3 2.159 3315 1.21 2.910 3832 1.10 4.3
4 2.166 3292 1.19 2.916 3946 1.10 4.4
5 2.169 3314 1.18 2.920 3981 1.08 4.4
6 2.179 2515 1.29 2.930 3054 1.22 3.7
Discussion: According to ICH guidelines plate count should be more than 2000, tailing factor should be less than 2 and resolution must be more than 2. All the
system suitable parameters were passed and were within the limits.
Validation: Specificity
Figure No. 6.12. Chromatogram of blank.
Figure No. 6.13 Chromatogram of placebo. Linearity
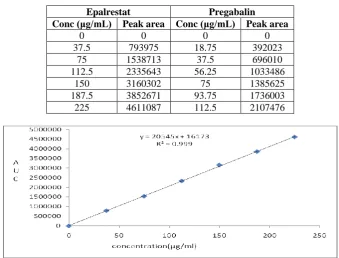
Table 6.2 Linearity table for Epalrestat and Pregabalin.
Epalrestat Pregabalin
Conc (μg/mL) Peak area Conc (μg/mL) Peak area
0 0 0 0
37.5 793975 18.75 392023
75 1538713 37.5 696010
112.5 2335643 56.25 1033486
150 3160302 75 1385625
187.5 3852671 93.75 1736003
225 4611087 112.5 2107476
Fig No. Calibration curve of Pregabalin. Discussion: Six linear concentrations of Epalrestat
(37.5-225µg/ml) and Pregabalin (18.75-112.5µg/ml) were injected in a duplicate manner. Average areas were mentioned above and linearity equations obtained for Epalrestat was y =20545.x + 16173 and of Pregabalin was y = 18476x + 10803 Correlation coefficient obtained was 0.999 for the two drugs.
PRECISION System Precision
Table 6.3: System precision table of Epalrestat and Pregabalin.
S. No Area of Epalrestat Area of Pregabalin
1. 3105736 1300458
2. 3146003 1316596
3. 3145407 1320473
4. 3159858 1314421
5. 3146567 1321248
6. 3145825 1322787
Mean 3141566 1315997
S.D 18417.3 8222.1
%RSD 0.6 0.6
Repeatability
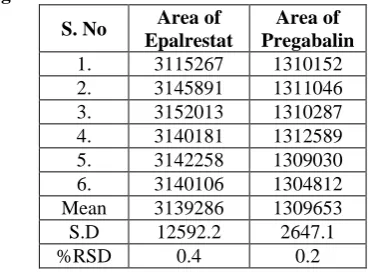
Table 6.4 Repeatability table of Epalrestat and Pregabalin.
S. No Area of Epalrestat
Area of Pregabalin
1. 3115267 1310152
2. 3145891 1311046
3. 3152013 1310287
4. 3140181 1312589
5. 3142258 1309030
6. 3140106 1304812
Mean 3139286 1309653
S.D 12592.2 2647.1
%RSD 0.4 0.2
Intermediate precision (Day_ Day Precision)
Table 6.5 Intermediate precision table of Epalrestat and Pregabalin.
S. No Area
of Epalrestat
Area of Pregabalin
1. 3252623 1241050
2. 3279229 1230421
3. 3296583 1211693
4. 3230020 1226513
5. 3238091 1240509
6. 3251171 1224768
Mean 3257953 1229159
S.D 25274.9 10983.2
%RSD 0.8 0.9
Accuracy
Table Accuracy table of Epalrestat. % Level Amount Spiked
(μg/mL)
Amount recovered
(μg/mL) % Recovery Mean %Recovery
50%
75 74.08 98.77
98.98%
75 74.39 99.18
75 74.62 99.49
100%
150 150.49 100.33
150 147.25 98.17
150 148.32 98.88
150%
225 223.30 99.25
225 221.78 98.57
Accuracy table of Pregabalin.
% Level Amount Spiked (μg/mL)
Amount recovered
(μg/mL) % Recovery
Mean %Recovery 50%
37.5 37.04 98.78
99.35%
37.5 37.54 100.10
37.5 37.34 99.56
100%
75 73.67 98.22
75 74.06 98.74
75 75.16 100.22
150%
112.5 111.51 99.12
112.5 112.15 99.69
112.5 112.23 99.76
Sensitivity
Table: Sensitivity table of Epalrestat and Pregabalin.
Molecule LOD LOQ Epalrestat 0.20 0.62 Pregabalin 0.18 0.56 Robustness
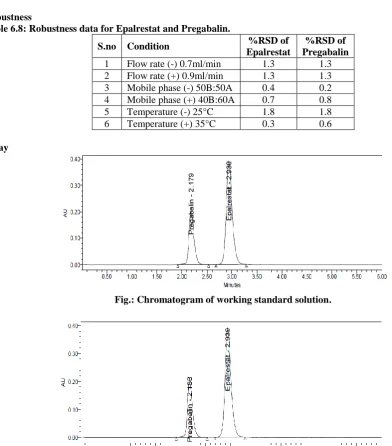
Table 6.8: Robustness data for Epalrestat and Pregabalin.
S.no Condition %RSD of
Epalrestat
%RSD of Pregabalin
1 Flow rate (-) 0.7ml/min 1.3 1.3
2 Flow rate (+) 0.9ml/min 1.3 1.3
3 Mobile phase (-) 50B:50A 0.4 0.2
4 Mobile phase (+) 40B:60A 0.7 0.8
5 Temperature (-) 25°C 1.8 1.8
6 Temperature (+) 35°C 0.3 0.6
Assay
Fig.: Chromatogram of working standard solution.
DEGRADATION
Epalrestat Pregabalin
S.no Standard Area
Sample area
% Assay
Standard Area
Sample
area % Assay
1 3105736 3115267 98.96 1300458 1310152 99.36
2 3146003 3145891 99.94 1316596 1311046 99.42
3 3145407 3152013 100.13 1320473 1310287 99.37
4 3159858 3140181 99.76 1314421 1312589 99.54
5 3146567 3142258 99.82 1321248 1309030 99.27
6 3145825 3140106 99.75 1322787 1304812 98.95
Avg 3141566 3139286 99.73 1315997 1309653 99.32
Stdev 18417.3 12592.2 0.4 8222.1 2647.1 0.2
%RSD 0.6 0.4 0.4 0.6 0.2 0.2
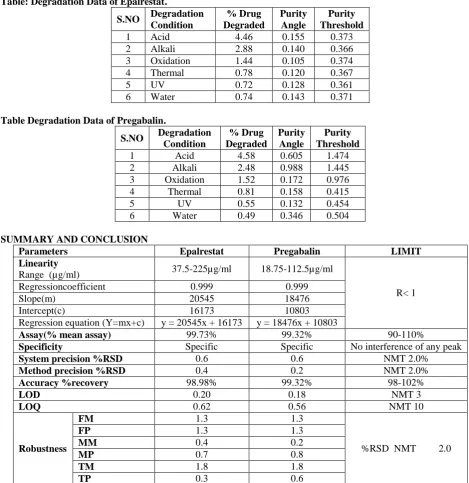
Degradation Studies: Degradation studies were performed with the formulation and the degraded samples were injected. Assay of the injected samples was calculated and all the samples passed the limits of degradation.
Table: Degradation Data of Epalrestat.
S.NO Degradation Condition
% Drug Degraded
Purity Angle
Purity Threshold
1 Acid 4.46 0.155 0.373
2 Alkali 2.88 0.140 0.366
3 Oxidation 1.44 0.105 0.374
4 Thermal 0.78 0.120 0.367
5 UV 0.72 0.128 0.361
6 Water 0.74 0.143 0.371
Table Degradation Data of Pregabalin.
S.NO Degradation Condition
% Drug Degraded
Purity Angle
Purity Threshold
1 Acid 4.58 0.605 1.474
2 Alkali 2.48 0.988 1.445
3 Oxidation 1.52 0.172 0.976
4 Thermal 0.81 0.158 0.415
5 UV 0.55 0.132 0.454
6 Water 0.49 0.346 0.504
SUMMARY AND CONCLUSION
Parameters Epalrestat Pregabalin LIMIT
Linearity
Range (µg/ml) 37.5-225µg/ml 18.75-112.5µg/ml
R< 1
Regressioncoefficient 0.999 0.999
Slope(m) 20545 18476
Intercept(c) 16173 10803
Regression equation (Y=mx+c) y = 20545x + 16173 y = 18476x + 10803
Assay(% mean assay) 99.73% 99.32% 90-110%
Specificity Specific Specific No interference of any peak
System precision %RSD 0.6 0.6 NMT 2.0%
Method precision %RSD 0.4 0.2 NMT 2.0%
Accuracy %recovery 98.98% 99.32% 98-102%
LOD 0.20 0.18 NMT 3
LOQ 0.62 0.56 NMT 10
Robustness
FM 1.3 1.3
%RSD NMT 2.0
FP 1.3 1.3
MM 0.4 0.2
MP 0.7 0.8
TM 1.8 1.8
CONCLUSION
A simple, Accurate, precise method was developed for the simultaneous estimation of the Epalrestat and Pregabalin in Tablet dosage form. Retention time of Epalrestat and Pregabalin were found to be 2.930 min and 2.179 min. %RSD of the Epalrestat and Pregabalin were and found to be 0.4and 0.2 respectively. %Recovery was obtained as 98.98% and 99.32% for Epalrestat and Pregabalin respectively. LOD, LOQ values obtained from regression equations of Epalrestat and Pregabalin were 0.02, 0.06 and 0.26, 0.77 respectively. Regression equation of Epalrestat is y = 20545x + 16173, and y = 18476x + 10803of Pregabalin. Retention times were decreased and that run time was decreased, so the method developed was simple and economical that can be adopted in regular Quality control test in Industries.
RERFERENCES
1. B.k Sharma, Instrumental methods of chemical analysis, Introduction to analytical chemistry, 23rd Edition Goel publication, Meerut, 2007.
2. Lindholm. J, Development and Validation of HPLC Method for Analytical and Preparative purpose. Acta Universitatis Upsaliensis, 2004; 13-14.
3. Rashmin, An introduction to analytical Method Development for Pharmaceutical formulations. Indoglobal Journal of Pharmaceutical Sciences, 2012; 2(2): 191-196.
4. Malvia R, Bansal V, Pal O.P and Sharma P.K. A
Review of High Performance Liquid
Chromatography. Journal of Global Pharma technology, 2010.
5. Douglas A Skoog, F. James Holler, Timothy A. Niemen, Principles of Instrumental Analysis, 725-760.
6. Dr. S. Ravi Shankar, Text book of Pharmaceutical analysis, Fourth edition, 13.1-13.2.
7. David G. Watson. Pharmaceutical Analysis, A text book for Pharmacy students and Pharmaceutical Chemists. Harcourt Publishers Limited; 2nd Ed., 221-232.
8. Remingtonn’s The Sciences and Practise of Pharmacy, 20th Edition, 2000.
9. Connors Ka. A Textbook of Pharmaceutical Analysis, Wiley intersciences Inc; Delhi, 3rd Ed, 1994; 373-421.
10. Gurdeep R. Chatwal, Sham K. Anand, Instrumental Methods of Chemical Analysis, 2007; 2.566-2. 638. 11. David G. Watson Pharmaceutical Analysis, A text
book for pharmacy students and Pharmaceutical Chemists. Harcourt Publishers Limited; 2nd Ed., 267-311.
12. Nasal. A, Siluk.D, and Kaliszan. R. Chromatographic Retention Parameters in Medicinal Chemistry and Pharmacology, Pubmed, March, 2003; 10(5): 381-426.
13. Ashok Kumar, Lalith Kishore, navpreet Kaur, Anroop Nair. Method Development and Validation for Pharmaceutical Analysis. International
Pharmaceutica Sciencia, Jul-Sep, 2012; 2(3). 14. Kaushal. C, Srivatsava. B, A Process of Method
Development: A Chromatographic Approach. J Chem Pharm Res., 2010; 2(2): 519-545.
15. Vibha Gupta, Ajay Deep Kumar Jain, N.S.Gill, Kapil, Development and Validation of HPLC method. International Research Journal of Pharmaeutical and Applied Sciences, Jul-Aug 2012; 2(4).
16. Hokanson GC. A life cycle approach to the validation of analytical methods during Pharmaceutical Product Development. Part 1: The Initial Validation Process. Pharm Tech., 1994: 92-100.
17. Green JM. A Practicle guide to analytical method validation, Anal Chem., 1996; 305A-309A.
18. ICH, Validation of analytical procedures: Text and Methodology. International Conference on Harmonization, IFPMA, Geneva, 1996.
19. IUPAC. Compendium of Chemical Terminology, 2nd edn. (The Gold Book). PAC69, 1997; 1137. Glossary of terms used in computational drug design (IUPAC Recommendations.
20. Indian Pharmacopoeia, Indian Pharmacopoeial Commission, Controller of Publication, Government of India, Ministry of health and Family Welfare, Ghaziabad, India, 2010; 2: 1657-1658.
21. British Pharmacopoeia, The British Pharmacopoeial Commission, the stationary office, UK, London, 2, 2011; 1408-1409.
22. Grempler R, Thomas L, Eckhardt M, Himmelsbach F, Sauer A, Sharp DE, Bakker RA, Mark M, Klein T, Eickelmann P. "Pregabalin, a novel selective sodium glucose cotransporter-2 (SGLT-2) inhibitor: characterisation and comparison with other SGLT-2 inhibitors”, January 2012.
23. Abdul-Ghani MA, DeFronzo RA (September 2008). "Inhibition of renal glucose reabsorption: a novel strategy for achieving glucose control in type 2 diabetes mellitus". Endocr Pract, 2010; 14(6): 782– 90.
24. “https://www.drugs.com/sfx/Pregabalin-side-effects.html”
25. Steele, John W.; Faulds, Diana; Goa, Karen L. "Epalrestat". Drugs & Aging, 1993; 3(6): 532– 555. doi:10.2165/00002512-199303060-00007. 26. Kasawar GB et al., Development and validation of
HPLC method for the determination of pregabalin in capsules. Indian journal of pharmaceutical sciences, 2010.
27. Mili patel et al., development and validation of rp-hplc method for simultaneous estimation of epalrestat and methylcobalamin in tablet dosage form. World journal of pharmacy and pharmaceutical sciences, 2015.
29. Vaishali1*, Vikas Singh2, Rajnish Kumar Singh1, Ramesh Kumar Gupta1, Sudhansu.
30. Ranjan Swain3, development and validation of rp-hplc method for the assay of pregabalin capsule world journal of pharmacy and pharmaceutical sciences, 3(1): 703-71.
31. P. Janaki Pathi1 *, N. Appala Raju2 The Estimation of Epalrestat in Tablet Dosage Form by RP-HPLC. Asian J. Pharm. Ana., 2012; 2(2): 49-51.