The Power of Ensemble Models in Fingerprint Classification: A
case study
RAPHAEL DELIMAMENDES1
ROSALVOFERREIRA DEOLIVEIRANETO2
Univasf - Federal University of Vale do São Francisco Department of Computer Engineering
Av. Antônio Carlos Magalhães, 510 - Santo Antônio 48902-300- Juazeiro (BA) - Brazil 1([email protected]
2
Abstract. The use of fingerprints as biometrics has been practiced for more than 100 years. With the popularization of sensors and fingerprint capturing methodologies the use of this method for authentica-tion and recogniauthentica-tion has grown during the past years. However, the use for recogniauthentica-tion in large databases with a huge number of entries is computationally costly, hence the classification of fingerprints aims to attenuate this cost by increasing optimization. This paper presents a performance comparison between two ensemble of classifiers and a decision tree classifier, applied to the database of a known benchmark, the NIST sd-14 database, for the classification of fingerprints. The comparison was executed using the stratified cross-validation process to set the confidence interval for the evaluation of performance measured by success rate, using Random Forest, XGBoost and Decision Tree as classifiers. Studentâs one-tailed paired t-test showed that Random Forest and XGBoost do not have statistical differences with significance of 95%, however, their performance is superior than the one of the simple Decision Tree classifier.
Keywords: fingerprints, classification, machine learning, biometrics, xgboost, random forest, decision tree.
(Received December 7th, 2017 / Accepted March 28th, 2018)
1 Introduction
Human body characteristics such as face and voice have been used to recognize individuals by humans for thou-sands of years. In the mid-19th century the police de-partment of Paris developed a system for identifying criminals using a number of body measurements. It was obscured by a simpler, yet practical discovery of the uniqueness of human fingerprints in the late 19th century. Soon after this discovery, many major law en-forcement departments embraced the idea of storing fin-gerprints of criminals in a database, usually a card file, for later use to confront with fingerprints left at crime scenes (usually named latent fingerprints). Even if the use of biometrics emerged from its applicability in law
enforcement for identifying criminals, its use is becom-ing increasbecom-ingly popular in automated recognition sys-tems in many popular applications, such as smartphones and banking [15].
According to [15], a biometric can be any physio-logical and/or behavioral characteristic that satisfies the following requirements:
• Universality: the characteristic is present in each person.
• Distinctiveness: any two persons should be suffi-ciently different regarding the characteristic.
• Collectability: the characteristic can be quantita-tively measured.
Fingerprint-based biometrics satisfies all these re-quirements and is showing to be highly applicable to machine vision techniques, because the acquisition of fingerprint images is usually done in a controlled envi-ronment, with a especially designed scanner, opposite from image recognition systems that suffer from differ-ent lighting and shadowing [3].
A common task of a fingerprint recognition system is to identify an individual in a database, for instance, in airports. The problem resides in executing the match in an acceptable time in a dataset with millions of en-tries. This operation can be improved by partitioning the database into predefined classes of fingerprints, in which the search would happen. The most used scheme to classify fingerprints used today by law enforcement agencies is based on the Galton-Henry system. It clas-sifies the fingerprint according to the ridge pattern [26]. A desirable requirement for a fingerprint classification system is a low error rate and low computational cost. Scalability is also important. Thus, this paper com-pared the decision tree model with ensemble models for fingerprint classification, as the latter is being used in several winning solutions in machine learning competi-tions [8]. In order to compare these methods, cross val-idation was used with ten folds in order to define confi-dence intervals for error rate. Fingerprints used were images from the National Institute of Standards and Technology (NIST) public database, a common bench-mark for fingerprint applications.
The remaining of this paper is organized as fol-lows. Section 2 presents the problem definition. Sec-tion 3 presents the related works. SecSec-tion 4 presents the basic concepts in fingerprint classification. Sec-tion 5 shows the experimental methodology. SecSec-tion 6 presents the experimental results and their interpreta-tion. Finally, Section 7 concludes this paper and pro-poses future works.
2 Problem Definition
According to [21] a fingerprint is the representation of ridge patterns that exist in the human fingertips printed in a contact surface. It is composed by parallel ridges and valleys. In Figure 1 it is possible to observe these characteristics.
A fingerprint is basically composed by two layers, the epidermis and the dermis, the most external and in-ternal layers observed in the fingerprint, respectively. The epidermis has five different layers of cells and the dermis has only one large layer composed of connective
Figure 1:Ridges and Valleys in a Fingerprint [19]
skin and veins. The ridges that exist in the epidermis are supported by two papillae in the dermis, providing the recovery of fingerprints even in decomposing bod-ies. The finger skin is composed of ridges and sweat glands. All these factors make a fingerprint unique ac-cording to some points and discontinuities in the ridges and valleys, known as Minutiae [22].
The Galton-Henry Classification System groups the patterns of fingerprints in classes. In this paper, five classes were used for classification: arches, tented arches, whorl, left loop and right loop [16]. Figure 2 shows these classes. These patterns are defined below:
• Left Loop is the fingerprint pattern consisting in the beginning of ridges in one of the sides of the fingerprint and returning to the same direction af-ter a loop, usually in the middle of the fingerprint, from the left.
• Right Loop is the fingerprint pattern consisting in the beginning of ridges in one of the sides of the fingerprint and returning to the same direction af-ter a loop, usually in the middle of the fingerprint from the right.
• In Arches, the fingerprint patterns begin on one side of the fingerprint towards the other side with a small slope in the middle.
• When a delta is formed in an Arch pattern, it is called a tented arch.
• In Whorls, a whorl-shaped pattern is formed in the fingerprint.
3 Related Works
(a) Arch (b) TentedArch
(c) Left Loop (d) Right Loop
(e) Whorl
Figure 2:Five main types of fingerprint classification as defined by Henry [5]
basic structures of the fingerprint ridges: Plain Ridge, Arch Ridge, Triangle Ridge, Left-loop ridge, Right-loop ridge, Circle Ridge, Whorl ridge, Smile ridge, Bal-loon ridge, Double-loop ridge, considering that for each class in the Henry System there is a specific sequence. Karu and Jain [15] developed a technique of classifi-cation by using the singular points, core and delta of the fingerprint, using the Poincare algorithm. This al-gorithm sums the changes of the angles according to a point in an image. In 1999, Jain et. al [14] proposed a model based on Gabor filters that are applied to sixteen values of orientation in different sectors of an image. The Gabor coefficients are used as input features for a K-nearest neighbors (KNN) followed by an Artificial Neural Network (ANN) classifier [14]. The National Institute of Standards and Technology (NIST) finger-print classifier uses a probabilistic neural network for classifying the fingerprint based on 128 features [18]. Other application of ANN on fingerprint matching is
mentioned by [30]. The authors highlighted the perfor-mance gain when it was implemented into a hardware-based Artificial Neural Network device. In addition to ANN and KNN, other commonly used algorithms to fingerprint classification are Hidden Markov mod-els [28], Fuzzy Neural Network [24] and Support Vec-tor Machine [13]. There are still works combining fin-gerprint with other biometric techniques, an example is [27] combining iris and fingerprint.
4 Basic Concepts in Fingerprint Classifica-tion
The fingerprint classification process is defined in this section. This process consist of four steps [29],[23],[12],[4]: acquisition, image enhancement, feature extraction and application of a classifier algo-rithm. Figure 3 shows this process.
Figure 3:Fingerprint Classification Process
4.1 Fingerprint Acquisition
charge generated by the contact create the digital fin-gerprint [9].
4.2 Image Enhancement
Image enhancement is an important step because it may increase the accuracy of the results, especially for low quality images. An image is considered of good qual-ity if it has a high contrast difference between ridges and valleys. A low quality image has low contrast and high noise. Low quality images are usually due to the conditions of the skin during the acquisition process, scars, age and damage due to using the hands in some labor activities such as Agriculture. Therefore, some techniques are applied to attenuate these factors in or-der to increase the performance of feature extraction al-gorithms. Among the techniques more used in this step are Segmentation and Thinning. They are used to high-light the region of interest [1]. These processes will be described next.
4.2.1 Segmentation
Segmentation is the identification and separation of the foreground and background regions. The foreground regions show variation in gray scale and are the region of interest (ROI) of a fingerprint. The background is the area external to the fingerprint. This step is important because it can identify noise and minimize errors for the next steps, with the algorithm only being applied in the fingerprint ROI. Since gray scale variation is higher in ROI, the image is divided into fixed blocks of pixels and variation calculated. If results are less than the global threshold then the block is considered background, oth-erwise foreground [11].
4.2.2 Thinning
Thinning is the process of reducing redundant lines in the fingerprint until these lines become 1 pixel wide (too see Figure 4). The thinning or skeletonization al-gorithms use 3x3 pixels blocks in each verification and redundant pixels are marked. After a pre-defined num-ber of iterations all marked pixels are removed. Af-ter this process, some morphological operations are ap-plied into the remaining lines in order to remove possi-ble noise, such as separated dots [6].
4.3 Feature Extraction
The size of these images makes computationally im-practical to use them as the feature inputs into ei-ther of the classifiers, so it would be helpful to trans-form these high-dimensional feature vectors into much
Figure 4:Thinned Fingerprint [17]
lower-dimensional ones, in such a way that would not be detrimental to the classifiers. Feature extraction does exactly that. Feature Extraction is a form of dimension-ality reduction, which is the process of reducing the size of the feature space. There are two ways of reducing di-mensionality: feature selection and feature extraction. Feature selection uses a subset of the feature space that better represents the original space used by a specific criterion, such as entropy. On the other hand, Feature Extraction creates new characteristics from transforma-tions or combinatransforma-tions of the original set of character-istics. In this case, the new generated features have a smaller dimensionality, becoming the new represen-tation of the feature space. The approach of dimen-sionality reduction used in fingerprints is the feature extraction. Among the techniques more used in this step are: Gabor filters [12], Fourier transform [23] and Karhunen-Loeve transform [32].
4.4 Classification
strategy of voting to combine the classifiers. Bagging is the acronym for bootstrap aggregating. The idea is to build many individual classifiers from a bootstrap sam-ple. The objective is to reduce the variance of error in the final classifier using the voting system, where each classifier has the same voting weight in the system. On the other hand, Boosting has the objective of creating individual classifiers that are specialists in some seg-ments of the original data. Therefore, the individual classifiers are created sequentially and the next classi-fier will focus on errors made by previous classiclassi-fiers. Boosting also uses the voting system to combine classi-fiers; however the weight of each individual classifier is estimated based on its errors. Classifiers Random Forest, XGBoost and Decision Tree were used in this paper.
4.4.1 Random Forest
Random Forest is a kind of ensemble model. It is an efficient non-parametric method able to perform classi-fications and regressions. Random Forest is the combi-nation of n Decision Trees [2]. Each tree finds its own solution and is presented to a set of other decision trees. The final solution depends on its intention:
• Classification: when the intention is to perform a classification, each component tree of the forest classifies a subset of the feature inputs. The final classification will be the most recurrent result from all the trees in the Random Forest.
• Regression: when the intention is to perform a re-gression, the average of all solutions is calculated for the Random Forest.
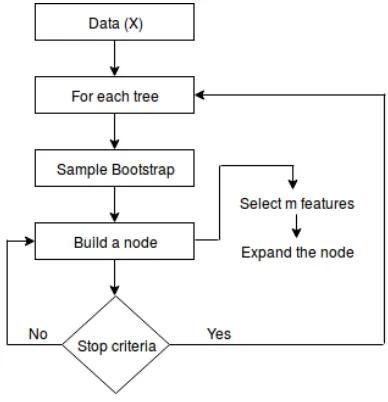
The Random Forest was proposed by Breiman [2] and it is an ensemble learning model classifier. This classifier uses the strategy of divide-and-conquer by means of using many classifiers. These classifiers alone do not have a good performance but when combined they are able to produce a robust, high performance classifier. In Random Forest a set of decision trees is used, therefore creating a Forest. Each tree will be cre-ated with a random subset of the training set (bootstrap). During the classification phase, each Decision Tree will receive the input to be classified and will return a result. Results from each tree will be counted as one vote in the Forest. The class with more votes will be the fi-nal result. In a Decision Tree classifier each node is created based on the attributes providing the best divi-sion in the tree compared to all available attributes. In Random Forest, on the other hand, each decision tree is created based on a random subset of the same size in
every Decision Tree of the forest. This strategy allows a high tolerance to overfitting [20]. Random Forest has only two parameters: number of trees in the forest and number of attributes randomly chosen. Figure 5 shows the Random Forest flowchart.
Figure 5:Random Forest flowchart
4.4.2 XGBoost
uses a more regularized model formalization to control over-fitting and 2) it also leverages the structure of the hardware in order to speed up computing times and fa-cilitate memory usage. However, this results on it hav-ing many parameters.
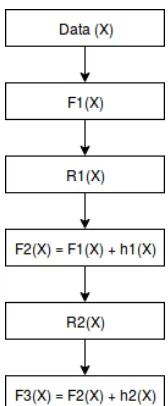
Figure 6:Gradient Boosting flowchart for an ensemble of three mod-els
5 Experimental Methodology
In this section the experimental methodology is dis-cussed.
5.1 Data Source
For the experiment, a subset of 2700 images from the NIST sd-14 data was used. This data source is a common benchmark for fingerprint studies. This data source has the following features:
• Each segmented image has 832 by 768 pixels and classification is given by the Federal Bureau of In-vestigation (FBI).
• Images are compressed with an implementation of the Wavelength Scalar Quantization (WSQ) com-pression specification.
• Fingerprint paper cards are randomly selected, thus approximating the natural horizontal distribu-tion of classificadistribu-tions.
• Scanned at 19.7 pixels per mm.
5.2 Performance Evaluation Metric
The evaluation metric for the experiment was:
• Accuracy of the classifications:
Accuracy=C/N (1)
Where:
– C is the number of classes correctly classi-fied;
– N is the total number of classifications.
5.3 Performance Evaluation Methodology
The evaluation method k-fold Cross Validation is widely accepted to splitting a single sample into k sta-tistically independent sets of tests, allowing the con-struction of confidence intervals for evaluating of per-formance. In this paper, k = 10 was used. Folds had the same size. Ten fold cross validation was used in order to provide ten rounds of results for each algorithm. All folds are mutually exclusive and represent 10% of the data, resulting in 270 images per round to be tested and in 2430 images remaining for training. Figure 7 illus-trates the process.
Figure 7:10 Fold Cross Validation.
5.4 Paired T-Student Test
Studentâs paired t-test is a special case of the hypothesis test applied when the observations of two populations of interest are collected in pairs, each pair having obser-vations taken under the same homogeneous conditions. For this study, the metric of interest was: Difference in the Accuracy of Classification. The test is detailed next:
• Alternative hypothesis:µ1> µ2
Where:
• µ1represents the mean of the metric with the high-est result.
• µ2 represents the mean of the metric with the smallest result.
5.5 Experimental Setup
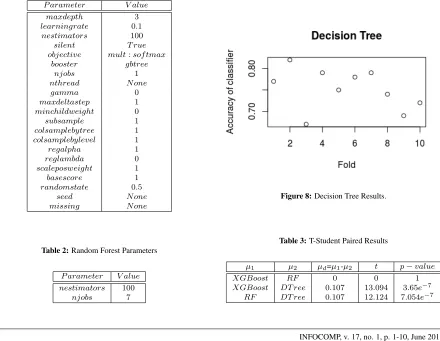
The classification algorithms were implemented using Python version 2.7.10, sklearn python package version 0.18.2. Nist Biometric Image Software (NBIS) 5.0.0 was used for image enhancement (Segmentation by adaptive local thresholding and Thinning) and feature extraction (Karhunen-Loeveâs transformation). The system used to run the algorithms was an Intel Core i5 2.6 GHz in a Macbook Pro Retina Early 2013 with 8 GB of Memory 1600 MHz DDR3. The parameters for each algorithm are shown in Tables 1 and 2. The description of parameters can be seen in [31].
Table 1:XGBoost Parameters
P arameter V alue
maxdepth 3
learningrate 0.1
nestimators 100
silent T rue objective mult:sof tmax
booster gbtree
njobs 1
nthread N one
gamma 0
maxdeltastep 1
minchildweight 0
subsample 1
colsamplebytree 1
colsamplebylevel 1
regalpha 1
reglambda 0
scaleposweight 1
basescore 1
randomstate 0.5
seed N one
missing N one
Table 2:Random Forest Parameters
P arameter V alue nestimators 100
njobs 7
6 Results
Simulations were made according to the experimental setup described in the previous section for each one of the three classifiers, resulting in 10 testing sets, all sta-tistically independent. Figure 8 shows results obtained by Decision Tree, which provided an accuracy ranging from 67% to 82% with an average rating of 75.2%. Fig-ure 9 shows results obtained by Random Forest, which provided an accuracy ranging from 80% to 89% with an average classification of 85.9%. Figure 10 shows results obtained by XGBoost, which provided an accu-racy ranging from 81% to 91% with an average classi-fication of 85.9%.
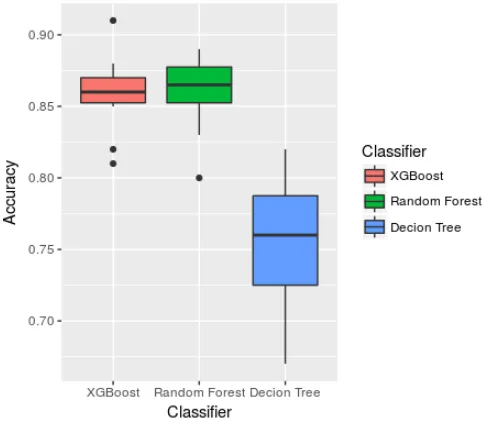
Table 4 shows the results for each one of the three classifiers and Figure 11 shows the boxplots, where it is possible to perceive that Decision Tree shows the lowest results for mean, minimum and maximum. The XGBoost and Random Forest showed similar results, however XGBoost had better minimum and maximum. Results show that Random Forest and XGBoost do not have statistical difference with significance of 95% since p-value is greater than 0.05 as can be seen in Ta-ble 3. However, they outperform Decision Tree and the differences were statistically significant, since p-value is less than 0.05.
Figure 8:Decision Tree Results.
Table 3:T-Student Paired Results
µ1 µ2 µd=µ1-µ2 t p−value
XGBoost RF 0 0 1
Figure 9:Random Forest Results.
Figure 10:XGBoost Results.
Table 4:Results of classifiers
F old D.T ree RF XGBoost
1 0.77 0.88 0.86
2 0.82 0.89 0.91
3 0.67 0.80 0.81
4 0.79 0.87 0.87
5 0.75 0.86 0.86
6 0.78 0.87 0.86
7 0.79 0.86 0.87
8 0.74 0.88 0.88
9 0.69 0.83 0.82
10 0.72 0.85 0.85
7 Conclusion
This paper showed the results of classifiers Random Forest, XGBoost and Decision Tree in the fingerprint
Figure 11:Boxplot of all classifiers.
classification problem. Results show that the Random Forest and XGBoost (ensemble models) do not have any significant statistical difference with 95% of con-fidence interval, but showed better results when com-pared to the Decision Tree classifier, with a difference of about 10% in accuracy.
Results obtained corroborate with recent results showing that the strategy of ensemble models provides a better predictive power to the classification process and that both, Random Forest and XGBoost, are ade-quate to problems with high dimensionality and in small samples, which was the experimental setup of this pa-per. Another important result of this study is that it shows that the Random Forest is an interesting option for fingerprint recognition systems, as it provides an equivalent power when compared to XGBoost and has fewer parameters than the XGBoost algorithm (2 x 21). More studies can be made as the feature extraction could be used to test other classifiers such as Neural Networks. Also, the process of feature extraction and classification can be compared to Deep Neural Network classifiers where feature extraction is done directly in the classifier and does not depend on the process and algorithms presented in this paper.
References
and Computers, 2006. ACSSC’06. Fortieth Asilo-mar Conference on, pages 598–602. IEEE, 2006.
[2] Breiman, L. Random forests. Machine learning, 45(1):5–32, 2001.
[3] Burge, M. and Burger, W. Ear biometrics. In Bio-metrics, pages 273–285. Springer, 1996.
[4] Cappelli, R., Maio, D., and Maltoni, D. A multi-classifier approach to fingerprint classifica-tion. Pattern Analysis & Applications, 5(2):136– 144, 2002.
[5] Carneiro, R., Bessa, J., and Moraes, J. Techniques of binarization, thinning and feature extraction ap-plied to a fingerprint system. International Jour-nal of Computer Applications, 103:1–8, 2014.
[6] Casado, R. S. Extração de minúcias em imagens de impressões digitais. PhD thesis, Universidade de São Paulo, 2008.
[7] Chang, J.-H. and Fan, K.-C. A new model for fingerprint classification by ridge distribution se-quences. Pattern Recognition, 35(6):1209–1223, 2002.
[8] Chen, T. and Guestrin, C. Xgboost: A scal-able tree boosting system. InProceedings of the 22Nd ACM SIGKDD International Conference on Knowledge Discovery and Data Mining, pages 785–794. ACM, 2016.
[9] Dhundhwal, P. and Maan, N. Design and im-plementation of enhancement feature extraction and matching of a fingerprint image. Int. J. Eng. Trends Technol., 13(4):184–190, 2014.
[10] Friedman, J. H. Greedy function approximation: a gradient boosting machine. Annals of statistics, pages 1189–1232, 2001.
[11] Gonzalez, R. C. and Woods, R. E. Image process-ing.Digital image processing, 2, 2007.
[12] Hammerle-Uhl, J., Pober, M., and Uhl, A. Sys-tematic evaluation methodology for fingerprint-image quality assessment techniques. In Informa-tion and CommunicaInforma-tion Technology, Electronics and Microelectronics (MIPRO), 2014 37th Inter-national Convention on, pages 1315–1319. IEEE, 2014.
[13] Hsu, Y. P., Chen, Y. L., Liao, C. F., Chen, X. Z., and Yu, C. W. Fast fingerprint feature extraction based on modified haar-like patterns using support
vector machine. In2017 IEEE International Con-ference on Consumer Electronics - Taiwan (ICCE-TW), pages 429–430, June 2017.
[14] Jain, A. K., Prabhakar, S., and Hong, L. A mul-tichannel approach to fingerprint classification.
IEEE transactions on pattern analysis and ma-chine intelligence, 21(4):348–359, 1999.
[15] Jain, A. K., Ross, A., and Prabhakar, S. An intro-duction to biometric recognition. IEEE Transac-tions on circuits and systems for video technology, 14(1):4–20, 2004.
[16] Kekre, H., Sarode, M. T. K., and Thepade, S. D. Image retrieval using color-texture features from dct on vq codevectors obtained by kekre?s fast codebook generation. ICGST-International Jour-nal on Graphics, Vision and Image Processing (GVIP), 9(5):1–8, 2009.
[17] Khanyile, N. P., Tapamo, J., and Dube, E. A com-parative study of fingerprint thinning algorithms. InInformation Security South Africa Conference, Hyatt Regency Hotel, Rosebank, Johannesburg, South Africa, August 15-17, 2011.
[18] Ko, K. User’s guide to nist biometric image soft-ware (nbis). NIST Interagency/Internal Report (NISTIR)-7392, 2007.
[19] Lafta, H. A. and Abbas, S. Effectiveness of ex-tended invariant moments in fingerprint analysis.
Asian Journal of Computer and Information Sys-tems, 1:78–89, 2013.
[20] Liaw, A. and Wiener, M. Classification and re-gression by randomforest. R news, 2(3):18–22, 2002.
[21] Maheswari, S. U. and Chandra, E. A review study on fingerprint classification algorithm used for fin-gerprint identification and recognition. IJCST, 3(1):739–45, 2012.
[22] Maio, D. and Maltoni, D. Direct gray-scale minutiae detection in fingerprints. IEEE trans-actions on pattern analysis and machine intelli-gence, 19(1):27–40, 1997.
[23] MARÁK, P. and HAMBALÍK, A. Automated
[24] Mohamed, S. M. and Nyongesa, H. Automatic fingerprint classification system using fuzzy neu-ral techniques. In Fuzzy Systems, 2002. FUZZ-IEEE’02. Proceedings of the 2002 IEEE Interna-tional Conference on, pages 358–362, 2002.
[25] Quinlan, J. R. et al. Bagging, boosting, and c4. 5. InAAAI/IAAI, Vol. 1, pages 725–730, 1996.
[26] Samatelo, J. L. A. Um sistema de classificacao de impressoes digitais. Master’s thesis, Universidade Federal do Espírito Santo, 2007.
[27] Sangeetha, S. and Radha, N. A new framework for iris and fingerprint recognition using svm clas-sification and extreme learning machine based on score level fusion. In 2013 7th International Conference on Intelligent Systems and Control (ISCO), pages 183–188, Jan 2013.
[28] Senior, A. A hidden markov model finger-print classifier. In Conference Record of the Thirty-First Asilomar Conference on Signals, Sys-tems and Computers (Cat. No.97CB36136), pages 306–310, Nov 1997.
[29] Simon-Zorita, D., Ortega-Garcia, J., Cruz-Llanas, S., and Gonzalez-Rodriguez, J. Minutiae extrac-tion scheme for fingerprint recogniextrac-tion systems. InImage Processing, 2001. Proceedings. 2001 In-ternational Conference on, volume 3, pages 254– 257. IEEE, 2001.
[30] Sudiro, S. A., Wardhani, I. P., Wardijono, B. A., and Handias, B. Fingerprint matching applica-tion using hardware based artificial neural net-work with matlab. In2017 5th International Con-ference on Electrical, Electronics and Information Engineering (ICEEIE), pages 66–70, Oct 2017.
[31] XGBoost. Xgboost parameters, 2018. URL: http://xgboost.readthedocs.io/en/latest/parameter.html.
[32] Yilmaz, O., Torun, M. U., and Akansu, A. N. A fast derivation of karhunen-loeve transform ker-nel for first-order autoregressive discrete process.
![Figure 1: Ridges and Valleys in a Fingerprint [19]](https://thumb-us.123doks.com/thumbv2/123dok_us/8363779.1672601/2.596.353.476.129.213/figure-ridges-valleys-fingerprint.webp)
![Figure 2: Five main types of fingerprint classification as defined byHenry [5]](https://thumb-us.123doks.com/thumbv2/123dok_us/8363779.1672601/3.596.69.292.123.468/figure-main-types-ngerprint-classication-dened-byhenry.webp)
![Figure 4: Thinned Fingerprint [17]](https://thumb-us.123doks.com/thumbv2/123dok_us/8363779.1672601/4.596.345.475.133.306/figure-thinned-fingerprint.webp)