Pharmacophore
(An International Research Journal)
Available online at http://www.pharmacophorejournal.com/
Original Research Paper
METHOD DEVELOPMENT AND VALIDATION FOR THE ESTIMATION OF
ORLISTAT BULK DRUG USING HYDROXYLAMINE SOLUTION
BY VISIBLE SPECTROSCOPY
Alekhya Prasanna*, Suman Pattanayak and K Padmalatha
Department of Pharmaceutical Analysis and Quality Assurance,
Vijaya Institute of Pharmaceutical Sciences for Women, NH-5, Enikepadu,
Vijayawada-521108, Andhra Pradesh, India
ABSTRACT
A simple, precise, accurate visible spectroscopic method was developed and validated for the determination of Orlistat by using Hydroxylamine reagent and ferric chloride solution in co-solvent ethanol and subsequently diluted with distilled water. At the λmax of 515 nm, it was proved linear in the range 5-15
μg/ml, and exhibit good correlation coefficient (R2 =0.9978) and excellent mean recovery (98.82-102.3% w/w). The developed method was validated for accuracy, precision, robustness, ruggedness according to ICH guidelines. All these parameters showed adaptability of the method for the quality control analysis of Orlistat API.
Keywords:
Orlistat, Hydroxylamine, Ferric chloride, Visible spectrophotometry, Validation.INTRODUCTION
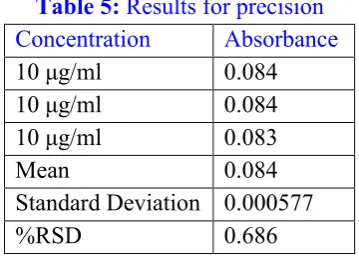
Orlistat is (S)-2-formylamino-4-methyl-pentanoic acid (S)-1-[[(2S, 3S)-3-hexyl-4-oxo-2-oxetanyl] methyl] dodecyl ester.1 It is a potent, specific, and long-acting inhibitor of gastrointestinal lipases. It exerts its therapeutic activity in the lumen of the stomach and small intestine by preventing the gastric and pancreatic lipases from hydrolyzing dietary fat, in the form of triglycerides, into absorbable. There was no reported method for estimation of Orlistat by Visible spectroscopy. This method is based on the formation of hydroxamic acid by the reaction of amide present in orlistat with hydroxyalamine in alkaline medium and a colour developing step involving the reaction of ferric ion with the hydroxamic acids in acidi medium.2 The absorbances of the final dilutions were measured at 515 nm because of formed iron complexes.3 Literature survey revealed that several methods like UV spectrophotometry4,5,6 and HPLC7,8 have been reported. The aim for undertaking the present
work is to develop a visible spectroscopic method for the estimation of Orlistat based on the presence of amide functional group.
EXPERIMENTAL
Materials and Methods Instrument
UV-Visible Spectrophotometer (PG instruments T60), UV-Visible Spectrophotometer (Lab India, 3000+), ‘Fast Clean’ Ultra sonicator.
Chemicals Required
Orlistat drug sample was supplied as gift sample by Murali Krishna Pharma Pvt. Ltd., Pune, Maharashtra and all other chemicals like Hydroxylamine, conc. Hydrochloric acid, ferric chloride, sodium chloride were used which are Purchased from E. Merck (India) Ltd.
Preparation of Reagents
2 N Hydroxylamine HCL reagent: Weigh accurately about 6 gm of hydroxylamine HCl and dissolve in distilled water and sonicate it for 20 min and makeup to volume 50 ml with distilled water. Then mix the sodium hydroxide solution and hydroxylamine HCL solution.
0.74 N Ferric chloride solution in 0.1 N HCL: Weigh accurately 1.2 gm of FeCl3 and dissolve in
10 ml 0.1N HCL solution.
Procedure for Standard Solution and Standard Curve
Weigh accurately 50 mg of Orlistat and dissolve in 50 ml of ethanol (1000 µg/ml). From that pipette out 0.5 ml into a 10 ml volumetric flask and add 2 ml of Hydroxylamine reagent and keep for 3 hrs at 500C. After the reaction time add 1 ml Fecl3 and 1 ml 3.5 N HCL solution and makeup
the volume up to 10 ml with distilled water (50 µg/ml). From this solution prepare serial dilutions of 5, 7.5, 10, 12.5, 15 µg/ml by pipetting out 1 ml, 1.5 ml, 2 ml, 2.5 ml and 3 ml into 5 different 10 ml volumetric flasks respectively and makeup the volume to 10ml with distilled water. Then measure the absorbances of 5, 7.5, 10, 12.5, 15 µg/ml solutions at 515 nm.
Assay Procedure
Weigh accurately 50 mg of Orlistat and dissolve in 50 ml of ethanol (1000 µg/ml). From that pipette out 0.5 ml into a 10 ml volumetric flask and add 2 ml of Hydroxylamine reagent and keep for 3 hrs at 500C. After the reaction time add 1 ml Fecl3 and 1 ml 3.5 N HCL solution and makeup
the volume up to 10 ml with distilled water (50 µg/ml). From this solution pipette out 2 ml solution and makeup the volume to 10 ml with distilled water. Then measure the absorbances at 515 nm. Calculate the content of Orlistat from the data derived from calibration curve.
METHOD VALIDATION
9The method was validated for specificity, precision, linearity, accuracy, LOD, LOQ, ruggedness and robustness by the following procedures.
Linearity
The linearity of calibration curve (absorbance vs. concentration) for the drug solution was checked over the concentration ranges of about 5-15 µg/ml for Orlistat. The correlation coefficient and equation of the regression analysis were obtained. The linearity data was plotted.
Precision
Three concentrations of 10 μg/ml were prepared by transferring 2 ml from the 50 μg/ml solution into 10 ml volumetric flask and make up the volumes to the mark with distilled water and the absorbances were read at 515 nm. The % RSD was calculated and the %RSD < 2%.
% RSD = Amount found /Amount added*100 Accuracy
Recovery studies were carried out by pure drug solution at three different concentration levels (50, 100 and 150 %). From the 50 μg/ml solution pipette out 1 ml, 2 ml, 3 ml into three different 10ml volumetric flasks and make up the volume up to the mark with distilled water in order to get 50, 100, 150% concentration levels. These solutions were analyzed by using distilled water as blank. The amount of drug was estimated by measuring absorbance at different spiked levels. The recovery was verified by estimation of drug in triplicate.
% Recovery = Standard deviation / mean of measurements*100
Limit of Detection and Limit of Quantification The LOD and LOQ of Orlistat were determined by using standard deviation of the response and slope approach as defined in International Conference on Harmonization (ICH) guidelines. LOD and LOQ values were calculated using the relation,
LOD=3.3δ /S LOQ=10 δ /S Robustness
volume makeup etc. The % RSD values of the results corresponding to the absorbance were expressed.
Ruggedness
The ruggedness of an analytical method was the degree of reproducibility of test results obtained by the analysis of the same samples under a
variety of test conditions like different analysts, different laboratory, different instrument, different lots of chemical etc. The sample solution of 10 μg/ml was prepared in triplicate and the absorbances were measured. The % RSD of the results analogous to the absorbances were expressed.
RESULTS
Table1: Results for calibration curve Concentration Absorbance
5 μg/ml 0.0045 7.5 μg/ml 0.062 10 μg/ml 0.084 12.5 μg/ml 0.099 15 μg/ml 0.118
Table 2: Parameters for calibration curve
Parameter Observations
Calibration curve Linear
Expression Y=mX+c
Factor (m) 0.0073
Factor(c) 0.0084
Correlation coefficient(r2) 0.9975
Limit of Detection and Limit of Quantification LOD=3.3 σ/slope
Where, σ = standard deviation of blank responses S = slope of calibration curve for linearity
Table 3: Blank responses
Concentration Responses
0 μg/ml 0.049
0 μg/ml 0.049
0 μg/ml 0.048
Standard deviation 0.000577
σ = 0.000577 S = 0.0073
LOD = 3.3 * 0.000577 / 0.0073 = 0.261 μg/ml LOQ = 10 σ/slope
Table 4: Blank responses
Concentration Responses
0 μg/ml 0.049
0 μg/ml 0.049
0 μg/ml 0.048
Standard deviation 0.000577 σ = 0.000577
S = 0.0073
LOQ = 10 * 0.000577 / 0.0073 = 0.791 μg/ml
Precision
Table 5: Results for precision
Concentration Absorbance
10 μg/ml 0.084 10 μg/ml 0.084 10 μg/ml 0.083
Mean 0.084
Standard Deviation 0.000577
%RSD 0.686
Accuracy
Table 7: Recovery studies for Orlistat
Concentration Absorbance Mean Amount found % Recovery
50%(5 μg/ml) 0.046 0.045 0.045 0.045 5.01 100.2 100%(10 μg/ml 0.082 0.083 0.082 0.082 10.08 100.8 150%(15 μg/ml) 0.120 0.120 0.119 0.120 15.2 101.3
Robustness
Table 8: Change in wavelength
Concentration Wavelength Absorbance
10 μg/ml 514nm 0.095
10 μg/ml 515nm 0.094
10 μg/ml 516nm 0.094
Mean 0.094
Standard Deviation 0.000577
%RSD 0.163
Table 9: Change in volume added
Volume added Absorbance Mean 1.9ml 0.088 0.088 0.088 0.088 2ml 0.088 0.090 0.089 0.089 2.1ml 0.090 0.091 0.091 0.091
Mean 0.089
Standard deviation 0.001528
Table 10: Ruggedness
Analyst-1 Analyst-2
Concentration Absorbance Absorbance
10 μg/ml 0.089 0.086 10 μg/ml 0.088 0.085 10 μg/ml 0.088 0.086 % RSD 1.7807
Figure 1: Structure of Orlistat
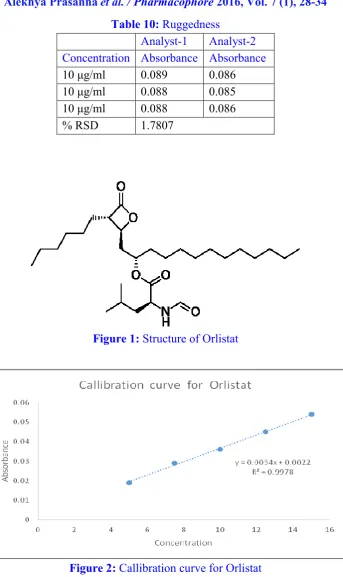
Figure 2: Callibration curve for Orlistat
DISCUSSION
A simple, precise and accurate visible spectrophotometric method has been developed and validated for estimation of Orlistat. The proposed method was validated as per ICH Q2 (R1) guidelines for precision, linearity, accuracy and recovery.
Linearity
The absorbance were observed from 5 to 15 μg/ml were shown in Table 1. Linearity was obtained between 5 to 15 μg/ml. Calibration graph was
plotted for concentration and absorbance. The equation of calibration curve Figure 2 obtained was y = 0.0073x + 0.0084. The correlation coefficient (r) was 0.9975 shown in Table 2.
Precision
Three determinations of 10 μg/ml was prepared and the corresponding absorbances were observed Table 5. The % RSD was found to be 0.686.
Accuracy of the method recovery was performed by standard addition method. The recovery was performed at three levels 50%, 100% and 150% of standard Orlistat. Solutions were analyzed and percentage recovery was found between100.2 to 101.3 %w/v and was shown in Table 7.
Limit of Detection and Limit of Quantification Limit of Detection and Limit of Quantification were found to be LOD = 0.261 μg/ml, LOD = 0.791 μg/ml respectively.
Robustness
Triplicate of 10 μg/ml was prepared at different experimental conditions like change in sample concentration and change in wavelength and their corresponding absorbances were noted. The % RSD was found to be 1.71, 0.613 respectively for the variable parameter like change in added volume, change in wavelength.
Ruggedness
Triplicate of 10 μg/ml was prepared by different analysts and their corresponding absorbance were noted. The % RSD was found to be 1.7807 for different Analyst.
Conclusion: A validated Visible spectroscopic method has been developed for the determination of Orlistat in bulk drug. The developed method is precise, accurate, robust and specific.
ACKNOWLEDGEMENT
Authors are great full to management of SRK Foundation Vijayawada, and Vijaya Institute of Pharmaceutical Sciences for Women for providing the facilities and continuous encouragement for conducting the research work.
REFERENCES
1. Heckelman, A; Neil, O and Smith, M J (2001), “The Merck Index : An Encyclopaedia of Chemicals, Drugs and Biologicals”, White House Station, New Jersey, 1228.
2. Einar, Brochmann; Hanffen, hanssen and Takery Higuchi, ‘Pharmaceutical
Analysis’, CBS Publications &
Distributors, New Delhi, 547-550.
3. FE Critchfield, “Organic Functional Group Analysis”, Vol-8, 53-54.
4. Hemant Kumar, T; Srinivasa Rao, Y; Teja Lakshmi, G and Vara Prasada Rao, K (2015), “Visible Spectrophotometric Methods for the Estimation of Orlistat in Bulk and Pharmaceutical Dosage Form”, J. Pharm. Sci. & Res., Vol. 7 (3), 155-158. 5. Dhanalakshmi, K; Nagarjuna Reddy, G;
Priyanka, gaddam and Sreenivasa, S (2013), “Estimation of Orlistat by various Spectrophotometric Techniques”, Indo American Journal of Pharmaceutical Research, Vol 3, Issue 7, 5212-5220. 6. Hemant Kumar, T; Manasa Reddy, K;
Prasanna Kumar, R and Rishika, D (2011), “International Journal of Science and Research” Vol. 2 (9), 2469-2471.
7. Ghias, L; Haririan, I; Mohammadia, A; Rezanour, N and Walker, RB (2006), “A stability indicating high performance liquid chromatographic assay for the determination of Orlistat in capsules”,
Journal of Chromatography A, 1116 153–
157.
8. Basavasewara Rao, MV; Muralidhar, P; Reddy, BCK and Srinivas Rao, T (2008), “Reverse Phase High Performance Liquid Chromatographic determination of Orlistat Pellets 50.0%”, Rasayan J. Chem, Vol.1, No.3, 636-638.
9. “ICH Harmonized Tripartite Guidelines”, Validation of analytical procedures: text & methodology, Q2 (R), 2005.
Correspondence Author:
Alekhya Prasanna