Original Research Article
Metabolic syndrome and its socio demographic and behavioral
correlates: a cross sectional study among adult patients attending
medicine outpatient department in a tertiary care hospital, West Bengal
Sanjoy Kumar Kunti
1, Santanu Ghosh
2*, Amrita Samanta
3, Indranil Chakraborty
4INTRODUCTION
Abnormal glucose metabolism, hypertension, obesity and dyslipidaemia together constitute "metabolic syndrome" (MS) which is now a major public health challenge to the health systems in both developed and developing countries. MS is a pre-condition of two constantly rising
major clinical entities: cardiovascular diseases (CVD) and type 2 diabetes mellitus, which are major contributors to morbidity and mortality globally. The National Health and Nutrition Examination Survey-III (NHANES) in USA (2003) showed that people with diabetes and MS had the highest prevalence of coronary heart diseases.1 The West Scotland Coronary Artery
ABSTRACT
Background: Metabolic syndrome (MS) is a pre-condition for cardiovascular diseases and type 2 diabetes mellitus (T2DM) which are major contributors to morbidity and mortality worldwide.
Methods: The cross-sectional, observational study was conducted to estimate the proportion of MS and to explore crucial risk factors for MS among adult patients attending medicine OPD in a tertiary care hospital in West Bengal. The estimated final sample size was 315. Baseline socio demographic information and information on risk factors for MS, such as dietary habit, physical activity status, substance use, intake of related drugs, and presence of co-morbidities were collected by interviewing the patients with the help of a predesigned, pretested, structured schedule. Anthropometric measurements such as weight, height, waist circumference recordings were taken, and blood pressure was measured.
Results: About 64% of the final study population (210/330) suffered from MS. On bivariate analysis, significant association between female gender (df=1, Pearson chi-square=5.06, p=0.024), weekly frequency of consumption of junk foods (df=3, Pearson chi-square=10.40, p=0.015) and obesity according to BMI (independent samples Mann-Whitney U test, p=0.010) at 5% level of significance were observed. Performing binary logistic regression analysis, obesity according to BMI (AOR=1.388, 95% CI=1.064-1.810) was found to be significant.
Conclusions: Majority of the population suffered from MS who were mostly female, obese and consumers of junk foods. Appropriate interventional measures in terms of life style modification both at community and at tertiary care level are the need of the hour.
Keywords: ATP-III, BMI, CVD, Diabetes, Obesity, Metabolic syndrome
Department of Biochemistry, 1Raiganj Government Medical College, Raiganj, North Dinajpur, 4College of Medicine and Sagore Dutta Hospital, Kolkata, West Bengal, India
Department of Community Medicine, 2College of Medicine and Sagore Dutta Hospital, 3RG Kar Medical College, Kolkata, West Bengal, India
Received: 23 January 2019
Revised: 04 March 2019
Accepted: 05 March 2019
*Correspondence:
Dr. Santanu Ghosh,
E-mail: [email protected]
Copyright: © the author(s), publisher and licensee Medip Academy. This is an open-access article distributed under the terms of the Creative Commons Attribution Non-Commercial License, which permits unrestricted non-commercial use, distribution, and reproduction in any medium, provided the original work is properly cited.
Prevention Study (WOSCOPS) found that the risk of CVD and diabetes increased with the number of MS risk factors.2 However, there exists complex interaction process among various components and their role to the pathogenesis of diabetes and cardiovascular complications. Moreover, deranged vascular homeostasis and insulin resistance have been associated with lipid abnormality.3 A number of definitions and criteria have been proposed in last two decades by various authorities such as World Health Organization (WHO), European Group for Study of Insulin Resistance (EGIS), American Association of Clinical Endocrinologists (AACE), International Diabetes Federation (IDF) and National Cholesterol Education Program Adult Treatment Panel III (NCEP ATP III). Researchers worldwide prefer using the NCEP ATP III definition because it is relatively simple and clinically applicable.4
South Asians denote residents of India, Pakistan, Bangladesh, Sri Lanka, Nepal, Bhutan and Maldives constituting about 24% of the world’s population.5
South Asians are increasingly becoming more affluent with economic liberalization. Better purchasing power is leading to increased consumption of diets high in saturated fats, cholesterol and refined carbohydrates and low in polyunsaturated fatty acids and fiber over last three decades among South Asian population. Transnational food companies are rapidly grabbing the huge market by opening their outlets of packaged foods. It is to be remembered that along with processed non-traditional fast foods that contribute to unhygienic diets, some of the locally made ‘fast foods’ sold by street vendors in several developing countries are equally unhealthy. These food items contain high amount of atherogenic trans-fatty acids due to deep-frying using low cost and widely available partially hydrogenated vegetable oils.6
Several studies all over India have reported a high prevalence of MS or its individual components like impaired glucose tolerance, obesity and hypertension.7-10
Recent results of National Family Health Survey-4 (NFHS-4) have shown the rise of vital risk factors such as obesity, high blood glucose and high blood pressure all over the country.11 A persistent high prevalence and increasing secular trend of non-HDL cholesterol and triglycerides were observed over 8-year period in Jaipur Heart Watch-5 study.12 Therefore, it can be concluded that MS is also on the rise. Undoubtedly, it will be immensely helpful if the risk factors of MS especially the modifiable ones that are amenable to intervention can be determined to prevent type 2 diabetes and cardiovascular complications that require costlier, resource intense and expert interventions particularly in a resource constraint country like India. It will also help us understand the complex processes involved in pathogenesis of MS. However, information on prevalence and its socio
demographic and behaviour related correlates in West Bengal are scarce.
College of Medicine and Sagore Dutta Hospital (CMSDH) is a government medical college located at Kamarhati municipality in the district of North 24 Parganas in West Bengal and caters population mainly from Kamarhati and adjacent municipalities such as Khardah, Titagarh and Panihati. The present study was conducted to estimate the proportion of MS among adult patients attending medicine OPD at CMSDH, and to determine the sociodemographic and behavioural correlates of MS among the study population.
METHODS
The present study was a cross-sectional, hospital based, observational study conducted at College of Medicine and Sagore Dutta Hospital (CMSDH), Kamarhati, Kolkata. Duration of Study was three months (September 2016-November 2016). Male and Female patients aged 18 years or more attending medicine OPD were selected as the study population. All eligible patients who provided voluntary consent to participate were included in the study whereas Indoor patients, pregnant females, severely ill patients and patients unable to provide consent due to physical or psychological impairment were excluded from the study.
Taking prevalence of metabolic syndrome as 25%, the estimated sample size was 300 with 20% relative precision.12 Considering non-response rate as 5%, the final sample size was 315. According to records kept in the medicine OPD, average number of patients attending medicine OPD is 250. Therefore, the number of patients in two weeks (14 working days) would be 3500. Adopting systematic random sampling method, starting from a random number between 1-10, every 10th patient was selected. During the 14 days’ period of data collection, 330 patients were interviewed. Thus, the final study population was 330.
waist circumference (WC) were takenand blood pressure was recorded.
WC was measured by non-stretchable measuring tape at the level halfway between the iliac crest and the costal margin in the mid-axillary line after exhaling with the subject in standing position in minimum clothes. Two consecutive recordings were made for each site to the nearest 0.5 cm on a horizontal plane without compression of the skin. The mean of the two sets of values was used.13
Body weight was measured (to the nearest 0.5 kg) with the subject standing motionless and looking straight in anatomical position on a standardized adult digital weighing scale.13
Height was measured by stadiometer (to the nearest 0.5 cm) with the subject standing in an erect position against the vertical scale and with the head positioned so that the top of the external auditory meatus was in level with the inferior margin of the bony orbit.13
Blood pressure was recorded with aneroid sphygmomanometer in the right arm, in the sitting position. Three readings were taken 3 minutes apart and the average of readings was recorded.13
Estimation of fasting blood glucose was done by glucose oxidase peroxidase (GOD-POD) method.14 Triglyceride and HDL-C were estimated by CHOD-PAP method,and direct enzymatic method respectively.15,16
Operational definitions
Metabolic syndrome17,18
Three out of the following five criteria have to be abnormal for diagnosis.
Elevated WC: The widely accepted cut-offs for Asians are 90 cm for men and 80 cm for Females have been taken.
Elevated triglycerides: 150 mg/dl.
Reduced HDL: Men ≤40 mg/dl, females ≤50 mg/dl
Elevated blood pressure: 130/85 mmHg or use of medication for previously diagnosed hypertension.
Elevated fasting glucose: 100 mg/dl or use of medication for hyperglycaemia.
Minimum physical activity status
Minimum 30 minutes of moderate intensity physical activity (brisk walking/ stair climbing/jogging/cycling/ swimming/ treadmill) at least 5 days a week.19,20
Brisk walking
Walking at an intensity wherein an individual finds speaking difficult but not impossible.18
Dietary intake:12,21,22
Type of cooking oil
Green vegetables and fruit intake of >3 servings per day were considered adequate.
Intake of extra salt in diet.
Frequency of intake of junk foods (soft drinks, ice creams and sweets) per week.
Current smokers
Persons who smoked at least once in last month.21,22
Current drinker
Persons who consumed one or more drinks of any type of alcohol in the year preceding the survey.21,22
The schedule was prepared in English. Then it was translated in Bengali and was retranslated in English to check consistency in language. The face and content validity of the schedule were assessed after consultation with three public health experts and one endocrinologist. A pilot study was conducted on 20 adult OPD patients at medicine OPD to bring about necessary modification, if any, in the schedule and other study tools. After necessary modification of the study tools, patients attending medicine OPD were asked for giving written informed consent to participate in the study.
After getting informed consent, data collection was carried out. Data was collated, analysed and were presented in the form of tables and diagrams.
Statistical analyses
Statistical analyses were performed using SPSS Version 20.0 (SPSS, Chicago, IL, USA). Appropriate bivariate analyses were performed to determine association between presence of MS and sociodemographic and behavioural variables. For qualitative variables on nominal scale, Pearson chi-square test was performed and for qualitative variables on interval scale and quantitative variables having skewed distribution, appropriate non-parametric tests such as Mann-Whitney U test were performed taking 0.05 as level of significance. Variables found significant by bivariate analysis as well as biologically relevant variables were further analyzed by simultaneous binary logistic regression model.
probability of significance of Wald statistic was considered 0.05.
RESULTS
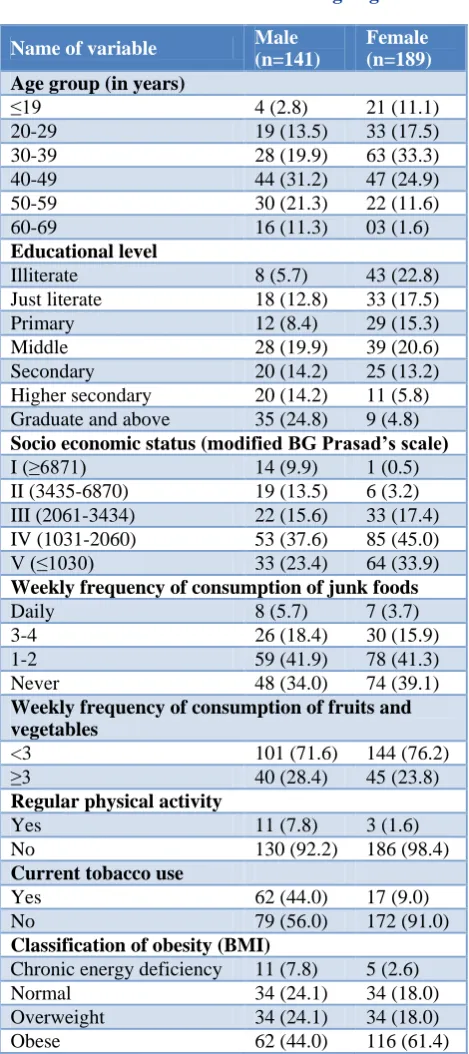
About 64% of the population (210/330) suffered from MS (Figure 1). Prevalence was more among females (68.8%) than males (56.7%) (p=0.024). Female preponderance in the study population was observed (57.3%). Mean age in years of males (53.2±12.8) were more than that of females (45.0±11.7). More than half of the population belonged to 30-49 years age group. Most of the males and females belonged to age groups of 40-49 (31.2%) and 30-39 (33.3%) respectively. More than 3/4th of the population was Hindu. More than 70% belonged to general caste whereas about 16% belonged to other backward classes (OBCs). Bengali was the mother tongue of more than 80% of the population. Almost 95% population resided at urban areas. About 33% of the population had middle or primary level of education whereas more than 30% were illiterate or just literate. Most of the males (20%) and females (21%) had middle level of education (Table 1). Majority of them were married (86%) whereas about 4% were divorced. Almost 50% of the population were homemaker because of female majority. About 13% were labourers followed by business-persons (11%). Unemployed people constituted about 4% whereas about 2% were professionals. Nearly 60% of the population belonged to nuclear families. According to Modified BG Prasad socio economic status scale [AICPI (IW) =301 (August 2018)], more than 70% of the population belonged to bottom two (IV and V) classes. About 38% of males and about 45% of females belonged to class IV. About 48% of the population did not provide any history regarding relatives suffering from NCDs. About 18% of them had one or more relatives suffering from hypertension followed by diabetes (11.2%) and CHD (6.1%). It was observed that 34% of males and 45.5% of females were not diagnosed with any NCD. Most of the males (26%) and females (27%) suffered from hypertension whereas 11% of males and 8% of females suffered from both diabetes and hypertension.
Per capita monthly oil consumption of family was more than 1.6 litres in more than 90% of population. More than 70% of the population consumed mustard oil as major source of cooking oil whereas more than 20% preferred sunflower oil. Majority of the males (42%) and Females (41%) indulged in junk foods for 1-2 times every week whereas less than 5% of them took junk foods daily. However, 37% of them never took junk foods.
Only 1/4th of the population consumed fruits and vegetables for three or more times per day, the proportion being slightly higher among males (28%) than among females (24%). Though more than 50% of the population never took extra salt in diet, about 25% of the same always did so.
Table 1: Distribution of socio demographic and behavior related variables according to gender.
Name of variable Male
(n=141)
Female (n=189)
Age group (in years)
≤19 4 (2.8) 21 (11.1)
20-29 19 (13.5) 33 (17.5)
30-39 28 (19.9) 63 (33.3)
40-49 44 (31.2) 47 (24.9)
50-59 30 (21.3) 22 (11.6)
60-69 16 (11.3) 03 (1.6)
Educational level
Illiterate 8 (5.7) 43 (22.8)
Just literate 18 (12.8) 33 (17.5)
Primary 12 (8.4) 29 (15.3)
Middle 28 (19.9) 39 (20.6)
Secondary 20 (14.2) 25 (13.2)
Higher secondary 20 (14.2) 11 (5.8) Graduate and above 35 (24.8) 9 (4.8)
Socio economic status (modified BG Prasad’s scale)
I (≥6871) 14 (9.9) 1 (0.5)
II (3435-6870) 19 (13.5) 6 (3.2) III (2061-3434) 22 (15.6) 33 (17.4) IV (1031-2060) 53 (37.6) 85 (45.0)
V (≤1030) 33 (23.4) 64 (33.9)
Weekly frequency of consumption of junk foods
Daily 8 (5.7) 7 (3.7)
3-4 26 (18.4) 30 (15.9)
1-2 59 (41.9) 78 (41.3)
Never 48 (34.0) 74 (39.1)
Weekly frequency of consumption of fruits and vegetables
<3 101 (71.6) 144 (76.2)
≥3 40 (28.4) 45 (23.8)
Regular physical activity
Yes 11 (7.8) 3 (1.6)
No 130 (92.2) 186 (98.4)
Current tobacco use
Yes 62 (44.0) 17 (9.0)
No 79 (56.0) 172 (91.0)
Classification of obesity (BMI)
Chronic energy deficiency 11 (7.8) 5 (2.6)
Normal 34 (24.1) 34 (18.0)
Overweight 34 (24.1) 34 (18.0)
Obese 62 (44.0) 116 (61.4)
tobacco users, about 58% had been using it for last 11-20 years and about 6% had the history of tobacco use for ≥30 years. Among 24 current drinkers, only 8.3% took more than seven drinks weekly. According to the WHO classification of BMI for South East Asian population,
about 54% of the population were obese and about 21% of them were overweight. On the other hand, about 5% suffered from chronic energy deficiency. Proportion of obesity was higher in females (61%) than among males (44%) (Table 1).
Table 2: Distribution of anthropometric and biochemical characteristics according to gender.
Variable Male (mean±SE) Female (mean±SE) P value
Waste circumference (cm) 85.9±1.3 93.7±0.8 0.000
HDL-cholesterol (mg/dl) 47.7±11.5 51.0±9.6 0.006
Triglyceride (mg/dl) 152.3±7.0 158.3±5.8 0.514
Fasting plasma glucose (mg/dl) 121.2±3.9 117.16±3.5 0.438
Mean SBP (mmHg) 133.4±1.5 133.4±1.4 0.993
Mean DBP (mmHg) 79.6±0.7 81.0±0.7 0.187
Mean BMI (kg/m2) 29.0±1.4 24.8±0.4 0.003
Table 3: Socio demographic and behaviour related correlates of metabolic syndrome.
Name of variable Frequency (%) P value
*Gender
Male 80 (56.7)
0.024
Female 130 (68.8)
Age group (in years)
≤40 54 (57.4)
0.140
>40 156 (66.1)
Educational level
Illiterate 41 (80.4)
0.136
Just literate 28 (54.9)
Primary 24 (58.5)
Middle 47 (70.1)
Secondary 25 (55.6)
Higher secondary 18 (58.1)
Graduate and above 27 (61.4)
*Weekly frequency of consumption of junk foods
Daily 4 (26.7)
0.015
3-4 40 (71.4)
1-2 87 (63.5)
Never 79 (64.8)
Per capita monthly oil consumption of family (ml)
800-1199 7 (53.8)
0.197
1200-1599 3 (42.9)
≥1600 200 (64.5)
Weekly frequency of consumption of fruits and vegetables
<3 163 (65.7)
0.170
≥3 47 (57.3)
Regular physical activity
Yes 199 (63.0)
0.459
No 11 (78.6)
Current tobacco use
Yes 163 (64.9)
0.457
No 47 (59.5)
*Classification of obesity (BMI)
Chronic energy deficiency 7 (43.8)
0.010
Normal 35 (51.5)
Overweight 46 (67.6)
Obese 122 (8.5)
Upon considering the individual criteria for MS, significant difference in waste circumference was observed between males and females (85.9±1.3 vs. 93.7±0.8, p=0.000). HDL-cholesterol, a protective factor, was also significantly higher in females (51.0±9.6) than males (47.7±11.5) (p=0.006) (Table 2).
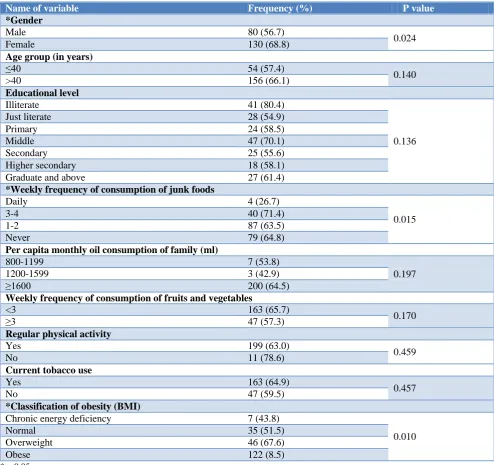
On bivariate analysis for socio demographic and behavioural variables with presence of MS, significant association between gender (df=1, Pearson chi-square=5.06, p=0.024), weekly frequency of consumption of junk foods (df=3, Pearson chi-square=10.40, p=0.015) and obesity according to BMI (independent samples
Mann-Whitney U test, p=0.010) at 5% level of significance were observed (Table 2). No significant association was found with age group, educational status, socio economic status; per capita monthly oil consumption, daily minimum physical activity status, tobacco and alcohol use (Table 3).
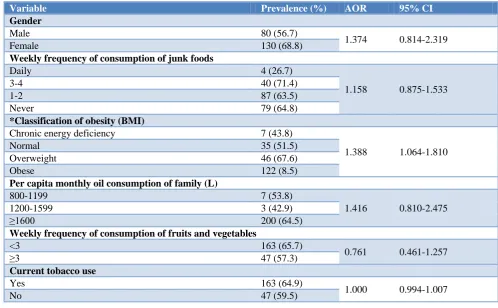
Performing binary logistic regression analysis with selected socio demographic and behavioural variables, only obesity according to BMI (AOR=1.388, 95% CI=1.064-1.810) was found to be significant explaining the increase in odds of having MS by approximately one and a quarter due to one unit increase in BMI classification (Table 4).
Table 4: Results of binary logistic regression analysis for correlates of metabolic syndrome.
Variable Prevalence (%) AOR 95% CI
Gender
Male 80 (56.7)
1.374 0.814-2.319
Female 130 (68.8)
Weekly frequency of consumption of junk foods
Daily 4 (26.7)
1.158 0.875-1.533
3-4 40 (71.4)
1-2 87 (63.5)
Never 79 (64.8)
*Classification of obesity (BMI)
Chronic energy deficiency 7 (43.8)
1.388 1.064-1.810
Normal 35 (51.5)
Overweight 46 (67.6)
Obese 122 (8.5)
Per capita monthly oil consumption of family (L)
800-1199 7 (53.8)
1.416 0.810-2.475
1200-1599 3 (42.9)
≥1600 200 (64.5)
Weekly frequency of consumption of fruits and vegetables
<3 163 (65.7)
0.761 0.461-1.257
≥3 47 (57.3)
Current tobacco use
Yes 163 (64.9)
1.000 0.994-1.007
No 47 (59.5)
Figure 1: Distribution of population according to metabolic syndrome.
DISCUSSION
In last two decades, the prevalence of MS has been increased in developing countries.22 The overall prevalence of MS varies according to the socio-cultural factors, genetic characteristics, gender, age, geographic location, diagnostic criteria used and other associated variables.23 The present study was conducted to estimate the proportion of MS and its correlates. In the present study, overall proportion of MS was 64%. Proportion of MS among males and females were 57% and 69% respectively. In Jaipur Heart Watch-5 study conducted by Gupta et al among a population of 739, prevalence of MS among males and females were 25% and 22% respectively.12 Another study conducted by Gupta et al among 6198 adult urban people across 11 cities in India 63.6
36.4
reported prevalence of 32% and 40% among males and females respectively.21 Sinha et al. found 30% prevalence on 300 females from South Delhi.24 Deshmukh et al reported prevalence of MS for 18% and 17% for males and females respectively in rural Wardha, Sewagram.25 Sarkar et al found 30-50% prevalence in a study conducted on 305 adult Bhutias in sub-Himalayan areas.10 Dutra et al reported an overall prevalence of 32% among 2130 people of age 18 years or more in Central Brazil.26 The fact that the population were patients themselves and lifestyle and behaviour related risk factors are more prevalent in West Bengal are the probable explanations for such high proportion of MS found in the present study.27 The fact that more than 90% of families had per capita oil intake of above 1.6 litres also corroborated the findings of high fat intake (male; 73%, female: 69%) of Jaipur study.12 Present study found low fruits and vegetable intake comparable to Jaipur study (male: 70%, female: 76%) and eleven city study (male: 75%, female: 71%).12,21 Low physical activity has been reported as a significant risk factor for MS from various studies. In a cross-sectional study conducted in Kolkata among 448 adult males and females of more than 30 years of age to determine the interaction of physical activity level (PAL) and MS, it was observed that the prevalence of MS was inversely proportional to PAL.28 In a cross-sectional study conducted in 2014 in by Vaidya et al Kathmandu, Nepal on 640 adults, it was observed that about 43% of population performed inadequate daily physical activity.29 Low physical activity reported in present study were also comparable with that of Jaipur study (male: 70%, female: 52%) and eleven city study (male: 39%, female: 46%).12,21 Prevalence of smoking was 12% among men in Jaipur study.21
Present study reported smoking among more than 40% of men. Obesity and high fat diet have been implicated as important risk factors for MS.
Wardha study reported visceral adiposity loaded by WC, TG and VLDL over simple abdominal obesity by principal factor analysis as the major attributing factor (28%) followed by cholesterol factor (20%) and blood pressure (20%).25 Jaipur study had also shown high fat diet and obesity as significant risk factors (p<0.05).12 Dutra et al reported high WC (AOR=5.02, 95% CI=3.77-6.69) as a significant factor.26 Present study has found obesity according to BMI as significant risk factor. Again, more than half of the population were obese and about 1/5th of them were overweight. Present study has shown mean WC of females (94 cm) was much higher than the cut-off value (80 cm). According to Wardha study, mean WC (cm) were 76.8±0.86 and 75.0±1.04 in males and females respectively.25 In Jaipur study, about 46% of males and 51% of females were obese.12 Eleven city study reported 35% of males and 51% of females whereas Jaipur study revealed 12% of males and 27% of females having waste circumference above cut-off value.12,21 Present study showed mean SBP and DBP at pre-hypertensive range in both genders.
It is similar to Wardha study where mean SBP and DBP (mmHg) were approximately 130 and 83 in both genders and prevalence of hypertension were about 31% and 38% among men and women respectively.25 In eleven city study, 32.5% of males and 30% of females were hypertensive.21 Brazil study showed hypertension as a significant risk factor (AOR=5.10, 95% CI=3.17-8.22).26 Mean HDL level were in normal range in the present study in both genders whereas Wardha study reported low HDL levels in both genders (male: 40.9; female: 43) and reported low HDL level among 50% of men and 70% of women.25 Such variation may be explained by dietary habits and ethnicity factors. Jaipur study found low HDL among 34% of males and 35% of females.12 Eleven city study showed 34% of men and 35% of females had low HDL cholesterol.21 In a study conducted by Abdulaziz et al among 4490 Saudi population of >15 years age, prevalence of dyslipidemia was in the range 20-40%. Prevalence of high triglyceride level and total cholesterol were about 44% and 50% respectively.30 Mean fasting plasma glucose levels were in the range of impaired fasting glucose (IFG) in both genders in the present study.
However, Wardha study showed mean fasting blood glucose levels about 89.9±1.5 mg/dl and 90.6±2.3 mg/dl in males and females respectively.25 Eleven city study reported prevalences of diabetes as 16.7% and 14.4% respectively in males and females.21 Such difference may be attributed to high prevalence of IFG and type 2 DM in urban areas of West Bengal. In the present study, Serum TG levels were slightly higher in both genders above the cut-off value of 150 mg/dl. Wardha study found TG levels low in both genders (male: 133.9±6.4; female: 125.2±6.8).
Higher prevalence of total cholesterol and TG were significantly more among elderly people, and illiterates.25 In eleven city study, 41% of men and 31.5 % of Females had high TG levels.21 Again, high TG found in present study can be attributed to high prevalence of type 2 DM in West Bengal.
medical records could not always be possible mostly due to unavailability of such records.
In conclusion,More than sixty per cent of the population was found to suffer from MS, more so among females. Obesity has been found to be a significant risk factor of MS along with gender and intake of junk foods. An interventional blueprint for the community that they represent should be prepared from the results of this study to take prior cost-effective remedial steps to prevent the sequelae of MS. At the community level, both formal and informal leaders including local political representatives such as Chairpersons of Kamarhati and adjacent Municipalities, local Members of Legislative Assembly (MLAs) and Member of Parliament (MP) should be made aware of the study results. Urban primary health centres of local municipalities should organize camps, group discussion and meeting among community members especially among women homemakers to discuss about MS and its risk factors and about the necessity of adoption of protective dietary and behavioural risk factors. Important informal organizations such as local clubs, NGOs, self-help groups should also be made actively involved. Legal measures to curb the escalating trend of consumption of junk foods such as ban on illegal street food stalls can be enforced. At the tertiary care level, separate counselling room for patients diagnosed with NCDs should be commenced to impart education on lifestyle modification by trained counsellors and physicians. Finally, National Programme for Prevention and Control of Cancer, Diabetes, Cardiovascular Diseases and Stroke (NPCDCS) and National Health Mission (NHM) should be strongly implemented with better coverage and robust quality of care.
ACKNOWLEDGEMENTS
We acknowledge Prof. Hasi Dasgupta, Principal, College of Medicine and Sagore Dutta Hospital for providing kind permission to conduct the study.
Funding: No funding sources Conflict of interest: None declared
Ethical approval: The study was approved by the Institutional Ethics Committee
REFERENCES
1. Alexander CM, Landsman PB, Teutsch SM, Haffner SM. Third national health and nutrition examination survey (NHANES III), national cholesterol education program (NCEP). NCEP-defined metabolic syndrome, diabetes, and prevalence of coronary heart disease among NHANES III participants age 50 years and older. Diabetes. 2003;52:1210-4.
2. Sattar N, Gaw A, Scherbakova O, Ford I, O′Reilly DS, Haffner SM, et al. Metabolic syndrome with and without C-reactive protein as a predictor of
coronary heart disease and diabetes in the West of Scotland Coronary Prevention Study. Circulation. 2003;108:414-9.
3. Mathieu P, Poirier P, Pibarot P, Lemieux I, Després JP. Visceral obesity: The link among inflammation, hypertension, and cardiovascular disease. Hypertension. 2009;53:577-84.
4. Parikh RM, Mohan V. Changing definitions of metabolic syndrome. Indian J Endocrinol Metab. 2012;16:7–12.
5. Bloom DE, Rosenberg L. The Future of South Asia: Population Dynamics, Economic Prospects, and Regional Coherence. Available at: http://www. hsph.harvard.edu/pgda/WorkingPapers/2011/PGDA _WP_68.pdf. Accessed 12 December 2018.
6. Misra A, Khurana L, Ishwarlal S, Bharadwaj S. South Asian Diets and Insulin Resistance. Br J Nutr. 2009;101:465-73.
7. Gupta R, Gupta VP. Meta-analysis of coronary heart disease prevalence in India. Indian Heart J. 1996;48:241-5.
8. Mohan V, Shanthirani CS, Deepa R. Glucose intolerance (diabetes and IGT) in a selected South Indian population with special reference to family history, obesity and lifestyle factors-the Chennai Urban Population Study (CUPS 14). J Assoc Physicians India. 2003;51:771-7.
9. Pradeepa R, Mohan V. The changing scenario of the diabetes epidemic: Implications for India. Indian J Med Res. 2002;116:121-32.
10. Sarkar S, Das M, Mukhopadhyay B, Chakrabarti CS, Majumder PP. High prevalence of metabolic syndrome and its correlates in two tribal populations of India and the impact of urbanization. Indian J Med Res. 2006;123:679-86.
11. Kumar A, Kalra S, Unnikrishnan AG. Metabolic state of the nation: Results of the National Family Health Survey-4. Indian J Endocr Metab. 2016;20:429-31.
12. Gupta R, Sharma KK, Gupta A, Agrawal A, Mohan I, Gupta VP, et al. Persistent High Prevalence of Cardiovascular Risk Factors in the Urban Middle Class in India: Jaipur Heart Watch-5. J Assoc Physicians India. 2012;60:11-6.
13. WHO STEPS Instrument (Core and Expanded). The WHO STEPwise approach to noncommunicable disease risk factor surveillance (STEPS). World Health Organization. Geneva. Available at http://www.who.int/chp/steps/instrument/STEPS_In strument_V3.0.pdf. Accessed 12 January 2019. 14. Trinder P. Quantitative determination of glucose
using GOP-PAP method. Clin Biochemistry. 1969;6:24-7.
15. Trinder P. Triglyceride estimation by GPO-PAP method. Ann Clin Biochemistry. 1969;6:24-7. 16. Burstein M, Scholnick HR, Morfin R. Rapid method
17. Expert Panel on Detection, Evaluation, and Treatment of High Blood Cholesterol in Adults. Executive Summary of The Third Report of The National Cholesterol Education Program (NCEP) (Adult Treatment Panel III). JAMA. 2001;285:2486-97.
18. Misra A, Chowbey P, Makkar BM, Vikram NK, Wasir JS, Chadha D, et al. Consensus Statement for Diagnosis of Obesity, Waste Obesity and the Metabolic Syndrome for Asian Indians and Recommendations for Physical Activity, Medical and Surgical Management. J Assoc Physicians India. 2009;57:163-70.
19. Guidelines for Data Processing and Analysis of the International Physical Activity Questionnaire (IPAQ) – Short and Long Forms, 2005. Available at: http//www.ipaq.ki.se/scoring.htm. Accessed 21 December 2018.
20. Sodjinou R, Agueh V, Fayomi B, Delisle H. Obesity and Cardio-Metabolic Risk Factors in Urban Adults of Benin: Relationship with Socio-Economic Status, Urbanisation, and Lifestyle Patterns. BMC Public Health. 2008;8:84.
21. Gupta R, Deedwania PC, Sharma K, Gupta A, Guptha S, Achari V. Association of Educational, Occupational and Socioeconomic Status with Cardiovascular Risk Factors in Asian Indians: A Cross-Sectional Study. PLoS One. 2012;7(8):44098. 22. Misra A, Khurana L. Obesity and the metabolic syndrome in developing countries. J Clin Endocrinol Metab. 2008;93(1):9–30.
23. Batsis JA, Nieto-Martinez RE, Lopez-Jimenez F. Metabolic syndrome: from global epidemiology to individualized medicine. Clin Pharmacol Ther. 2007;82:509–24.
24. Sinha S, Misra P, Kant S, Krishnan A, Nongkynrih B, Vikram NK. Prevalence of metabolic syndrome and its selected determinants among urban adult women in South Delhi, India. Postgrad Med J. 2013;89:68-72.
25. Deshmukh PR, Kamble P, Goswami K, Garg N. Metabolic Syndrome in the Rural Population of Wardha, Central India: An Exploratory Factor Analysis. Indian J Community Med. 2013;38:33–8. 26. Dutra ES, Carvalho KMB, Miyazaki E, Merchán-
Hamann E, Ito MK. Metabolic syndrome in central Brazil: prevalence and correlates in the adult population. Diabetol Metabolic Syndrome. 2012;4:20.
27. Kumar A, Kalra S, Unnikrishnan AG. Metabolic state of the nation: Results of the National Family Health Survey-4. Indian J Endocr Metab. 2016;20:429-31.
28. Das M, Pal S, Ghosh A. Interaction of physical activity level and metabolic syndrome among the adult Asian Indians living in Calcutta, India. J Nutr Health Aging. 2012;16:539-43.
29. Vaidya A, Krettek A. Physical activity level and its sociodemographic correlates in a peri-urban Nepalese population: a cross-sectional study from the Jhaukhel-Duwakot health demographic surveillance site. International J Behavioral Nutr Physical Activity. 2014;11:39.
30. Al-Kabba AF, Al-Hamdan NA, El Tahir A, Abdelshakour M. Prevalence and Correlates of Dyslipidaemia among Adults in Saudi Arabia: Results from a National Survey. Open J Endocr Metab Dis. 2012;2:89-97.