International Journal of Applied Science and Research
169
www.ijasr.org Copyright © 2019 IJASR All rights reservedA comparison of Gompertz and logistic growth models using post-natal
1.Donatus Nyaaba, 2. John Ayuekanbey Awaab, 3.Duwara Aweh Moses, 4.Tule Clement Kani
1.Bolgatanga Polytechnic, Department of Statistics, P. O. Box 767, Ghana -West Africa, 2.University for Development Studies, Department of Statistics P. O. Box 1350,
Ghana,-West Africa,
3. Bolgatanga Polytechnic, Department of Statistics, P. O. Box 767, Ghana -West Africa, 4.Zuarungu Senior High School , P. O. Box 133, Ghana -West Africa.
IJASR 2019 VOLUME 2
ISSUE 4 JULY – AUGUST ISSN:2581-7876 Abstract – Birth weights and subsequent weights of babies play vital role in early childhood development and have important effect on later lives as adults. It also presented a model to explain the growth trajectory of infants monitored in seven health facilities providing post-natal services in Bolgatanga Municipality.Records of three hundred weights of babies were taken from January to December 2013 in these facilities for the study. Sixty five of these records were left out due to the inability of the nursing mothers to attend at most six post-natal cares within the year. The available records of number of children qualified for the analysis were 235 making up 3055 observations. However, later months exhibited high level of missing data which we used multiple imputation method to provide reasonable data points to replace the missingness. Gompertz and logistic growth models were used to fit the data and both models fitted the data well and could be used for prediction. Both Gompertz and Logistic growth models proved a significant increase pattern in the growth of babies and estimating the maximum growth rate at 1.517 and 4.59 kg respectively for a month with high reliability and variability in monitoring the growth rate of babies. The general growth pattern of the baby weight disclosed that while Gompertz model showed an increasing exponential growth pattern and is asymmetrical about inflection, Logistic growth pattern showed a function which is increasing in a quadratic growth pattern of mean weights of babies in the Bolgatanga Municipality overtime with high level of significance of all the parameters in the model at 5% significant level and is symmetrical about the inflection. Prediction of baby weight with time as measure of growth is to be done with high accuracy and precision. Even-though the two growth models have approximately the same high degree of variability indicating high reliability in their prediction of baby weights, Gompertz model proved to be relatively better because it gave the least values of root mean square error and residual deviance. Hence Gompertz model was selected as the better model for prediction of the mean change of weights of babies over time in the municipality with the growth equation
weight=9.688 exp(-exp(0.221-0.462t) )and increasing at a growth rate of d(weight)/d(t) = 0.462y exp (0.221 - 0.462t) with the maximum achievable weight increment per month as 1.517kg.Finally, all the weights of babies that we considered in our study established that growth of weights of babies studied is not linear but indicated non-linear growth pattern of Gompertz and/or logistic over time.
From the study conducted, Gompertz model and the reduced mixed model are more suitable for explaining the mean weights of babies in the municipality overtime.The Gompertz model equation is given as:
weight=9.688 exp(-exp(-0.221(x-0.462) ) )
Whilst the reduced model equation is given as:
(Y ) ̂ = 1.1259w_1+ 0.5412w_2+ 0.3185w_3+0.3724w_4-0.1707w_5
Keywords: Gompertz, logistic, missingness, multiple imputations, post-natal
1.0 Introduction
International Journal of Applied Science and Research
170
www.ijasr.org Copyright © 2019 IJASR All rights reservedpermanent increase in the size of any object of interest to researchers (Tzeng& Becker, 1981; Yakupoglu&Atil, 2001; Sengul&Kiraz, 2005).
Nonlinear regression is an extended linear regression technique in which a nonlinear mathematical model is used to describe the relationship between the response variable and the predictor variables (Bales and Watts 1988). A nonlinear regression model is a model that contains at least one of the parameters in a nonlinear form.
Growth which is a permanent increase in size over time was modeled as an exponential function. The earlier of such models were the Malthusian exponential population models (Malthus, 1798). Exponential models had limitations due to the fact that things which are capable of growing do so within certain bound but the Malthusian models give an impression that growth is boundless which is perfectly true in mathematical or theoretical sense but deviates from growth of organisms. To overcome the limitations of the exponential models, logistic model is proposed (Chasnov, 2009) which included the restriction required to make accurate prediction of growth has been studied and used to model growth in several fields of study such as agriculture, biology, economics, physics, finance and chemistry. Pearl and Reed (1920) modeled growth with logistic curve.
The Gompertz growth curve has also been studied and used extensively in phenomena in the actuarial science. Comparing the characteristics of logistic and Gompertz growth models was presented in a paper by Winsor (Winsor, 1932) and he concluded that neither in reality seemed superior in terms of accuracy in prediction of growth at a certain point in time.
Wright (1926) first used the Gompertz curve in modeling biological growth. Also, Wright and Davidson (1928) carried out studies where they used the Gompertz curve to illustrate the growth in body weight of cattle. The growth and development of children between 1997 and 2003 the world over was assessed using growth curves which was in response to World Health Organization under the Multicentre Growth Reference Study (MGRS).They combined a longitudinal follow-up from the time of birth to age 24 months as well as a cross-sectional survey of children between the age bracket of 18 to 71 months. A total of 8440 primary growth data and related information were gathered for the analysis. The survey was basically designed to come out with a standard by choosing healthy children from mothers who used health-promoting practices living under conditions likely to favor the achievement of their full genetic growth potential (WHO, 2006).
In Ghana, a child born either at home or in a health facility is mandated to have a postnatal care (care given to the mother and the child one month after birth) and subsequent monthly weighing of the baby known as child welfare care. The reasons for the child welfare care include: growth monitoring of the child, for early detection of any abnormal growth existing condition for referral to the appropriate health unit for special attention, for immunization against the six childhood killer diseases and for counseling of the mothers with regards to the welfare of both the child and the nursing mother.
The first month of life, called the newborn or neonatal period is the riskiest period in the life of every individual because whilst inside their mothers, babies are safe, warm and well fed.
After birth, newborns have to adapt to a different way of feeding, breathing and staying warm otherwise they can get sick easily leading to death. Thus, the health and survival of newborn children depend largely on their weights and how they are cared for. Out of every 100 children born alive, about 10 die before reaching the age of five years (WHO, 2012).
International Journal of Applied Science and Research
171
www.ijasr.org Copyright © 2019 IJASR All rights reservedA five year child survival program known as Essential Newborn Care started in 2012 in Bolgatanga Municipality as well as the other municipalities and districts within the region is designed to improve the birth, soon after birth and the postnatal period (UNICEF, 2013).
The health and survival of newborn children depend largely on how they are cared for. Recent worldwide evaluation points to the fact that commitment to raising the standards of the health status of newborn babies’ yield meaningful socio-economic contributions (Yinger and Ransom, 2003).
Further research on newborn babies revealed that child survival programme has assisted in the reduction of death rates among under-five year old babies over the past twenty five 25 years and the greatest impact has been on reducing mortality from diseases which attack infants and children over one month old. Hence, huge proportions of infant mortality take place between the first month of life (the neonatal period), a period when a child’s risk of death is almost fifteen (15) times greater than at any other time before the first birthday (Yinger and Ransom, 2003).
Tinker and Ransom (2003) stipulated that, though newborn health is closely related to that of their mothers, newborns have a unique need that must be addressed in the content of maternal and child health services. Their further argument was that millions of newborn deaths could be avoided if more resources were invested in proven low-cost interventions designed to address newborn needs.
A similar research on newborn babies estimated that almost two-thirds of infant mortality occurs in the first month of life, of which more than two-thirds die in their first week, and among them, two-thirds die in their first 24 hours (Lawn, 2001).
2.0 Research Methods
2.1Data used
It also presented a model to explain the growth trajectory of infants monitored in seven health facilities providing post-natal services in Bolgatanga Municipality.
Records of three hundred weights of babies were taken from January to December 2013 in these facilities for the study. Sixty five of these records were left out due to the inability of the nursing mothers to attend at most six post-natal cares within the year.
The available records of number of children qualified for the analysis were 235 making up 3055 observations.
However, later months exhibited high level of missing data which we used multiple imputation method to provide reasonable data points to replace the missingness.
2.2Growth models
Apart from using the profile analysis to examine and assess repeated measurements which assumes a linear model framework we can also assess growth models using the non-linear approach. The most popular of them are the Gompertz and logistic models (Winsor, 1932).
2.2.1Gompertz growth model
These models can have three or four parametric models but in this study we used the three parameter growth models in our analysis.
The Gompertz 3-parametric growth model is given by;
𝑦 = 𝑘𝑒−𝑒−𝛼(𝑥−𝛽)(1)
International Journal of Applied Science and Research
172
www.ijasr.org Copyright © 2019 IJASR All rights reserved 𝑦 = 𝑘𝑒−𝑒(µ−𝛼𝑥) (2)where µ= 𝛼𝛽, y = mean weights of babies and 𝑥 = time in months
2.2.2Growth rate of mean weights of babies
Tofind 𝑑𝑦
𝑑𝑥 from(2), weusedthe chainrule by
letting
𝑡 = −𝑒(µ−𝛼𝑥) (3)
𝑎𝑛𝑑
𝑦 = 𝑘𝑒𝑡(4)From (3),
𝑑𝑡
𝑑𝑥= −𝛼(−𝑒 (µ−𝛼𝑥))
= 𝛼𝑒(µ−𝛼𝑥)(5) and from (5),
𝑑𝑦 𝑑𝑡 = 𝑘𝑒
𝑡(6)
𝑑𝑦 𝑑𝑥=
𝑑𝑡 𝑑𝑥.
𝑑𝑦 𝑑𝑡 = 𝑘𝑒
𝑡(𝛼𝑒(µ−𝛼𝑥))= 𝛼𝑦𝑒(µ−𝛼𝑥) (7)
From (2), we divided both sides by k and took logarithms of both sides and got
log (𝑦 𝑘) = −𝑒
(µ−𝛼𝑥) (8)Dividing through by −1 implies
log (𝑘 𝑦) = 𝑒
(µ−𝛼𝑥) (9)
Substituting (9) into (7) implies
𝑑𝑦
𝑑𝑥= 𝛼𝑦𝑒
(µ−𝛼𝑥)= 𝛼𝑦 log (𝑘
𝑦) (10)
From (10), the relative growth rate of mean weights of babies as a function of time is : 1
𝑦 𝑑𝑦 𝑑𝑥= 𝛼𝑒
(µ−𝛼𝑥) (11)
Also from (10),the relative growth rate of mean weights of babies as a function of size is:
1 𝑦
𝑑𝑦
𝑑𝑥= 𝛼(logk − log 𝑦) (12)
To find the 𝑥 − coordinate, we equated (10) to zero i.e.
𝛼𝑦𝑒(µ−𝛼𝑥)= 0 (13) Solving (13) gives as
International Journal of Applied Science and Research
173
www.ijasr.org Copyright © 2019 IJASR All rights reserved 𝑦 =𝑘𝑒 Testing for nature of stationary points from (10),
𝑑𝑦 𝑑𝑥= 𝛼𝑦𝑒
(µ−𝛼𝑥)
Using the product rule, let
𝑚 = 𝑦 = 𝑘𝑒−𝑒(µ−𝛼𝑥) and
𝑛 = 𝛼𝑒(µ−𝛼𝑥)
Then, 𝑑𝑥𝑑𝑚= 𝛼𝑦𝑒(µ−𝛼𝑥)
And
𝑑𝑛
𝑑𝑥= −𝛼
2𝑒(µ−𝛼𝑥)(14)
but
𝑑2𝑦
𝑑𝑥2= 𝑚
𝑑𝑛 𝑑𝑥+ 𝑛
𝑑𝑚
𝑑𝑥 = 𝑦(−𝛼
2𝑒(µ−𝛼𝑥)) + 𝛼𝑒(µ−𝛼𝑥)(𝛼𝑦𝑒(µ−𝛼𝑥)) = 𝛼2𝑦𝑒(µ−𝛼𝑥)(𝑒(µ−𝛼𝑥)− 1) (15)
To test for the nature of stationary points, we put 𝑥 = µ
𝛼into (15) i.e.
𝑑2𝑦
𝑑𝑥2 = 𝛼2𝑦𝑒
(µ−𝛼𝑥)(𝑒(µ−𝛼(𝛼µ))− 1) = 0
Since
𝑑 2𝑦
𝑑𝑥2 = 0
the point of inflexion of mean weights of babies occurred at 𝑥 = µ
𝛼 .
The ordinate at the point of inflexion is 𝑦 = 𝑘
𝑒 .The maximum growth rate of mean weights of babies in the
municipality from (10) is
𝑑𝑦 𝑑𝑥= 𝛼𝑦𝑒
(µ−𝛼𝑥) . But 𝑦 = 𝑘
𝑒 𝑎𝑛𝑑𝑥 =
µ
𝛼 when put into (10) gave a maximum growth rate of mean weights of
babies in the municipality as:
(𝑑𝑦𝑑𝑥) =µ𝑘
𝑒 , asymptotes occurred at y = 0 and y = k
From practice, we fit Gompertz growth model if the point of inflexion is about 35-40% of the total growth attained.
2.2.4 Logistic growth model
We can also fit a logistic growth model for our data which is a close counterpart of the Gompertz model. The logistic model is given by;
𝑦 = 𝑘
(1 + 𝑒−𝛼(𝑥−𝛽)) (16)
International Journal of Applied Science and Research
174
www.ijasr.org Copyright © 2019 IJASR All rights reserved𝑦 = 𝑘
1 + 𝑒(µ−𝛼𝑥)=
𝑘(1 + 𝑒(µ−𝛼𝑥))−1 (17)
where
µ= 𝛼𝛽
2.2.5Growth rate of mean weights of babies
To find 𝑑𝑦𝑑𝑥, from (17) we used the chain rule by letting
t = 1 + 𝑒(µ−𝛼𝑥) (18)
and
𝑦 = 𝑘𝑡−1 (19) From (3),
𝑑𝑡
𝑑𝑥 = −𝛼𝑒
(µ−𝛼𝑥) (20)
Also from
𝑑𝑦 𝑑𝑡 = −𝑘𝑡
−2 (21)
but 𝑑𝑦 𝑑𝑥=
𝑑𝑡 𝑑𝑥 .
𝑑𝑦 𝑑𝑡 = −𝑘𝑡
−2(−𝛼𝑒(µ−𝛼𝑥))
= 𝑘𝛼𝑒(µ−𝛼𝑥)𝑡−2 (22)
From (16),
𝑒(µ−𝛼𝑥) = 𝑘−𝑦
𝑦 (23)
Substituting(23)into(22)gives
𝑑𝑦 𝑑𝑥=
𝛼𝑦
𝑘 (𝑘 − 𝑦) (24)
The maximum growth rate of mean weights of babies is𝛼𝑘4 , asymptotes occurred at y = 0 and y = k Point of inflexion occurred at 𝑥 = µ
𝛼 and 𝑘 2 .
The relative growth of mean weights of babies as a function of time is given by:
1 𝑦
𝑑𝑦 𝑑𝑥=
𝛼
1+𝑒−µ+𝛼𝑥(25)
The relative growth rate of mean weights of babies as a function of size is given by: 1
𝑦 𝑑𝑦 𝑑𝑥=
𝛼
International Journal of Applied Science and Research
175
www.ijasr.org Copyright © 2019 IJASR All rights reservedThe principal interest in the two models is to compare them and choose the one which is superior in terms of its ability to provide prediction with the least errors
3.0Results and Discussions
3.1Growth model
3-Parameter Gompertz and 3-Parameter Logistic models are the growth models used in this study. Their respective figures and tables are displayed below with b1, b2 and b3 representing α, β and γ respectively
3.1.1Gompertz growth model
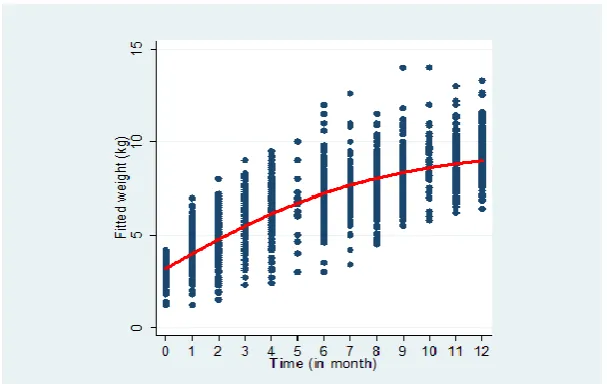
Figure 4.9 shows the pattern of mean change in weights of babies over time using 3-Parameter Gompertz growth model
Figure 1.0Gompertzgrowth of mean weights overtime
Figure 1.0 shows that the general pattern of change in mean weights of babies increases over time. The Gompertz growth curve of the mean weights of babies over a one year period asymptotes occur at y=0 and y=k with the point of inflection showing at y=k/e and t=α/β with a maximum growth rate of βk/e
Table 4.10 below shows the three parameter Gompertz growth model of baby weights over time
Table 1: 3-Parameter Gompertz growth model of baby weights
3-parameter Gompertz function k*exp(-exp(𝜶 *(time-𝜷)))
Weight Estimate Standard Error
𝑡 𝑃>𝑃 [95% conf. interval]
𝒌
9.6880 0.1140 84.3900 0.0000 9.4630
𝒌 0.2210 0.0080 27.0200 0.0000 0.2050
𝒌 0.4620 0.0610 7.5100 0.0000 0.3410
Therefore, the fitted Gompertz growth model from table 1.0 is stated as shown below: weight= 9.688 exp〖(-exp(-0.221(x-0.462) ) ) 〗(26)
International Journal of Applied Science and Research
176
www.ijasr.org Copyright © 2019 IJASR All rights reserved The rate of change in mean weights of babies is then given as:(d(weight))/(d(x))=0.2210y exp(0.1021-0.2210x) (27) Relative growth rate as a function of weight:
1/y (d(weight))/(d(x)) = 0.2210(0.9862-logy) (28) Relative growth rate as a function of time:
1/y (d(weight))/(d(x)) =0.2210e^((0.1021-0.2210x)) (29)
Maximum growth rate of mean weights of babies = (µk)/e=0.102(9.688)/2.72=0.3633 = 36.33% Asymptotes occurred at y=0 and y=9.688 and the point of inflexion occurred at the point (0.46, 3.56) 3.1.2Logistic growth model
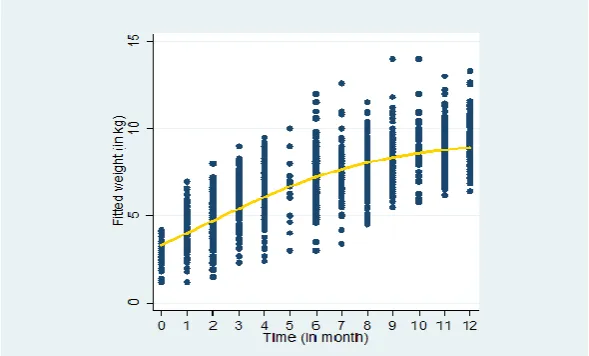
Figure 2.0 shows the pattern of mean change in weights of babies over time using 3-Parameter Logistic growth model
Figure 1: Logistic growth pattern of mean baby weights overtime
That of the logistic growth curve model has the asymptotes showing at y=0 and
y=k.
With the point of inflection at y=k/2 and t=α/β
Table 2 shows the three parameter logistic growth model of baby weights over time.
Table 2: 3-Parameter Logistic growth model of weights of babies
3-parameter logistic function weight_=𝒌 /(1+exp(-𝒌 (t-𝒌)))
Weight Estimate Standard Error 𝑃 𝑃>𝑃 [95%conf. interval]
𝒌 9.3410 2.0500 106.8700 0.0000 9.1700 9.5130
𝒌 0.3020 0.0090 32.0090 0.0000 0.2840 0.3210
International Journal of Applied Science and Research
177
www.ijasr.org Copyright © 2019 IJASR All rights reserved The fitted 3-Parameter Logistic model is shown below:𝑃𝑃𝑃𝑃ℎ𝑃= (1+𝑃𝑃𝑃(−09..302341(𝑃−1.926)))Where 𝑃=0,1,2,3, … …𝑃𝑃(i.e.𝑃=time in months)
The rate of change in mean weights of babies is then given as; 𝑃(𝑃𝑃𝑃𝑃𝑑(𝑥)ℎ𝑡) = 0.0323𝑦(9.3410 − 𝑦) =0.3017𝑦 −0.0323𝑦2(30)
Relative growth rate as function of weight: 1𝑦𝑑(𝑤𝑒𝑖𝑔ℎ𝑡)𝑑(𝑥) = 0.0323(9.341 − 𝑦) (31)
Relative growth rate as function of time:1 𝑦
𝑑(𝑤𝑒𝑖𝑔ℎ𝑡)
𝑑(𝑥) =
0.3020
1+𝑒0.3020𝑥−9.341(32)
Maximum growth rate= µ4𝑘 =0.5816(9.341)
4 = 1.358 = 135.8%
Asymptotes occurred at 𝑦 = 0𝑎𝑛𝑑𝑦 = 9.341 and the point of inflexion occurred at the point (0.46, 4.67)
Where µ = 𝛼𝛽
Hence the point of inflection for this growth model is (0.157, 4.671)
Thus at 5% significant level, the logistic growth model indicated that there was a significant increase in weight with time but showing inflection at (0.157, 4.671). The optimum increase in the weight of the babies from the logistic growth pattern was 4.59.
3.4 Growth Model comparison
Gompertz and Logistic models are compared using the model selection criteria as shown below.
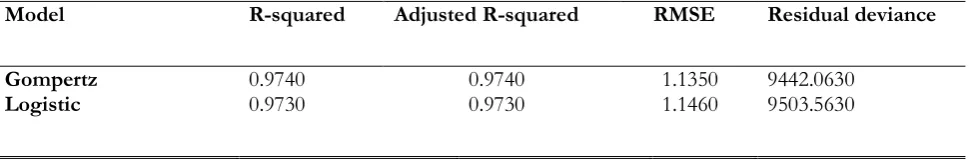
Table 3: Model selection criteria for Gompertz and Logistic models
Model R-squared Adjusted R-squared RMSE Residual deviance
Gompertz
Logistic 0.9740 0.9730 0.9740 0.9730 1.1350 1.1460 9442.0630 9503.5630
Table 3 gives the model selection criteria of Gompertz and logistic models. The Gompertz model had lower root mean square error of 1.135, residual deviance of 9442.063 and equal higher values of squared and Adjusted R-squared of 97.4% compared to the Logistic model with higher values of root mean square error of 1.146 and residual error of 9503.563 and equal lower values of R-squared and Adjusted R-squared of 97.3%. Since the Gompertz model gives the least values of root mean square error and residual deviance, it is selected as the better model for prediction of the mean change of weights of babies over time as compared to the logistic model.
Conclusion
International Journal of Applied Science and Research
178
www.ijasr.org Copyright © 2019 IJASR All rights reservedbabies in the Bolgatanga Municipality overtime with high level of significance of all the parameters in the model at 5% significant level and is symmetrical about the inflection. Prediction of baby weight with time as measure of growth is to be done with high accuracy and precision. Even-though the two growth models have approximately the same high degree of variability indicating high reliability it their prediction of baby weights, Gompertz model proved to be relatively better because it gave the least values of root mean square error and residual deviance.
Hence Gompertz model was selected as the better model for prediction of the mean change of weights of babies over time in the municipality with the growth equation
weight=9.688 exp(-exp(0.221-0.462t) ) and increasing at a growth rate of d(weight)/d(t) = 0.462y exp (0.221 - 0.462t) with the maximum achievable weight increment per month as 1.517kg.
The nonlinear growth pattern overtime was further confirmed and the trend analysis developed in Gompertz and logistic growth models. The 3-parameter Gompertz and logistic growth models were statistically significant at the 5% significance level. From the model selection criteria, Gompertz model with the lower values of root mean square error and residual deviance compared to the logistic model, was selected as better growth model as the growth pattern and for reliable prediction of weights of babies in the municipality at 97.4% variability.
Finally, all the weights of babies that we considered in our study established that growth of weights of babies studied is not linear but indicated non-linear growth pattern of Gompertz and/or logistic over time.
REFERENCES
1. Akbaş, Y. and E. Yaylak, 2000: Heritability estimates of growth curve parameters and genetic correlations between the growth curve parameters and weights at different age of Japanese quail. Arch. Geflugelkunde 64(4), 141-146.
2. Anthony, N.B., K.E. Nestor and W.L. Bacon, 1986: Growth curves of Japanese quail as modified by divergent selection for 4-week body weight. Poultry Sci. 65, 1825-1833.
3. Astolfi, P. and Zonta, L. A. (2002). Delayed maternity and risk at delivery. In: Pediatric and Prenatal Epidemiology.16: 67-72.
4. Bale J. R., Stoll, B. J. and Lucas, A. O. (2003). (eds). Improving Birth Outcomes: Meeting the Challenges in the Developing World. Washington D.C: The National Academies Press.
5. Basso, O. J., Otsen, A. M., Johansen, T., and Christensen K., (1997). Change in social status and risk low birth weight in Denmark: Population based cohort study. IN: British Medical Journal. 315: 1498-1502. 6. Bategeka, L., Leah, M., Okurut, A., Barungi, M., and Apolot, J. M. (2009). The determinants ofbirth
weight in Uganda. A final report submitted to AERC, Nairobi, Kenya.
7. Blossner, D. and Mercedel, O. (2005). Malnutrition: qualifying the health impact at national and local levels. Geneva, World Health Organisation, (WHO Environmental Burden of Disease Series No.12). 8. Breat, G. (1997). Delayed childbearing In: European journal of Obstetrics and Genecology and
Reproductive Biology, 75: 71-73.
9. Caulfield, L. E., De Onis, M., Blossner, M. and Black, R. E. (2004). Under nutrition as an underlying Cause of child deaths associated with diarrhoea, pneumonia, malaria and measles. American Journal of Clinical Nutrition, 80: 193-198.
10. Conley, D. and Bennett (2000). Birth weight and income: Interactions across Generations. Journal of Health and Social Behaviour, 42(12):450-465
11. Deshmukh, J. S., Motghare, D. D., Zodpey, S. P. and Wadhva, S. K., (1998). Low birth weight and associated maternal factors in an urban area, Indian pediatrics, 35: 33-36.
International Journal of Applied Science and Research
179
www.ijasr.org Copyright © 2019 IJASR All rights reserved13. Dickute, J. Z., Padaiga, V., Grabauskas, R. J., Nadisauskiene, V. and Basys A. (2004). Maternal socio-economic factors and the risk of low birth weight in Lithuania. In: Medicina, Kaunas, 40(5): 475-482.
14. Dietz, W. H. (2004). Overweight in childhood and Adolescence. N. Engl. J Med, 350: 855-811.
15. Dreyfuss, M. L., Msamanga, G. I., Spiegelmam, D., Hunter, D. J., Ernest, Urassa, E. J. N., Hertzmark, E. and Fawzi, W. W. (2001). Determinants of Low Birth Weight among HIV-infected pregnant women in Tanzania, American Journal of Clinical Nutrition, 74(6): 814-826.
16. Foix, L. and Blondel, B. (2000). Changes in risk factors of preterm delivery in Francebetween 1981 and 1995. In: Pediatric and Prenatal Epidemiology, 14: 314-323.
17. Fortaine, K. R., Redden, D. T., Wang, C., Westfall, A. O. and Allison, D. B. (2003). Years of life lost due to Obesity. JAMA, 289: 187-193.
18. Freedman, D., Dietz, W. H., Srinivasn, S. R. and Berenson, G. S. (2009). Risk Factors and Adult body mass index among overweight children: The Bogalusa Heart Study. Pediatrics 123 (3): 750-757.
19. Gavrilov, L. A., & Gavrilova, N. S. (2000). Human longevity and parental age at conception.
20. Gibbs, C. M., Wendt, A. A., Peters, S. S. and Hogue, C. J. (2012). The impact of early age at first child birth on maternal and infant health. Paediatric and Perinatal Epidemiology, 26(1): 259-284.
21. Gompertz, B. (1825) on the nature of the function expressive of the law of human mortality, and on a new mode of determining the value of life contingencies. In a letter to Francis Baily, Esc. F.R.S. Phil. Trans. Soc. London 115,513-585.
22. Gortmaker, S. L. and Wise, P. (1997). The First In justice: Socio-economic Disparities, Health Services Technology and Infant Mortality. Annual Review of Sociology, 23: 147-70.
23. Guyatt, H. L. and Snow, R. W. (2004). Impact of malaria during pregnancy on Low Birth Weight in Sub-Sahara Africa Nairobi, Kenya.
24. Hesketh, K., Wake, M. and Waters, E.(2004). Body mass index and parent-reported self-esteem in elementary school children:evidence for a casual relationship. Int. J Obes Relat Metab Discord, 28: 1233-1237.
25. Hughes, A. R. and Reilly, J. J. (2008). Disease management programs targeting Obesity in children setting the scene for Wellness in the future. Disease management and Health Outcomes, 16: 255-266.
26. In J. M. Robine, T. B. L. Kirkwood, & M. Allard (Eds.), Sex and longevity:Sexuality, gender, reproduction, parenthood (pp. 7–31). Berlin: Springer-Verlag.
27. Jianqing, F. and Zhang, J. T. (1999). Estimation of functional linear models with applications to longitudinal data, Department of Statistics, UNC-Chapel Hill, NC 27599-3260, pdf-page 10-13.
28. Joyce, T. (1994). Self-selection, prenatal care and birth weight among blacks whites andHispanics in New York City. Journal of Human Resources, 29: 762-794.
29. Kartzmarzyk, P. T. and Jassen, I. (2004). The economic costs associated with physical inactivity and Obesity in Canada: An update, Can J Appel Physical, 29: 90-115.
30. Klufio, C. A., Lassey, A. T., Annan, B. D. and Wilson, J. B. (2000). Birth weight Distribution at Korle-Bu Teaching Hospital, Ghana. East African Medical Journal, 78(8): 418-423.
31. Lagstrom, H., Hakanen, M., Niinikoski, H., Viikari, J., Ronnemaa, T. and Saarinen, M. (2008). Growth patterns and obesity development in overweight or normal weight 13-years old adolescents: The STRIP study. Pediatrics, 122(4): 876-883.
32. Lawn, J. (2009). The Healthy Newborn: A Reference Manual for Program Managers, accessed online at www.cdc.gov/nccdphp/drh/health-newborn.htm
33. Manson, J. E. and Bassuk, S. S. (2003). Obesity in the United States. A fresh look at its high toll. JAMA 289: 229-230.
International Journal of Applied Science and Research
180
www.ijasr.org Copyright © 2019 IJASR All rights reserved35. Michael, P., Paul, M., Bob, L., Oliver, S., Jill, T., Dave, T., Catherine, T. and Russell, W. (2002). Longitudinal data analysis with discrete and continuous responses course notes.
36. Murthy, H. V. V. (1991). Birth weight and the associated factors-a review. Ind J Soc Work 11: 151-156. 37. Must, A. and Strauss, R. S. (1999). Risk and consequences of Childhood and Adolescent Obesity.
International Journal Obes Rel at Metab Discord, 23: 82-811.
38. Okurut, F. N. (2009). Determinants of birth weight in Botswana. A paper presented at the CSAE Conference, 22nd-24thMarch, University of Oxford UK.
39. Onwuanaku C.A, Okolo S.N, Ige K.O, Okpe S.E and (2011).The effects of birth weight and gender on neonatal mortality in north central Nigeria. Journal, publisher Biomed Central.
40. Rao, G. (2006). Child Obesity. Amherst, New York: Prometheus
41. Raum, E., Arabin, B., Schlaud, M., Waiter, U. and Schwartz, F. W. (2001). The impact of material education on intrauterine growth: a comparison of former West and East Germany. Handover Germany. 42. Rosenzweig, M. R. and Schultz, T. P. (1983). Estimating a household production function heterogeneity,
the Demand for Health inputs, and their effects on birth weight. Journal of Political Economy, 91(5): 723-746.
43. Sachdev, P. S. and Valenzuela, M. (2013). Brain and cognitive reserve. Am J Geriat Psychiat, 17: 175-178. 44. Sawalha, R. M., Dale, L.V., Jeffrey, F. and Stephen, D. K. (2005). Evaluation of autoregressive covariance
structures for Test-Day Records of Holstein Cows: Estimates of Parameters.
45. Schmitz, K. H. and Jeffry, R.W. (2002). Prevention of obesity. In: TA Wadden, AJ Serdula, M. K., Ivery, D., Coates, R. J., Freedman, D. S., Willianson, D. F. and Byers,T (1993). Do obese children become obese adults? A review of literature. prev. med, 22: 167-177.
46. Silvestrina, S. S. and Sachdeva, R. R. (2013). Comparative analysis of birth weight in a hospital over a decade: low birth weight still a major problem. Journal of Nepal Paediatric Society, 33(1): 15-20.
47. Sokol,E.,Aguayo,V. and Clark,D.,2007.Protecting breastfeeding in West and Central Africa: 25 years implementing the international code of marketing breast milk substitutes.Unicef Publication.
48. Thompson, D. R., Obarzanek, E., Franko, D. L., Barton, B. A., Morrison, J., Biro, F. M. (2007). Childhood overweight and cardiovascular disease risk factors: The National Heart, Lung and Blood Institute Growth and Health Study. Journal of pediatrics, 150 (1): 18-25.
49. Tremblay, M. S., Inman, J. W. and Willms, J. D. (2000). Relationship between physical activity, Self-esteem and academic achievements in ten and eleven-year-old children. Pediatric Exer Sci, 11: 312-323. 50. Ubomba-Jaswal, P. and Ubomba-Jaswa, S. R. (1996).Correlates of low birth weight in Botswana.
51. UNICEF and WHO (2004). Low Birth weight: Country, Regional and GlobalEstimates. New York: UNICEF.
52. Veugelers, P. J. (2005). Prevalence of and risk factors for childhood overweight and obesity. Department of Public Health Sciences, Faculty of medicine and Dentistry, University of Alberta,13-106 D. Clinical Sciences Building, Edmonton AB T6G 2G3; fax 780492-0364.
53. Veugelers, P. J., Fitzgerald, A. L. and Johnson, E. (2005). Dietry intake and Risk factors for poor diet quality among children in Nova Scotia. Can J public Health, 96: 212-6.
54. WHO. (2011). World Health Statistics 2011.World Health Organization, Geneva World health organization (2013). http://www.who.int/en/.accessed. March 2, 2014.
55. Winsor, C. P. (1932). The Gompertz curve as a growth curve. Proceedings of the National Academy of Sciences, 18, 1-8.Witten, M. (1985). A return to time, cells, systems, and aging: 111,