© 2017 IJSRSET | Volume 3 | Issue 1 | Print ISSN: 2395-1990 | Online ISSN : 2394-4099 Themed Section: Engineering and Technology
Analytical Model for Software Reliability Prediction
Rasha Gaffer M. Helali
Department of Computer Science, University of Bisha, Saudi Arabia
ABSTRACT
The big evolution in software field lead to increase the need for existence of high quality quantitative measurements for both syntactic and semantic features. Considering software products in particular, we found that the most existing tools measure syntactical features only – syntactic metrics- that reflect how programs represented in source code, but not what functions that programs define. In this paper, we discuss semantic metrics, which characterize the sets and functions that the programs define; now it would be a useful complement to the vast body of software metrics in use. The results of this study show how semantic metrics can be used as indicator to some factors that affect software reliability.
Keywords: Semantic Metrics, Software Metrics, Software Quality, Syntactic Metrics
I.
INTRODUCTION
Software engineering like all engineering disciplines relies on product and process metrics to quantify quality attributes of software artifacts, to support quantitative decision-making [1]. Software metrics aim is to establish the relationships between numbers collected from software artifacts and quality attributes of software [2].
Focusing on product metrics in particular, we found that most metrics are based on a syntactic analysis of the source code, rather than the analysis of its semantic properties. In addition, we found that the use of these metrics is centered on their role in helping software engineers predict fault proneness of software artifacts.
We submit the following premises to challenge this state of affairs:
While the representation of a program may give us some information about how difficult the design was, and how prone it was to has faults, it tells us relatively little about whether the design of the program is redundant, whether the program is fault tolerant, or whether it is likely to behave correctly.
Focusing on faults, the practice of software metrics may be missing an important aspect of software
quality. It is widely documented that a program may be either reliable while having many faults, or unreliable while having fewer faults. From the standpoint of a user, failure frequency is more important than fault density, and metrics should reflect this focus.
Traditional software metrics attempt to estimate or quantify the quality attributes of a software product in terms of whether it is correct with respect to its specification; yet, they try to do so without consideration of the specification in question. We discus that any attempt to quantify the likelihood of being correct with respect to a specification ought to involve the specification in question, in addition to the program. [1]
In the light of these observations, a number of semantic software metrics were introduced in [1].This study is an attempt to explore how these metrics can be used analytically to predict software reliability.
presented in [1] and their capabilities. In sections V and VI the empirical validation process and results are discussed. Finally, analytical model were presented and results were shown.
II.
METHODS AND MATERIAL
A. Software Metrics
According to the study, cited in [3] software metrics are defined as type of measurement that uses numerical ratings to quantify software attributes. Typical measurements include the quality of the source codes, the development process and the accomplished applications[4].
The terms metric and measure have some overlap. Measure is used for more concrete or objective attributes but metric are used for more abstract, higher-level, or somewhat subjective attributes. For instance, line of code (LOC) is a measure: it is both objective and concrete. [4]. Four syntactical measurement classes are investigated in [5]as follows:
A) Length measurements
Metrics that use this kind of measure focus only on code length without considering software complexity. Such as:
1) Line of code (LOC):
It is a traditional way of measuring program size by counting its number of lines. All lines are counted except that contains comments and empty lines [3]. Although, this is the easiest way to measure program length, it does not give an accurate measure of actual program length in terms of time and effort.
2) Number of signs:
LOC does not take into account any factors other than total number of lines. Number of lines does not represent an accurate measure for program length. To overcome this limitation the metric focus on code content rather than total number of lines. It counts number of operands and operators as follow: n1 is the number of operations, N1 total operation frequency, n2 is the number of operands and N2 is the total operands
frequency [5]. All these parameters used in program length calculation.
B) Depth measurements
This measurement considers the code complexity regardless of its length. It depends on the concept of having two programs with same length and different complexity [5]. Such as:
1) McCabe: Cyclomatic complexity was developed by Thomas J. McCabe, Sr. in 1976 and is used to indicate the complexity of a program [3]. This metric is amongst the most popular methods to measure implementation complexity [2]. It represents the program in a control flow graph. The nodes of the graph correspond to indivisible groups of program commands, and a directed edge connects two nodes if the second command might be executed immediately after the first command [6]. Number of edges and nodes used to calculate the following equation:
(1) Where e is the number of edges and n is the number of nodes. Researches confirmed that McCabe metric could be used to give a glance of faults density. [5]
C) Size Measurements
These metrics focused on both program length and depth to measure complexity. One of the famous metrics that used this method is halstead metric [4]. Halstead suggests a measure to program length as appears in (2):
(2)
Where n1 is the number of operators and n2 is the number of operands in the code. In addition to that to calculate the program size halstead metric represents the program as a message written by a programmer. According to that if we need to calculate the actual value for this message we must calculate H (n).
Where n is the number of symbols and H is the massage name. The complete equation is [5]
Based on that we can conclude to the result that number of symbols = n1 + n2.
D) Data Measurements
Data measurement aims to measure the size and complexity of the program structure. It should be noted that the size of the program might differ according to the type of programming language. [5]
Size = minimum size / actual size (4)
By another way, we can calculate the density of the program data by calculating the number of known variables within the program [5]. These may contribute to estimate the effort that made by the software programmer.
E) Design Measurement
There are two main concepts introduced here; Cohesion and coupling.
Cohesion reflects the extent to which internal elements of the system related to each other. Where, coupling cares about the relation between different partial components.
Design quality = high cohesion + low coupling (5)
All the previous measurements belong to Syntactic metrics field. That reflect attributes of the source code text; not its execution attributes.
A significant drawback of the current used methods is that different structural aspects of code result in different metrics value, even if code is performing the same task. Syntactic metrics are not always accurate descriptors of quality. On another hand, Desirable quality attributes like reliability and maintainability cannot be measured until some operational version of the code is available [6]. Yet we wish to be able to predict which part of the software is less reliable, more difficult to test, or require more maintenance than others, even before system is completed.
Nowadays, there is a great movement towards the semantic metrics that reflect the meaning of software within the problem domain. Researchers use semantic
metrics to provide insight into software quality early in the design phase of software development [7]. Others extend semantic metrics to analyze design specifications [8].Other researches move towards object oriented programming and empirically investigate a suit of design metrics to serve as predictors of fault-prone classes. More recently, in [9] cohesion and coupling of ontology based on semantic information are discussed. In spite of, the success of semantic metrics in software quality field, a little number of studies has been conducted on this issue. The field is still young and much research is still required.
F) Information Theory / Entropy
Entropy is closely related to the information theory; this section defines entropy in the context of source code analysis.
In information theory, entropy is a measure of the uncertainty or information content of a random variable.[10]
A random variable is a variable whose value is subjected to variations due to chance. Random variables can be classified as either discrete or continuous [10].
In this context, the term entropy is usually refers to the Shannon entropy, which quantifies the expected value of the information contained in a message. Entropy is typically measured in bits, nats, or bans.[11]Shannon entropy is the average unpredictability in a random variable, which is equivalent to its information content. The concept was introduced by Claude E. Shannon at 1948 in [12].
Shannon entropy provides an absolute limit on the best possible lossless encoding or compression of any communication, assuming that the communication may be represented as a sequence of independent and identically distributed random variables [10]. Shannon denoted the entropy H of a discrete random variable X with possible values {x1, ...,xn} and probability mass function P(X) as,
(6)
When taken from a finite sample, the entropy can explicitly be written as:
(7)
Where, b is the base of the logarithm that used. Another type of entropy is Joint entropy, which defined as a measure of the uncertainty associated with a set of variables. The joint entropy of two variables and defined as:
(8)
Where and are particular values of and , respectively, P(X,Y) is the probability of these values occurring together.
Joint entropy is used to define the conditional entropy. In information theory, the conditional entropy quantifies the amount of information needed to describe the outcome of a random variable given that the value of another random variable is known. So entropy can be calculated by:
)
(
)
,
(
)
|
(
X
Y
H
Y
X
H
Y
H
(9)Interested reader can refer to [11] for more detail. Some possible interpretations of entropy in software are listed below:
- Entropy of a probability distribution is the expected value of the information of the distribution.
- Entropy is related to how difficult it is to guess the value of a random variable X [13].
- Entropy indicates the best possible compression for the distribution, i.e. the average number of bits needed to store the value of the random variable X.[13]
Entropy is used in various areas; in software engineering field. It is applied to measure the cohesion and coupling of a modular system, design a mathematical model for evaluating software quality and define complexity measures, etc. [14,15,16].Although the use of entropy for measuring software artifacts is not new [13, 16, 17], its use in measuring quality attributes is still limited. This paper presents a new use of entropy
metric for measuring software probability of failure as indicator of an important feature, reliability.
B. The Semantic Metrics
By contrast, with syntactic metrics discussed above, the semantic metrics we discuss in this section reflect the functions the software product defined, rather than how these functions are represented. In particular, we consider the following metrics [1], which are defined using information theory functions.
State redundancy: This metric reflects the extent to which a state is redundant in program, i.e. includes relationships between its various variables; programs that carry much state redundancy are more likely to be able to detect erroneous states, when they arise. It can be measured by simple entropy equation.
) ( ) ( )
(
p H s H (10)H(s) is the entropy of input variables (initial state) and H(σ) is the entropy of output variables(final state).
The state redundancy of the initial state reflects the gap between the minimal size required to store the program state and the size actually reserved [1]. The programmer could reduce this gap by using few variables as possible. The state redundancy of the final state reflects the maximum bandwidth hold between program variables as a result of the execution of the program.[1]
Functional redundancy. This metric reflects the extent to which the function of the program is redundant, i.e. its result is represented in variables that have many relationships between them; programs whose functions are redundant are more likely to be able to detect errors in the results of their function execution, when they arise. The following is the equation.
) ( / )) ( ) ( ( )
(g H S H Y H Y
. (11)Where H(s) is the entropy of input variables and H(Y) is the entropy of output variables.
inputs into common outputs; programs that have high error masking ability are more likely to map erroneous states into correct final states, thereby avoiding failure and making error recovery unnecessary. It simply represented by conditional entropy as follows:
). | ( )
(g H X Y
(12)Where X represents set of input variable values and Y is the correct output value. Entropy function used to map both of them.
Non determinacy. Whereas the previous metrics dealt with the program (more specifically its semantics), this metric deals with the specification of the program, and represents the property that the same input may be mapped to a wide range of possible correct output; specifications that are nondeterministic are more likely to tolerate programs that produce erroneous final states [1]. The following entropy equation can be used to estimate that.
) | ( )
(R H Y X
x (13)
Where X is input variable value, Y is the possible correct output.
Together, these four metrics reflect the ability of a program to be reliable with respect to its specification; unlike syntactic software metrics, they depend on what functions the program computes and what specification the program is intended to satisfy, rather than what form the program takes. Our research plan calls for developing methods that allow us to compute these metrics on arbitrary programs and (formal) specifications, and to analyze the correlation of these metrics with a program’s ability to tolerate faults and avoid failure in practice, at run-time. The following section investigates validation process.
C. Validation
Empirical validation is used to explore correlations between some functional quality attributes such as reliability and fault tolerance. During experiments, the most famous standard programs such as Siemens and Space [18] are selected to test the proposed metrics. The four semantic metrics are applied on 10 programs including: tacs, schedule, schedule2, replace, totinfo,
printtokens, printtokens2, Gzip, Sorting and Space, then the results are recorded for validation purpose. Table I bellow shows brief description about used programs [18].
Table I. Description about Used Programs
Program Name Description
1 Tcas Aircraft collision avoidance system. 2 Schedule2
Are priority schedulers 3 Schedule
4 Replace Performs pattern recognition. 5 Space interpreter for an array definition
language (ADL) 6 Sorting
program
Algorithm receive unordered array then sort it.
7 Printtokins
lexical analysers 8 Printtokins2
9 Totinfo Information gain measure 10 Gzip Unix utility
III.
RESULTS AND DISCUSSION
A. Validation Results
Empirical validation
In this step 8 metrics - 4 syntactic and 4 semantic - are applied on selected programs. Metrics are: McCabe, Halstead, Number of fault, Fault Density in addition to the four semantic metrics. Table II& III shows the results of application of the 8metrics on the selected programs. Both correlation and regression analysis methods are used to explore the relations between syntactic and semantic metrics. Regression is used to identify the much closest relation between applied metrics. It implements a linear regression model. Which means the dependent variable(s) can be written in terms of a linear combination of the independent variable(s) [19]. The following section shows the results for empirical validation step.
Table ‘II’. Semantic Metrics Applied on 10 Selected Programs.
P. name Fun.
Red.
State Red. Non-
injectivity
Non de- terminacy
Space 8.9 65335.6 bit 19200 bits 32 Sorting 14.6 3115 bit 564 bits 564 Totinfo 7.6 254.7 bit 224 bit 32 Printtokins 0.05 364 bits 3180 bits 32 Printtokins2 24.6 660.1 bits 200 bits 32 gzip 0.07 765.4 bits 3000 bit 32
Table ‘III’. Results of Applying Syntactic Metrics on Selected Programs
P. name V(G) V Number
of faults
Fault density
Tcas 26 3800 41 0.01 Schedule2 49 7715 10 0.001 Schedule 37 7785 9 0.001 Replace 92 17293 32 0.001 Space 748 33015 35 0.02 Sorting 6 646 0 0.02 Totinfo 45 9311 23 0.01 Printtokins 72 12922 10 0.01 Printtokins
2 79 9973
7
0.01 Gzip 1260 24149 40 0.0
B. Correlation Analysis
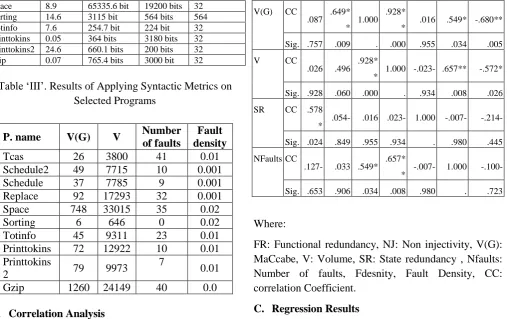
Our goal here is to verify that there is a statistically significant association between attributes estimated by semantic and syntactic metrics. Spearman rank correlation is a common used robust correlation technique [20] because it can be applied even if the association between elements is non-linear. Table IV. Shows that there exists a statistically significant positive relationship between the following:
- Functional redundancy and State redundancy - Non Infectivity and fault density, complexity. - Complexity and volume, number of faults. - Volume and Number of faults and fault density
Table IV. Corelation Results
FR NJ V(G) V SR
NFault s
FDensit y FR CC 1.00
0 .147 .087 .026 .578* -.127- -.258- Sig . .600 .757 .928 .024 .653 .353 NJ CC
.147 1.000 .649* * .496
.054
- .033 -.630* Sig. .600 . .009 .060 .849 .906 .012
V(G) CC
.087 .649* * 1.000
.928*
* .016 .549* -.680** Sig. .757 .009 . .000 .955 .034 .005
V CC
.026 .496 .928*
* 1.000 -.023- .657** -.572* Sig. .928 .060 .000 . .934 .008 .026 SR CC .578
* .054- .016 .023- 1.000 -.007- -.214- Sig. .024 .849 .955 .934 . .980 .445 NFaults CC
.127- .033 .549* .657*
* -.007- 1.000 -.100- Sig. .653 .906 .034 .008 .980 . .723
Where:
FR: Functional redundancy, NJ: Non injectivity, V(G): MaCcabe, V: Volume, SR: State redundancy , Nfaults: Number of faults, Fdesnity, Fault Density, CC: correlation Coefficient.
C. Regression Results
We now compare software metrics built based on syntactic features against those built using semantics. Table V shows the summary of regression results.R2 is a measure of variance in the dependent variable that estimated by the model built using certain predictors [20].
Table V. Summary of Regression Results
Semantic Metric Syntactic and semantic metrics
R2 1 State redundancy Fault Density 0.859 2 Functional
redundancy
MaCcabe 0.501
3 Non_injectivity Fault Density 0.432 4 Functional
redundancy Number OfFaults
0.259 5 Non_injectivity State redundancy 0.205
6 Non_injectivity MaCcabe 0.213
7 Functional redundancy
Voulume 0.110
8 Functional
Redundancy Number Of Faults 0.029 9 Non_injectivity
10 State redundancy MaCcabe 0.010 11 State redundancy Functional redundancy 0.006 12 Non_injectivity Functional redundancy 0.002
D. Analytical Model
consider the fault lifecycle and find a way to measure the probability of failure according to that. The main factors considered are:
1. Existence of a fault 2. Fault sensitization 3. Fault propagation 4. Specification violation
The semantic metrics discussed above considered for measuring these factors as indicator of failure probability.
Assuming a fault exists, the probability of a faulty code to be executed is p1. If a faulty code is executed, the probability of error generation is p2. If errors are generated, the probability of these errors resulting into failure is p3. Another factor should be considered to reflect whether the resulting failure is violating the specification or not this is p4. Thus, the probability of a software fault resulting into a failure is product of P1, P2, p3 and P4. The following section describes how to measure these factors:
1. Probability of executing faulty statements:
If we assume fault exists as mentioned so, the probability to execute the part of code contains fault depends on faults density in contrast to program length in Line of code (LOC). So, the proposed measure considers both fault density and program length.
P1 = 1(1-fault density)^N.
Where N represents software size measured in Lines of code
2. Probability of sensitization:
If we assume faulty code was executed, then, there are two cases. Either the executed fault causes an error or not causes an error. Error here means state that is different from the expected state. The proposed measure considers two semantic measures, non- injectivity and state redundancy metrics. Non-injectivity used to figure out the probability of error masking if fault cause an error and initial state redundancy estimate whether the software willing to find faults.
P2 = 1-2( Nj –initial state redundancy ) = 1-2 ( Nj- K(Ϭ ) )
3. Probability of error propagation
Error propagation means that the executed faulty code cause an error and the error cause the program final state to be erroneous, so, to measure such case both non-injectivity and H(Ϭ) represents the entropy of outputs.
= (1-2)NJ–H(Ϭ))
4. Probability of specification violation:
A program may fail to compute its intended function and yet still behave according to the specification it is intended to satisfy [1]. It is important to measure probability of specification violation to estimate to what extend software still valid if the final state deviate from the correctness . Non-determinacy and entropy of output integrated here. The proposed measure is:
Probability of specification violation (intolerance) =
(1- 2) ND– H( Ϭ f )
Where H(Ϭ f) represents the entropy of final state.
E. Analytical Model Results
To predict failure probability as discussed the product of the above factors are measured. Table VI shows failure probability for the sample programs. It is important to note that the value of probability of failure will be between 0 and 1. So, according to that if failure probability equals to or nearly equal to 1 so reliability will be low and vies versa.
The probability of failure =P1 x P2 xP3 x P4.
Table VI. Measurement of Failure Probability
P. name P1 P2 P3 P4 P(Failure ) Tcas 0.8243 1 1 0.9 0.7416 Schedule2 0.312 1 1 0.9 0.2808 Schedule 0.663 1 0.9 0.99 0.59073 Replace 0.432 1 1 0.9 0.3888
Space 1 1 1 1 1
Sorting 0.635 1 1 1 0.635 Totinfo 0.9966 1 1 0.59 0.59198
F. Discussion
proposed semantic metrics contribute to the estimation of the three main factors of software fault tolerance which is: Error detection:, error masking and error recovery, that enable to provide good prediction of reliability in early stages. State and functional redundancy gives indicator to error detection, error masking could be measured by using non injectivity metric and recovery touched by non-determinacy metric, so, the combination of these metrics provide a good early estimation of reliability.
IV.
CONCLUSION AND FUTURE WORK
The study touched an important attribute such as fault tolerance as an indicator of software reliability by using semantic metrics that inspect source code and (formal) specifications. Our semantic metrics derived in goal-oriented manner, and then validated to insure their validity. The results insure program’s ability to tolerate faults and avoid failure in practice, at run-time can be estimated from its semantic. Future work will concern with developing analytical/ statistical model for reliability prediction from other semantic attributes, and automation of semantic metrics tool to simplify measurement process based on concept of bandwidth of an assertion.
V.
ACKNOWLEDGMENT
I wish to thank Prof. Ali Mili for his valuable advices, which contributed to the completion of this work.
VI.
REFERENCES
[1]. A. Mili, A. Jaoua, M. Frias, Rasha Gaffer M. Helali. Semantic Metrics for Software Products. Innovations in Systems and Software EngineeringA NASA Journal ISSN 1614-5046r, April 2014.
[2]. W. Afzal, "Metrics in software test planning and test design process,” Blekinge Institute of Technology, 2007
[3]. A. Rau, Steinbeis Transferzentrum Softwaretechnik,. A Whitepaper on Metrics. 1998, 1999, 2001. avilable online at: http://www.it.fhtesslingen.de/~rau/forschung/metr ics.htm.
[4]. Mills, E. verald E. Software Metrics, SEI Curriculum Module SEI-CM-12-1.1, Carnegie Mellon University, A good overview of product
and process metrics with an exhaustive bibliography 1988.
[5]. Joe Schofield, The Statistically Unreliable Nature of Lines of Code, CrossTalk, 18(4):29-33, April 2005. Available at http://www.crosstalkonline.org/storage/issue-archives/2005/200504/200504-Schofield.pdf [6]. Norman E.Fenton, Shari Lawrence Pfleeger,
Softwai Metrics A Rigorous & Practical Approach, SECOND EDITION, PWS PUBLISHING COMPANY , 20 Park Plaza, Boston, MA 021 16-4324.
[7]. Gall, C. S. Inf. Technol. & Syst. Center, Univ. of Alabama in Huntsville, Huntsville, AL Lukins, Stacy K.; Etzkorn, Letha H.; Gholston, Sampson; Farrington, Phillip A.; Utley, Dawn R.; Fortune, J.; Virani, Shamsnaz, Semantic software metrics computed from natural language design specification. Volume: 2 , Issue: 1 Page(s): 17 – 26.2008.
[8]. Etzkorn, Letha H. "Semantic metrics, conceptual metrics, and ontology metrics: an analysis of software quality using IR-based systems, potential applications and collaborations." Proc. Int. Conf. Software Maintenance. 2006.
[9]. Bo Hu, Yannis Kalfoglou, Harith Alani, David Dupplaw, Paul Lewis, Nigel Shadbolt Semantic metrics, Managing Knowledge in a World of NetworksLecture Notes in Computer ScienceVolume 4248, 2006, pp 166-181.
[10]. Fazlollah M. Reza (1961, 1994). An Introduction to Information Theory. Dover Publications, Inc., New York. ISBN 0-486-68210-2.
[11]. I Csiszar and J Koerner. Information Theory: Coding Theorems for Discrete Memoryless Systems. CambridgeUniversity Press, 2011. [12]. Shannon, C.E. (1948), "A Mathematical Theory
of Communication", Bell System Technical Journal, 27, pp. 379–423 & 623–656, July & October, 1948
[13]. Panchenko, Oleksandr, Stephan H. Mueller, and Alexander Zeier. "Measuring the quality of interfaces using source code entropy." Industrial Engineering and Engineering Management, 2009. IE&EM'09. 16th International Conference on. IEEE, 2009.
[15]. Yi T. and Wu F., Empirical Analysis of Entropy Distance Metric for UML ClassDiagrams, ACM SIGSOFT Software Engineering Notes, 2004. [16]. Goise, Francois & Olla, Stefano (2008). Entropy
methods for the Boltzmann equation: lectures from a special semester at the Centre Émile Borel, Institut H. Poincaré, Paris, 2001. Springer. p. 14. ISBN 978-3-540-73704-9
[17]. Amrit Dhillon, Amrinder Singh, Analysis of Software Metrics for Bubble Sort and Selection Sort. International Journal of Computer Applications & Information Technology Vol. 1, No.1, July 2012.
[18]. Subject Infrastructure Repository, online at: http://sir.unl.edu/portal/index.php.
[19]. Regresstion analysis , avilable online at: https://onlinecourses.science.psu.edu/stat501/node /165.