_____________________________________________________________________________________________________
*Corresponding author: E-mail: [email protected];
14(4): 1-10, 2018; Article no.JAERI.40257
ISSN: 2394-1073
Effect of Storage Methods on the Physico-Chemical
and Sensory Attributes of ‘Gari’ Processed from
Stored Cassava Roots Varieties
O. O. Olaleye
1,2*, S. S. Afolayan
1,2, T. O. Aondo
2and A. B. Adeniyi
21Nigerian Stored Products Research Institute, Km 3 Asa-Dam Road, Ilorin, Kwara State, Nigeria. 2Centre for Food Technology and Research, Benue State University, Makurdi, Nigeria.
Authors’ contributions
This work was carried out in collaboration between all authors. Author OOO performed laboratory experiments and wrote the manuscript. Author SSA contributed in laboratory experiments and sensory organoleptic assessment. Authors TOA and ABA are reviewers of the manuscript. All authors read and approved the final manuscript.
Article Information
DOI: 10.9734/JAERI/2018/40257 Editor(s): (1) N. Karunakaran, Department of Economics and Vice-Principal, EK Nayanar Memorial Govt. College, Elerithattu, India. Reviewers: (1) Małgorzata Gniewosz, Warsaw University of Life Science, Poland. (2) Patrícia Matos Scheuer, Federal Institute of Santa Catarina, Brazil. Complete Peer review History:http://www.sciencedomain.org/review-history/24389
Received 27th January 2018 Accepted 6th April 2018 Published 30th April 2018
ABSTRACT
Cassava roots start to deteriorate within 2-3 days after harvest when not processed. This has posed a serious challenge to both farmers and processors alike due to lack of appropriate storage techniques. Efforts made in the past to proffer solution to these problems have centered on the successful storage of cassava roots for few weeks with a little investigation on the changes in quality attributes of cassava roots during storage. Physico-chemical and sensory analysis were evaluated in this study using standard methods; as the stored cassava roots were processed into ‘gari', at an interval of two weeks for six weeks. The moisture content of the stored root was affected by the relative humidity of the environment. An interaction between the storage period, methods, and physicochemical composition, except moisture content and protein, were not significant at P< 0.05 from a fresh product. Average acceptability score for ‘gari' processed from cassava roots stored in a trench is higher than those produced from roots stored in moist sawdust. However, the study shows a significant difference (p<0.05) between the ‘gari’ processed from cassava roots stored using the
two storage methods and that produced from the controls (fresh or 0 day). The study suggested that acceptability of ‘gari' processed from cassava roots stored in trench for four weeks is the
highest.
Keywords: Deteriorate; appreciate; relative humidity; moist sawdust; trench; ‘Gari’.
1. INTRODUCTION
Cassava roots, Manihot esculenta Crantz, have been reported as the most important of root and tuber crops in the tropics [1,2]. The importance of cassava roots has been attributed to its significant source of calorie; serving as food for man and livestock [3,4]. In Nigeria, the main food products from cassava roots are gari, fufu and lafun. Additionally, IITA is promoting inclusion of high-quality cassava flour with wheat flour for confectionery (at up to 20% inclusion for baking of bread). Cassava also serves as industrial raw material, mainly as starch [5,6] for use in textile industries, pharmaceuticals and in a production of adhesives.
The belief of farmers is that cassava cannot be stored post-harvest. That is, harvested cassava should be utilized immediately (consumption, processing or sale) to avoid losses to
deterioration or wastage, while IITA
recommended that freshly harvested cassava roots (within 24 hours of harvest) should be used for the production of high-quality cassava flour. Physiological deterioration of cassava roots sets in 2 - 3 days (with dehydration and internal discoloration or streaking), while microbial deterioration follows in 3 - 5 days under tropical ambient temperature and relative humidity conditions [7,8]. Over matured cassava roots in the field become less acceptable or rejected out rightly, as they become woody and inedible [9]. In any case, [10] reported of traditional ground storage of cassava roots to maintain freshness of the roots until needed for sale, processing or consumption.
Towards appropriate technology development, moist sawdust in baskets or in wooden boxes at small scale (or domestic level) and use of Cassava Warehouse for large scale of cassava roots has been suggested. However, there is need for more work to establish other limits and benefits of the recommended methods for promotion and encouragement of adoption of
these storage methods and further the
developments of the application. Meanwhile, storage quality may be very different from utilization quality. Akingbala et al. [11] reported
that cassava food utilization properties change long before physical deterioration is observed in
stored roots. Therefore, physicochemical
analysis and sensory evaluation studies on stored cassava roots products, is essential in the establishment of suitability limits for storage for cassava roots under warm tropical temperature. Hence, this study was conceived to investigate the effects of the recommended cassava storage methods in the circumstances of use on the retention of freshness, chemical composition and sensory attributes of cassava roots varieties during storage.
2. MATERIALS AND METHODS
2.1 Material Selection
Cassava roots used for this study were 15 months old bitter variety (TMS 30572) and sweet varieties (TMS 4(2)1425) lots harvested by gently lifting out the roots from Gede farm settlement in Ayede Ekiti, Nigeria. The harvesting was done when the soil was still wet and soft after a fairly heavy rain to minimize damage in the call for carefulness in the handling by [12]. Harvesting of the roots was done with part of the stem (2 – 5 cm) still attached to limit ingress of decay into the roots [13]. The trimmed freshly harvested cassava roots lots were carefully transported in Pick-Up Van under leave cover to Nigerian Stored Products Research Institute, Ilorin. Palm frond was obtained from a farm along Asa-Dam Road, Ilorin for use in the cassava Trench. Fresh sawn Sawdust was obtained in bags from Irewolede Saw Mill, also near Nigerian Stored Products Research Institute, Ilorin for use in cassava warehouse. The cassava roots obtained were sorted for visibly wholesome ones and respectively shared into 2 sub-lots each, for storage in Trench or Moist Sawdust [13] at Nigerian Stored Products Research Institute, Ilorin.
2.2 Monitoring of Temperature and
Relative Humidity under Storage Sheds
storage of cassava roots by attaching Thermo-hygrometers model No JB913R by Oregon Scientific to the storage structures.
2.3 Sampling of Stored Cassava Roots and Preparation for Analysis
Random samples were drawn of initial and stored cassava roots (at 2 weekly intervals) for analysis. On each occasion, cassava roots analytical sample consisted of portions from top, middle, and bottom level in storage. The cassava roots picked at random were processed into gari.
2.4 ‘Gari’ Production
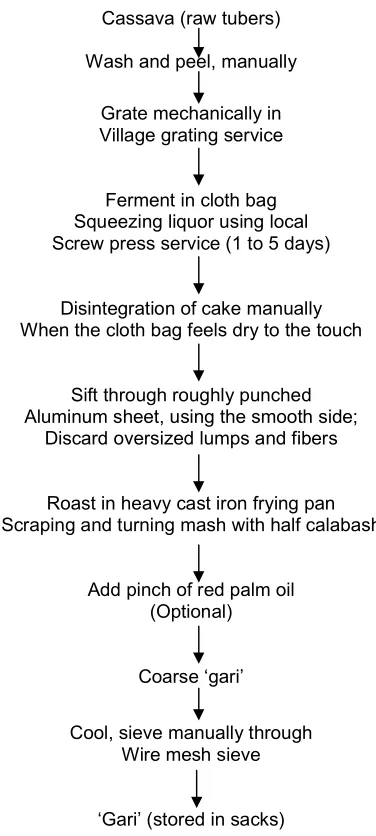
Cassava (raw tubers)
Wash and peel, manually
Grate mechanically in Village grating service
Ferment in cloth bag Squeezing liquor using local Screw press service (1 to 5 days)
Disintegration of cake manually When the cloth bag feels dry to the touch
Sift through roughly punched Aluminum sheet, using the smooth side;
Discard oversized lumps and fibers
Roast in heavy cast iron frying pan Scraping and turning mash with half calabash
Add pinch of red palm oil (Optional)
Coarse ‘gari’
Cool, sieve manually through Wire mesh sieve
‘Gari’ (stored in sacks)
Fig. 2.2. Flow chart for ‘gari’ production Source: Onyekwere et al. [14]
2.5 Determination of Physico-chemical Properties
The physico-chemical properties (pH, Total titratable acidity, Protein, Ash, Fat, crude fibre) was determined by the method described in [15].
2.5.1 Determination of pH
A pH meter model pH211 microprocessor (Hannah instrument) was used to determine the pH. The meter was switched on and left for 30mins to stabilize. It was then standardized with solutions of buffer 4 and buffer 7 by first immersing the electrode of the meter into the buffer 4 and reading the value on the meter scale and then immersed in distilled water before immersing the electrode in buffer 7. 100 ml sterile distilled water was added to 10 g of sample (‘gari’) stirred into slurry and allowed to settle. The supernatant was decanted and its pH
(supernatant) was determined using the
standardized pHmeter.
2.5.2 Total titratable acidity
About 10 g of the ‘gari’ sample was homogenized separately with 100 ml sterile distilled water and titrated to pH 8.3 with sodium hydroxide solution (0.1M) using phenolphthalein as indicator. The titratable acidity was expressed as lactic acid equivalent [15].
Calculation:
% Lactic acid = . .
2.5.3 Determination of protein content
Protein content of the test samples were determined using micro Kjedhal method as described in AOAC, [15]. One gram of test sample was weighed into digestion tube, 15 ml of concentrated H2SO4 and one tablet of selenium
carried out into the acid solution in the receiving flask with the delivery tube below the acid level. As the distillation was going on, the pink colour solution of the receiving flask turned blue. Distillation was continued until the content of the round bottom flask is about 50 ml.The resulting solution in the conical flask was titrated with 0.1M HCl.
%Nitrogen = . . /
% Protein = % Nitrogen x protein conversion factor (6.25).
2.5.4 Determination of fibre content
The fibre content was determined by the method described in AOAC, [15]. Two grams of sample were accurately weighed into fibre flask and 100 ml of 0.255N H2SO4 was added. The mixture was
then heated under reflux for one hour with the heating mantle and the hot mixture was filtered through a fibre sieve cloth. The filtrate was thrown off while the residue was returned to the fibre flask to which 100 ml of 0.313N NAOH was added and heated under reflux for another one hour. The mixture was filtered through a fibre sieve cloth and 10 ml of acetone was added to dissolve any organic constituent. The residue was washed with some hot water twice on the sieve cloth before it was finally transferred into the crucible. The crucible containing the residue was cooled in the desiccators and later weighed to obtained weight W2. The different W1-W2
gives the weight of fibre and the percent fibre was obtained as:
%fibre =
W1= initial sample weight; W2= weight of residue
2.5.5 Determination of Ash content
The ash content was determined as described in AOAC [15]. The crucible was weighed and dried in the oven. It was then allowed to cool in a dessicator and weighed again. About 3 g of dry material was weighed into an empty porcelain crucible which has been previously ignited over a hot plate in fume cupboard. It was then placed in a muffle furnace maintained at a temperature of 600°C for 6 hours and after the crucible was transferred directly to a dessicator, cooled and weighed immediately. The percentage ash was calculated by difference in weight (initial weight of sample –weight of sample after ashing).
% Ash =
2.5.6 Determination of moisture content
The moisture content of the test sample was determined using infrared moisture determination balance AD-4714A, (Centurion scientific Ltd). Following the manual recommendation, 5g of sample was weighed into a clean dried dish. The sample was then placed in the infrared moisture determination balance. The temperature was regulated to 105°C for 30 mins. The moisture content was indicated automatically by the reader on the machine.
2.5.7 Determination of fat content
About 5 g each of the sample was weighed and wrapped in a filter paper and placed in an extraction thimble. The thimble was weighed before the addition of the sample, (W1), the thimble with sample (W2) was then inserted in soxhlet apparatus. Extraction under reflux was carried out with petroleum ether (30 – 60°C boiling range) for 5 h. At the end of the extraction, thimble was dried in an oven for about 30 mins at 100°C for the evaporation of the solvent and the thimble was allowed to cool in a dessicator and later weighed (W3) [15]
% Fat = –
( – )
2.6 Organoleptic Assessment
Sensory evaluation was carried out using a twenty-member panel of judges consisting people familiar with ‘gari’. ‘Gari’ was prepared into ‘eba’. Each ‘gari’ produced from cassava from the two storage methods and the two varieties were labeled and presented in a plate to the panelist in a well-lighted room. Each panelist were asked to indicate their preference, by scoring using a nine point hedonic scale, with 9 representing like extremely, 5 neither like nor dislike, 1 dislike extremely [16] to express their degree of like or dislike of each of ‘gari’ and ‘fufu’. The quality factors that were assessed for the ‘gari’ are; appearance colour, taste, aroma, texture and overall acceptability.
2.7 Statistical Analysis
social science (SPSS) version 11.00 SPSS Inc., Chicago, IL, USA at the 0.05 level.
3. RESULTS AND DISCUSSION
3.1 Environmental Condition in the
Storage Medium
The average temperatures and relative humidity recorded in the cassava warehouse and around the trench shed were similar and fluctuation was not pronounced in the two storage systems (Table 1). A close examination of Table 1 shows a direct relationship between the relative humidity of the storage environment and the moisture content of both the bitter and sweet cassava roots over storage period. A reduction in the relative humidity of the storage environment resulted in a decrease in the moisture content of the stored cassava. For cassava stored in trench, a reduction in relative humidity from 80.50% to79.67% resulted in a decrease in moisture content from 57.70% to 55.20% for bitter cassava and 59.90% to 57.50% for sweet cassava. While a reduction in relative humidity from 81.20% to 80.07% resulted in a decrease in moisture content from 57.70% to 55.60% for bitter cassava and 59.90% to 57.90% for sweet cassava for cassava tubers stored in moist sawdust in the cassava warehouse. This is so because the cassava tubers tend to equilibrate with the relative humidity of the storage environment.
3.2 Physico-chemical Properties
The pH values of the ‘gari’ processed after storage were presented in Fig. 1A ‘Gari’ show series of increase and decrease in the pH value. However ‘gari’ produced from bitter cassava roots variety (TBCG and SDBCG) stored in trench and sawdust respectively, had the same value at each of the storage week investigated. This shows that storage method had no effect on pH of ‘gari’ produced from bitter cassava roots variety but storage period has an effect as can be seen in Fig. 1. The pH of food products is an important factor which affects their shelf life and the decrease in pH might not be unconnected
with the duration and effectiveness of
fermentation of the cassava mashed used for the fermentation of ‘gari’.
Fig. 1B shows the effects of storage period on titratable acidity (TTA) value of cassava products processed after storage. ‘Gari’ produced from bitter cassava roots variety (TBCG and SDBCG)
stored in trench and sawdust respectively, had the same titratable acidity (TTA) value at each of the storage week investigated. ‘Gari’ produced from sweet cassava roots variety (TSCG and
SDSCG) stored in trench and sawdust
respectively shows a decrease in TTA value from 0 to 6th week’s storage period. [17] reported that acidity might be due to the synthesis of lactates, acetates and some volatile organic acids. Hence the reduction in TTA values of some of the products might be due to loss of some volatile
components like hydrocyanic acid (HCN)
produced from the hydrolysis of the
cyanoglucoside.
3.3 Proximate Composition of Different Cassava Products Processed after Storage
The carbohydrate content curve for processed product ‘gari’ after storage is shown in Fig. 2A. The carbohydrate content curve shows series of increase and decrease during the storage period. The carbohydrate content curve of SDBCG and SDSCG curve increased gradually from 0th to 4th weeks before decreasing to the 6th week of storage. Gari Product, TBCG curve decreased steadily from 0th to 6th weeks of storage. While TSCG curve decreased from 0th to 2nd before increasing to the 6th week of storage. The fluctuation of the carbohydrate content in some of the cassava products might not be unconnected with physiological process brought about by the development of rootlets observed at the bottom part of some of the tubers and at the top, the growth of leaves for both varieties of cassava tubers stored in moist sawdust and trench. A decrease in carbohydrate content during storage for six weeks agrees with the findings of [8]. Incipient quality deterioration starts after the roots have reached maturity, e.g. starch content decreases while fibre increases [10]. Also, processing methods and the activity of microorganism on the cassava roots during
storage and processing must have caused the fluctuation in carbohydrate content of the
‘gari’.
The decrease in the carbohydrate content of the cassava roots could be attributed to the possible
secretion of some extracellular enzymes
6
Table 1. Average moisture content, temperature and relative humidity in trench and cassava storage house (moist sawdust)
(weeks) Trench Sawdust
Temp °C RH (%) Bitter cassava
moisture content (%)
Sweet cassava moisture content (%)
Temp °C RH (%) Bitter cassava
moisture content (%)
Sweet cassava moisture content (%)
0 2 4 6
24.50±0.08 24.83±0.05 24.59±0.08 24.36±0.08
80.50±0.06 80.20±0.09 79.90±0.06 79.67±0.09
57.70±0.09 56.80±0.07 56.70±0.08 55.20±0.09
59.90±0.08 58.40±0.08 58.30±0.06 57.50±0.09
24.39±0.05 24.77±0.06 24.67±0.05 24.83±0.07
81.20±0.07 80.80±0.08 80.50±0.07 80.07±0.04
57.70±0.07 56.70±0.07 56.50±0.08 55.60±0.07
59.90±0.08 58.50±0.07 58.40±0.08 57.90±0.08
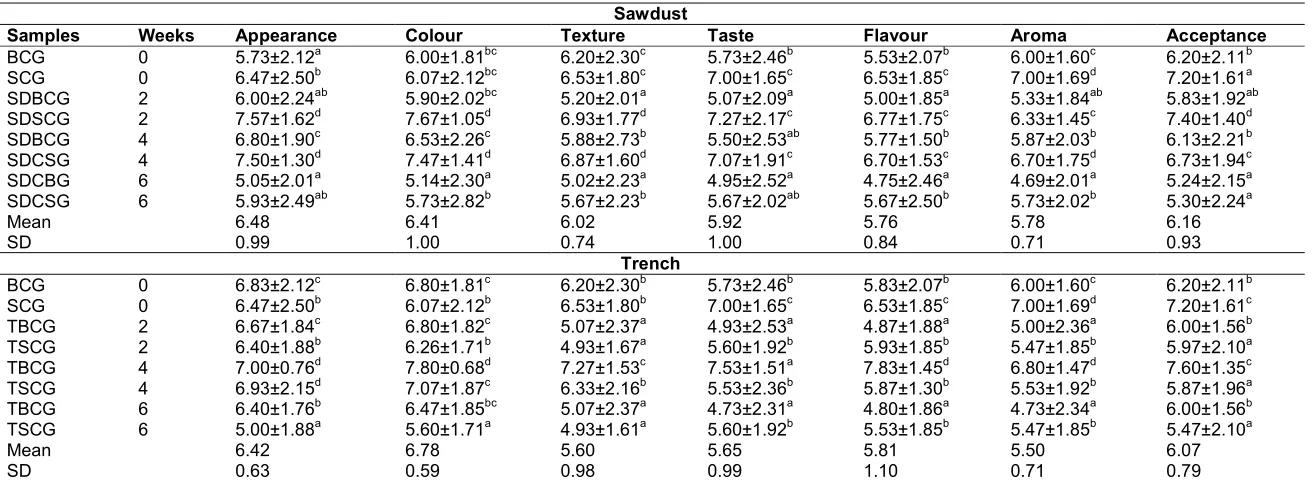
Table 2. Means of score of sensory evaluation of ‘Gari’ produced from two varieties of cassava stored in trench and moist sawdust
Sawdust
Samples Weeks Appearance Colour Texture Taste Flavour Aroma Acceptance
BCG 0 5.73±2.12a 6.00±1.81bc 6.20±2.30c 5.73±2.46b 5.53±2.07b 6.00±1.60c 6.20±2.11b
SCG 0 6.47±2.50b 6.07±2.12bc 6.53±1.80c 7.00±1.65c 6.53±1.85c 7.00±1.69d 7.20±1.61a
SDBCG 2 6.00±2.24ab 5.90±2.02bc 5.20±2.01a 5.07±2.09a 5.00±1.85a 5.33±1.84ab 5.83±1.92ab
SDSCG 2 7.57±1.62d 7.67±1.05d 6.93±1.77d 7.27±2.17c 6.77±1.75c 6.33±1.45c 7.40±1.40d
SDBCG 4 6.80±1.90c 6.53±2.26c 5.88±2.73b 5.50±2.53ab 5.77±1.50b 5.87±2.03b 6.13±2.21b
SDCSG 4 7.50±1.30d 7.47±1.41d 6.87±1.60d 7.07±1.91c 6.70±1.53c 6.70±1.75d 6.73±1.94c
SDCBG 6 5.05±2.01a 5.14±2.30a 5.02±2.23a 4.95±2.52a 4.75±2.46a 4.69±2.01a 5.24±2.15a
SDCSG 6 5.93±2.49ab 5.73±2.82b 5.67±2.23b 5.67±2.02ab 5.67±2.50b 5.73±2.02b 5.30±2.24a
Mean 6.48 6.41 6.02 5.92 5.76 5.78 6.16
SD 0.99 1.00 0.74 1.00 0.84 0.71 0.93
Trench
BCG 0 6.83±2.12c 6.80±1.81c 6.20±2.30b 5.73±2.46b 5.83±2.07b 6.00±1.60c 6.20±2.11b
SCG 0 6.47±2.50b 6.07±2.12b 6.53±1.80b 7.00±1.65c 6.53±1.85c 7.00±1.69d 7.20±1.61c
TBCG 2 6.67±1.84c 6.80±1.82c 5.07±2.37a 4.93±2.53a 4.87±1.88a 5.00±2.36a 6.00±1.56b
TSCG 2 6.40±1.88b 6.26±1.71b 4.93±1.67a 5.60±1.92b 5.93±1.85b 5.47±1.85b 5.97±2.10a
TBCG 4 7.00±0.76d 7.80±0.68d 7.27±1.53c 7.53±1.51a 7.83±1.45d 6.80±1.47d 7.60±1.35c
TSCG 4 6.93±2.15d 7.07±1.87c 6.33±2.16b 5.53±2.36b 5.87±1.30b 5.53±1.92b 5.87±1.96a
TBCG 6 6.40±1.76b 6.47±1.85bc 5.07±2.37a 4.73±2.31a 4.80±1.86a 4.73±2.34a 6.00±1.56b
TSCG 6 5.00±1.88a 5.60±1.71a 4.93±1.61a 5.60±1.92b 5.53±1.85b 5.47±1.85b 5.47±2.10a
Mean 6.42 6.78 5.60 5.65 5.81 5.50 6.07
SD 0.63 0.59 0.98 0.99 1.10 0.71 0.79
Higher value indicates greater preference. Values are Means ± SD (n = 20), Column with different superscripts are significantly different at p<0.05
(A)
Fig. 1. Effect of storage Period on: (A) pH value, (B) Titratable activity of different cassava products processed af
Key:TBCG= Trench bitter cassava ‘gari’, TSCG=Trench sweet cassava ‘gari’, SDBCG=Sawdust bitter cassava ‘gari’, SDSCG= Sawdust sweet cassava ‘gari’.
On the x-axis, 1,2,3 and 4 represent 0,2,4,and 6weeks respectively
(A)
(C)
Fig. 2. Effect of storage methods and period on: (A) Carbohydrate, (B) Protein, (C) Ash, (D) Crude fibre, (E) Fat content of different cassava products processed after storage Key:TBCG=Trench bitter cassava ‘gari’, TSCG=Trench sweet cassava
‘gari’, SDSCG= Sawdust sweet cassava ‘gari’ 2
4 6
1 2 3 4
p
H
Storage period (wks)
79 80 81 82 83
0 5 10
C ar b o h yd ra te ( % )
Storage period (wks)
0 0.5 1 1.5 2
0 5 10
A
sh
(
%
)
Storage period (wks)
0 0.2 0.4 0.6 0.8 0 1 Fa t (% ) (B)
Fig. 1. Effect of storage Period on: (A) pH value, (B) Titratable activity of different cassava roducts processed after storage
Key:TBCG= Trench bitter cassava ‘gari’, TSCG=Trench sweet cassava ‘gari’, SDBCG=Sawdust bitter cassava ‘gari’, SDSCG= Sawdust sweet cassava ‘gari’.
axis, 1,2,3 and 4 represent 0,2,4,and 6weeks respectively
(B)
(D)
(E)
Fig. 2. Effect of storage methods and period on: (A) Carbohydrate, (B) Protein, (C) Ash, (D) Crude fibre, (E) Fat content of different cassava products processed after storage
Trench bitter cassava ‘gari’, TSCG=Trench sweet cassava ‘gari’, SDBCG=Sawdust bitter cassava ‘gari’, SDSCG= Sawdust sweet cassava ‘gari’
TBCG TSCG SDBCG SDSCG 0 0.2 0.4 0.6
1 2 3 4
Ti tr at ab le a ci d it y
Storage period (wks)
10 TBCG TSCG SDBCG SDSCG 0 1 2 3 4
0 5 10
P ro te in ( % )
Storage period (wks)
10
TBCG TSCG
SDBCG
SDSCG 01
2 3 4 5 0 5 C ru d e fi b re ( % )
Storage period (wks)
2 3 4 5 6 7
Storage period (wks)
TBCG TSCG
SDBCG SDSCG
Fig. 1. Effect of storage Period on: (A) pH value, (B) Titratable activity of different cassava
Key:TBCG= Trench bitter cassava ‘gari’, TSCG=Trench sweet cassava ‘gari’, SDBCG=Sawdust bitter cassava
Fig. 2. Effect of storage methods and period on: (A) Carbohydrate, (B) Protein, (C) Ash, (D) Crude fibre, (E) Fat content of different cassava products processed after storage
Fig. 2B shows the effect of storage period on the protein content of cassava products processed after storage. The gari products show an increase in the protein content during storage, but SDSCG and TSCG curve initially showed a decrease from 0th to 2nd week of storage and later increased from 2nd to 6th week of storage. TBCG protein content increased from 0th week to the 2nd week, then decreased in value at 4th week and then increased again by the 6th week. The increase in the protein content of the cassava roots could be attributed to the possible secretion of some extracellular enzymes (proteins) such as amylases, linamarase and cellulase [18] into the cassava roots by the infesting and fermenting organisms in an attempt to make use of the cassava starch in the roots as a source of carbon.
The curve of effects of storage period on the ash content of different cassava products processed after storage is shown in Fig. 2C. All the curve TBCG, SDBCG, TSCG and SDSCG shows an initial decrease in ash content from 0th to 2nd week before increasing in value to the 6th week of storage. The increase in ash content is advantageous since the ash content is the reflection of the mineral contents of the products. SDBCG had the lowest ash content value at 2nd week of storage. The increase in ash content during storage is in line with the findings of [8].
The curves of effect of storage period on crude fibre content of cassava products processed after storage is shown in Fig. 2D ‘Gari’ produced from sweet cassava roots variety (TSCG) stored in trench had the highest crude fibre content at 2nd week of storage, while ‘gari’ produced from bitter cassava (SDBCG) stored in moist sawdust had the lowest at 4th week of storage. The curves for the gari products, exhibit series of increase and decrease in the crude fibre content value. This is in contrast to the findings of [8] which reported that crude fibre increases with increase storage period. Incipient quality deterioration starts after the roots have reached maturity, e.g. starch content decreases while fibre increases [10]. Since there is fluctuation in the carbohydrate content during the six weeks storage period by extension the crude fibre content will also experience a fluctuation in value.
This may be due to the prevailing environmental conditions which aid the developments of shoots and rootlets; microbial activities (infesting and fermenting organisms tends to use up the roots starch as a source of carbon) and processing
operation method. The crude fibre and ash content depend on the quality of fresh roots and processing techniques. [20] claimed that good quality fresh cassava roots which are clean and have minimal or no stems or woody parts will produce cassava roots products with low crude fibre and ash content.
Fig. 2E shows the effects of storage period and methods on fat content of different cassava products processed after storage. The curves of ‘gari’ products show a steady increase in fat content from the 0th week to 6th week of storage. However, TSCG show a slight decrease in value in the 4th week. The reason for the increase in fat content could not be well explained, but could partly be attributed to cell increase from fermentation and possibly the transformation of carbohydrate to fat [21]. Also, Fagbemi and Ijah, [22] reported that certain fungi can produce microbial oil during fermentation. The decrease in fat content may be due to utilization of stored lipids/fat reserve in the roots during physiological changes. The lipids are also source of carbon.
The storage methods (trench and sawdust) have significant effect (p < 0.05) on the proximate composition (moisture content, protein, fat, crude fibre, ash, and carbohydrate) of different cassava products irrespective of the variety.
This is an indication that storage method plays a
crucial role in influencing the chemical
composition of cassava products processed after storage. The effect of interaction between the storage period and proximate composition (ash, crude fibre, fat and carbohydrate) except moisture content and protein was not significant at P< 0.05 from fresh product. These indicate that storage period have a major effect on the moisture content and protein content, but plays no vital role in influencing other chemical composition of the different cassava products.
Results of sensory evaluation of ‘gari’ produced from two varieties of cassava stored in trench and moist sawdust as compared to the control (0 week) is shown in Table 2. The results (scores) of the “gari” colour, appearance, taste, aroma, flavour, texture and acceptability did not show a consistent pattern for all the “Gari” samples, and there was significant difference (p<0.05) in the “gari” samples (2, 4 and 6 weeks) and the control sample.
preferred in terms of all the sensory parameters assessed for ‘gari’ products processed from cassava stored in trench. It shows that longer storage period does not really indicate poor product in as much as the cassava roots is still good physically. Meanwhile, ‘gari' product TSCG processed after 6 weeks in storage was the least preferred in almost all the parameters assessed. For storage in sawdust, SDSCG processed after 2 weeks of storage was the most preferred in almost all the sensory parameter assessed and SDBCG processed after 6 weeks of storage was the least preferred. The higher value indicates greater preference. For the two storage methods, ‘gari’ products having sensory properties higher than the average mean value for the products throughout the six week of storage were more acceptable. While the one having sensory properties lesser than the average mean value were less acceptable. Processing method could have effects on the variation in the sensory properties of ‘gari’.
4. CONCLUSION
The study has revealed that cassava roots can be stored for a period of six weeks in trench and moist sawdust without considerable loss of quality either to the fresh roots or the processed products ‘gari’. This output is particularly important to farmers and processors. Where there are constraints with land use, farmers can make use of the technology while processors can also use the techniques to ensure stability in the supply of cassava products. However, for high quality products the duration of storage should be put at an optimum period of four weeks.
ACKNOWLEDGEMENTS
We acknowledge the support of Nigerian Stored Product Research Institute for cassava root storage facilities uses and the assistance of technical staff in this work.
COMPETING INTERESTS
Authors have declared that no competing interests exist.
REFERENCES
1. FAO. Food and Agricultural Organization
of the United Nations: Production
Yearbook 44, Rome; 1990.
2. Ayoade AR, Adeola RG. Constraints of
domestic industrialization of cassava in Osun State, Nigeria. Ozean Journal of Social Science. 2009;2(2):83–87.
3. Food and Agriculture Organization (FAO). Functional properties of starches; 2000. Available:http://www.fao.org/ag/ags/Agsi/a gsi.htm
4. Mroso PV. Cassava: An emerging food
product: The consequence of its popularity; 2003.
Available:http//www.suite1101.com/article. Cfm/16738/999964
5. Oluwole OB, Olatunji OO, Odunfa SF. A process technology for conversion of dried cassava chips into gari. Nigerian Food Journal. 2004;23:65-73.
6. Maziya-Dixon B, Dixon AGO, Adebowale
AA. Targeting different end uses of
cassava genotype variations for
cyanogenic potentials and pasting.
International Journal of Food Science and Technology. 2007;42:969-976.
7. Akingbala JO, Oyewole Uzo-Peters I,
Karim OR, Baccus-Taylor GSH. Evaluating stored cassava quality in gari production. Journal of Agriculture and Environment. 2005;3:75-80.
8. Karim OR, Fasasi OS, Oyeyinka SA. Gari yield and chemical composition of cassava stored using traditional methods. Pakistan Journal Nutrition. 2009;8(12):1830-1833.
9. FIRRO. Cassava production, processing
and utilization in Nigeria in
Commemoration of the 50th Anniversary of Federal Institute of Industrial Research, Oshodi; 2006.
10. Bokanga M. Root crops biofuels and food security in Africa. In: 10th Triennial Symposium Jointly Organized by the ISTRC-AB and Mozambique Agrarian
Research Institute (IIAM). Joaquim
Chissano International Conference Centre, Maputo; 2007.
11. Akingbala JO, Osunsami AT, Oguntimehin
GB. Effect of storage on starch content
and modification of cassava.
Starch/Starke. 1989;41:54-57.
12. Osunde ZD, Fadeyibi A. Storage methods and some uses of cassava in Nigeria. Continental Journal Agricultural Science. 2011;5(2):12-18.
13. NSPRI. National Training Workshop for
Women –In –Agriculture. Organized by
Nigerian Stored Products Research
14. Onyekwere OO, Akinrele IA, Koleoso OA,
Heys G. Industrialization of gari
fermentation. In: Industrialization of
Indigenous Fermented Foods 2nd Ed.
Steinkraus, Ed. Marcel Dekker Inc., New York and Basel; 2004.
15. AOAC. Official method of analysis. 14th Edition Association of Official Analytical Chemist; Washington DC; 2000.
16. Larmond E. Methods for sensory
evaluation of food. Food Research
Institute, Central Experimental Farm,
Ottawa, Canada. Publication No: 1683; 1977.
17. Oyewole OB, Odunfa SA. Microbiological studies on cassava fermentation for lafun production. Food Microbiology. 1989;5: 125-133.
18. Oboh G, Akindahunsi AA. Biochemical
changes in Cassava products (flour and
gari) subjected to Saccharomyces
cerevisiae solid media fermentation. Food Chemistry. 2003;82(4):599-602.
19. Lehninger AL. Bioenergetics and
metabolism, principle of biochemistry, 2 ed. New Delhi: CBS Publishers and Distributors; 1987.
20. Fasuyi AO, Aletor VA. Varietal composition and functional properties of cassava (Manihot esculentum, Cranzt) leaf meal and leaf protein concentrates. Pakistan Journal of Nutrition. 2005;4(1):43-49.
21. Padmaja GS, George M, Moorthy SN.
Detoxification of cassava during
fermentation with a mixed culture
inoculums. Journal of the Science of Food and Agriculture. 1993;63:473-481.
22. Fagbemi AO, Ijah UJJ. Microbial
population and biochemical changes
during production of protein enriched fufu.
World Journal of Microbiology and
Biotechnology. 2006;22:635-640. ________________________________________________________________________________
© 2018 Olaleye et al.; This is an Open Access article distributed under the terms of the Creative Commons Attribution License
(http://creativecommons.org/licenses/by/4.0), which permits unrestricted use, distribution, and reproduction in any medium,
provided the original work is properly cited.
Peer-review history: