Examining Meta-Analytic Approaches
For Evaluating Multi-Year Wellness
Program Impact: An Example From
The Health And Human Service Arena
Karen H. Larwin, Youngstown State University, USA David A. Larwin, Kent State University Salem, USA
ABSTRACT
The current investigation examines the use of meta-analysis to evaluate the impact of a community-wide health care initiative across a four-year period. This community-wide initiative began in an effort to create a “healthy community” in a small mid-western city. This multi-level, longitudinal study incorporates the use of meta-analysis in an effort to examine treatment effects across the areas of knowledge of health issues, reported healthy behaviors, and clinical measures. Issues regarding the challenges associated with the synthesis of different types of effect size measures across time, as well as concerns associated with multi-site repeated measure responses, are presented. Results of the effect size analyses are presented using odds ratios.
Keywords: Wellness Program; Program Evaluation; Meta-Analysis
INTRODUCTION
he preponderance of research conducted using meta-analytic techniques involves data extracted from completed research studies. However, it is possible to use the same techniques implemented for secondary data on primary data (Borenstein et al, 2009). These applications are especially useful in evaluation and research studies where longitudinal data is being analyzed across multiple groups.
In a recent review of the literature, Jones, Riley, Williams, & Whitehead (2009) found 2,435 published studies utilizing applications of longitudinal meta-analysis. However, from this assemblage of manuscripts, a mere 113 papers used meta-analysis in the examination of primary data collected across a predetermined period of time. From the 113 papers, only 50 papers clearly indicated how the data was treated; data was either analyzed at each time point, ignoring existing correlations, or at one post baseline time point. Jones et al. conclude that more research on the appropriateness of meta-analyzing longitudinal data is needed and that the use of meta-analysis techniques in longitudinal studies is currently limited.
In a similar vein, Trikalinor & Olkin (2012) examine using both univariate and multivariate approaches in exploring possible options for meta-analyzing longitudinal data. In line with the cautions from other researchers, they recommend that meta-analysis of longitudinal data, whether cohort or panel data, cannot ignore the correlations that exists between time points and that aggregate data is especially challenging in that those between time-point correlations are difficult to impossible to estimate. They conclude by recommending that in the case of missing data, each time point should be evaluated separately. Along with these recommendations are a number of different approaches suggested in the earlier research of Peters & Mengersen (2008). These five approaches to examining longitudinal data with meta-analytic techniques include:
3. All time points meta-analysis(ATP) 4. Trend meta-analysis (TM)
5. Change in time points meta-analysis (CTP)
While Peters & Mengersen (2008) maintain that the approach that is chosen should correspond to the research question or evaluation goals, there are some strict guidelines to adhere to that can direct what the best approach is in light of the type of data that is involved. Specifically, RTP and FFP provide less informative approaches to meta-analyzing longitudinal data that do not necessitate that the data between time points support an assumption of independence. As suggested above, these methods are not concerned with the correlations that exist between time points. However, the ATP, TM, and CTP approaches suggested by Peters & Mengersen (2008) require that the assumption of independence be tenable if the estimates are to be free of bias. This concern regarding independence is prevalent in the existing research (for example, Borenstein et al., 2009; Idris, 2008; Jones, Riley, Williams, & Whitehead, 2009; Morris & DeShon, 2002; Trikalinos & Olkin, 2012; Voelke, Oud, Davidov, & Schmidt, 2012).
Without regard to a violation of independence, the estimates being observed potentially will identify behavior in the data at the aggregate level that is not reflected in the data at the individual level. As with other statistical applications, the accuracy of the inferences derived from meta-analysis depends heavily on the appropriate application of meta-analysis as a tool (Fern and Monroe, 1998). This concern, which is not an issue with many of the traditional approaches to dealing with repeated-measures data or longitudinal data, is due to the unique nature of meta-analysis. The use of pooled estimates in meta-analysis incorporates the differences in means across different time points. If a participant's data is found in multiple time points, that participant's data will contribute to the estimates at more than one time point, and other participants will not. This allows the repeating participant’s data more influence on the outcomes, thus biasing the final estimates.
There are a number of existing recommendations for dealing with these limitations. For example, Trikalinos & Olkin (2012) and Voelke, Oud, Davidov, & Schmidt (2012) provide numerous approaches for analyzing panel data using random effects modeling. Jones et al. (2009) demonstrate a number of methods when analyzing independent participant data (IPD) with both random and fixed effects models. Similar to the approach used in the current investigation, Morris & DeShon (2002) and Beane (2011) provide a straight forward approach which incorporates Peters & Mengersen’s (2008) application of the FFT methodology.
CURRENT INVESTIGATION
Participants
All data was collected and aggregate counts were provided to the evaluator for each location. Data collection was consistent across all groups. This is important when analyzing longitudinal data with meta-analytic approaches as effect size estimates will often differ when the sources of bias have a non-trivial effect on the results. For independent group pre-post designs, change over time must be measured equivalently across groups and duration must be similar in order to protect against bias (Morris & DeShon, 2002).
DATA ANALYSIS AND RESULTS
Data was provided as aggregate frequencies for each location. The number of participants has changed from year to year, thus limiting the data analysis to odds ratio estimation. (For a detailed explanation on computation of odds ratios, see http://www.ncbi.nlm.nih.gov/pmc/articles/PMC2938757/). Data was analyzed with Comprehensive Meta-Analysis. An example of the data entry necessary for these analyses included the number of participants at each location who at baseline (pre-) had at-risk and not-at risk clinical values and those who at the year-mark (post-) had at risk and not at-risk clinical values. For the knowledge questions, frequencies indicated the number of correct responses for each item; for the behavior change items, frequencies indicated the number of positive changes indicated for each item.
In an effort to provide results that were intuitive to the stakeholders, the data for each of the measures (knowledge, behavior change, clinical indicators) was organized so that a positive odds ratio estimate indicates a positive effect. Analyses for the behavior and knowledge questions were computed as random effects while the analyses for the clinical indicators were computed as fixed effects. Results are provided as overall measures for the program participants, as well as in comparison to a local group with an established wellness program that has been in effect for the last decade (control group). The results presented represent baseline to final year measures (end of year three).
Behavior
The analysis of all treatment group participants indicates an odds ratio =1.024, p =.630, indicating no significant difference across the beta sites, indicating a small yet non-significant positive effect. The between group analysis reveals no differences from pre to post measure, odds ratio = .957, p = .676, between the two groups. The conclusion is that the treatment group's reported behavior changes are not different from the comprehensive program.
Knowledge
Clinical Indicators
Analyses reveal that overall, the pre- to post-measures indicated a significant positive effect in the number of individuals in the treatment group showing improvement in their clinical indicators, odds ratio = 1.288, p< .048. The control group changes were basically unchanged, odds ratio = .925. The analysis of between-group effects demonstrated non-significant differences overall, p = .097; however, as indicated with individual indicators, significant differences in improvement were found with overall cholesterol levels, HDL levels, and Triglycerides levels across the two groups, with the treatment group showing the greatest improvement consistently (Table 1).
Table 1: Effect On Clinical Indicators For The Treatment Group And For Between-Groups Comparisons
Clinical Indicator Overall B/T Groups
Overall 1.28* 2.72
BMI 1.59* 0.53
BP 1.36* 1.78
Cholesterol 0.57* 3.79*
Blood Glucose 0.75* 2.12
LDL 1.03 0.15
HDL 1.08 4.35*
Triglycerides 0.83* 4.69*
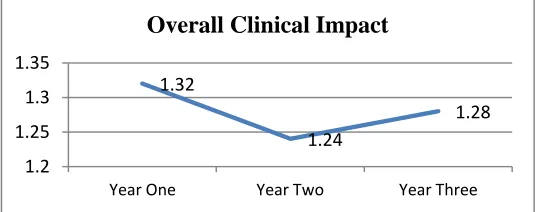
Additionally, the results for year three can be examined relative to the outcomes from year one and year two. These results give some indication of the effect trend across time. A graphical illustration is presented in Figure 1.
Figure 1: Graphical Representation Of Overall Clinical Impacts
As indicated by the aggregated overall effect size measures, there was a drop in the impact after year one. While Figure 1 presents a very simple representation of the overall impact, it helps to illustrate that the significant impact of the program activities is sustained across the three-year program period.
CONCLUSION
1.32
1.24
1.28
1.2 1.25 1.3 1.35
Year One Year Two Year Three
One possible consideration for the results from the current investigation is a novelty effect with the new program. While it appears that the new community wide program is working, as well as the established program, and superior to the established program on some clinical measures, there is another possible explanation that must be considered. Careful examination of raw frequency data indicates that between baseline and year-one is when most of the gains occurred, and were subsequently maintained. Potentially, the effect that is revealed reflects the impact of identifying, for example, individual clinical values that were above healthy levels that are now being medically maintained. This same occurrence may not be reflected as much in the control group data, except for individuals that newly enter the workforce due to turnover. Additionally, the data is limited in that it is aggregate cohort data. While the cohorts consistently represented the same work groups, the turnover in the participants represented in the workgroups is unknown.
AUTHOR INFORMATION
Karen Larwin received her PhD in evaluation, measurement, and statistics in 2007, from Kent State University. She has been teaching statistics and quantitative methods to undergraduate and graduate students since 2006. She is currently the lead chair of the American Evaluation Association Quantitative Method: Theory and Design section, as well as an active member of the United States Consortium for the Advancement of Undergraduate Statistics Education. She has been involved in program evaluation for a number of different healthcare and wellness programs since 2009. She currently works at Youngstown State University as a member of the doctoral faculty for the department of Foundations, Research, Technology, and Leadership. Please send correspondence to Karen Larwin, Youngstown State University, E-mail: [email protected] (Corresponding author)
David Larwin, MA, is a psychology professor for Kent State University at Salem, where he teaches personality psychology, social psychology, general psychology, and quantitative methods in psychology. He is an active member of the American Psychological Association as well as a contributing member of the American Evaluation Association. Please send correspondence to David Larwin, Kent State University at Salem, E-mail: [email protected]
REFERENCES
1. Beane, S. (2011, Nov). Meta-analysis of longitudinal training at HIV clinics: small sample size techniques. Paper presented at the American Evaluation Association 2011 Annual Conference, Anaheim, CA.
2. Borenstein, M., Hedges, L.V.,Higgins, J.P.T., & Rothstein, H.R. (2009). Introduction to Meta-Analysis. Wiley: UK.
3. Fern, E. F. & Monroe, K. B. (1996). Effect size estimates: Issues and problems in interpretation. Journal of Consumer Research, 23, 89-105.
4. Idris, N.R.N. (2008). Modeling repeated measures data in meta-analysis: An alternative approach. Proceedings from the Mathematica Symposium.
5. Jones, A.P., Riley, R.D., Williamson, P.R., & Whitehead, A. (2009) Meta-analysis of individual patient data versus aggregate data from longitudinal clinical trials. Clinical Trials, 6, 16-27.
6. Morris, S.B. & DeShon, R.P. (2002). Combining effect size estimates in meta-Analysis with repeated measures and independent-group designs.
7. Peters, J.L., Mengersen, K.L. (2008). Meta-analysis of repeated measures study designs. Journal of Evaluation in Clinical Practices, 14, 941-950.