Surface Activity And Adsorption Of Some
Surfactants At Aqueous / Air Interface At Different
Temperatures
Alzahraa A. El Feky, Magda N. Shalaby, Omnia A.A. El-Shamy, Suzy A. Selim
Abstract: The adsorption of a series of ethoxylated nonionic and anionic surfactant molecules at aqueous / air interface at different temperature ranges [298, 308, 318, 328 and 338K] was studied. Different surface parameters were evaluated from surface tension measurements at different temperatures. The effectiveness of adsorption, Гmax, for all nonionic and anionic surfactants was discussed with respect to their hydrophilic and hydrophobic characters. Ethoxylated stearate had the lowest effectiveness of adsorption at 298K comparing to other nonioics. Minimum surface area per molecule, Amin, was calculated which provides information on the degree of packing and orientation of the adsorbed surfactant molecules. Amin decreased through increasing the hydrophobicity. Also, the effectiveness of surface tension reduction, πcmc was discussed concerning on surfactant structures. The dependence of surface parameters (Гmax and Amin) on temperatures was explained in details. For the most investigated nonionic and anionic
surfactants πcmc were slightly affected by temperature.
Index Terms: Surface activity, Surface excess concentration, minimum surface area per molecule, surface tension, surfactants.
————————————————————
1I
NTRODUCTIONSURFACTANTS with their unique molecular structures possess a special trend when present in the bulk of aqueous medium. The presence of the hydrophobic group in the bulk medium causes a distortion of the water structure which leads to an increase in the free energy of the system. This means that less work is needed to bring a surfactant molecule, than a water molecule, to the surface and therefore, the surfactant concentration at the surface increases over that in the bulk, a phenomenon which is termed surface activity (1). Likewise, the presence of the surfactant in the aqueous medium
decreases the work required to create unit area of surface (the surface free energy). On the other hand, the presence of the hydrophilic group prevents the surfactant from being expelled completely from the aqueous phase as a separate phase, since that would require desolvation of the hydrophilic group (2,3). The performance of the surfactants is assessed by their surface activity which is largely related to their adsorption at the aqueous / air interface, and parameters as critical micelle concentration (cmc), surface tension at cmc, γcmc , surface excess concentration, Гmax, and area per molecule, Amin, which are governed by various factors, which play an important role in different applications. The aim of this work is to explain the relation and dependence of some surface parameters for a series of ethoxylated nonionic and anionic surfactants on hydrophobic and hydrophilic properties of these surfactant molecules taking in our consideration the effect of
temperature.
2. Experimentals
2.1. Materials
Six ethoxylated nonionic surfactant molecules, [Nonyl polyoxyethylenated monolaurate La(EO)9, Tetradecyl polyoxyethylenated monolaurate La(EO)14, Nonyl polyoxyethylenated monostearate St(EO)9, Tetradecyl polyoxyethylenated monostearate St(EO)14, Nonyl polyoxyethylenated monooleate Ol(EO)9, Tetradecyl polyoxyethylenated monooleate Ol(EO)14 were synthesized according to the method that previously mentioned(4,5). Two ethoxylated sulfonated anionic surfactants were prepared (5), Nonyl polyoxyethylenated sodium oleic sulfonate Ol(EO)9SO3Na and Tetradecyl polyoxyethylenated sodium oleic Sulfonate Ol(EO)14SO3Na. The prepared nonionic and anionic surfactant structures were confirmed by elemental analysis and Infrared spectroscopic analysis in previous work (5) where the critical micelle concentrations, cmc, for the discussed nonionic and anionic surfactant molecules were determined and discussed.
2.2. Surface Activity
Surface activities for all surfactants under investigation were determined from surface tension measurements that were carried out in aqueous medium using doubled distilled water at 298, 308, 318, 328 and 338K with different surfactant concentrations in the range (4x10⁻⁵-1x10⁻²) mol dm-3. The measurements were carried out using K100 tensiometer, Hamburg-Germany, using Wilhelmy's plate method.
2.2.1. Effectiveness of Adsorption, Гmax
The amount of surfactant molecules adsorbed per unit area at aqueous / air interface (surface excess concentration Г) were evaluated from the plot of surface tension γ (mNm-1
) versus logarithm of the concentration of surfactant C (mol dm-3) according to the Gibbs adsorption equation (6):
dγ = -2.303 RTГdlogC (1)
where, R is the universal gas constant and T is the absolute temperature.
__________________________
180
2.2.2. Minimum surface area per molecule, Amin
The minimum area per molecule at surface saturation reflects the surface activity of surfactants (1,7). The area per molecule at the interface, Amin (Å2), is calculated from the relationship,
Amin = 1016 / (Гmax NA) (2)
Where NA is Avogadro's number (6.032 x 10²³ molecules / mol) and Гmax is in mol cm-2. Amin at aqueous / air interface was calculated for each of the investigated nonionic and anionic surfactants at different temperatures (298-338K).
2.2.3. Effectiveness in surface tension reduction, πcmc
The effectiveness in surface tension reduction is the amount of reduction in surface pressure attained at the critical micelle concentration.The surface tension values at cmc (γcmc) were used to calculate the values of surface pressure (effectiveness) by applying the following equation,
πcmc = γo – γcmc (3)
where γo is the surface tension measured for pure water and γcmc is the surface tension at the cmc.
3. Results and Discussion
Surfactants, when present in small quantities, markedly affect the surface behavior in solution. The size and shape of the hydrocarbon moiety and the size, charge and hydration of the hydrophilic head group are of utmost importance in this respect. Depending on the balance between these properties a wide variety of self-assembled structures, at both interfaces and bulk, have been observed.
3.1. Effectiveness of adsorption, Гmax
The surface excess concentration at surface saturation, Γmax, is a useful measure of the "effectiveness" of adsorption.
a. Effect of hydrophobic group
By carful inspection to the values of the effectiveness of adsorption that listed in Table 1. The tested nonionic surfactants having the same number of ethylene oxide (EO) group at 298K follows the order,
La(EO)14 > Ol(EO)14 > St(EO)14
La(EO)9≥Ol(EO)9>St(EO)9
The above order declared that as the hydrophobicity increased, Гmax decreased this might be interpreted as the long hydrocarbon chain of e.g. St(EO)9,14 (hydrophobic tail contain 18 carbon atoms) could suffer some coiling (8) that makes it behave as being shorter than that of La(EO)9,14. This coiling is accompanied with an increase in the value of Amin as shown in Table (1). On the other hand, the double bond present in the hydrophobic chain of Ol(EO)9,14 facilitates the interaction between the neighboring hydrophobic chains at the aqueous / air interface via dispersion forces that, in turn, provides an increase in the effectiveness of adsorption over that of St(EO)9,14. Moreover, the introduction of a double bond in the hydrocarbon chain increases its effective chain area as well as its hydrophilic character (9,10), thus leading to an decrease in the value of Гmax.
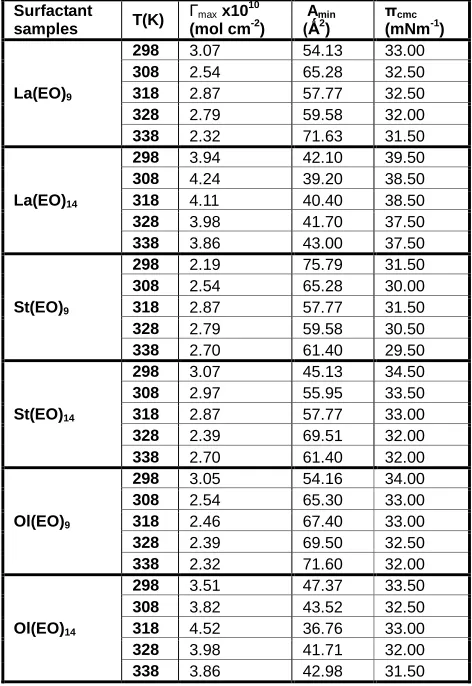
Table (1) : Effictiveness of adsorption, Γmax, area / molecule at surface saturation, Amin and effictiveness of surface tension
reduction, πcmc of the tested nonionic surfactants at Aqueous / air interface at different temperatures.
Surfactant
samples T(K)
Γmax x1010
(mol cm-2) A(Ǻmin 2) π(mNmcmc -1)
La(EO)9
298 3.07 54.13 33.00 308 2.54 65.28 32.50 318 2.87 57.77 32.50 328 2.79 59.58 32.00 338 2.32 71.63 31.50
La(EO)14
298 3.94 42.10 39.50 308 4.24 39.20 38.50 318 4.11 40.40 38.50 328 3.98 41.70 37.50 338 3.86 43.00 37.50
St(EO)9
298 2.19 75.79 31.50 308 2.54 65.28 30.00 318 2.87 57.77 31.50 328 2.79 59.58 30.50 338 2.70 61.40 29.50
St(EO)14
298 3.07 45.13 34.50 308 2.97 55.95 33.50 318 2.87 57.77 33.00 328 2.39 69.51 32.00 338 2.70 61.40 32.00
Ol(EO)9
298 3.05 54.16 34.00 308 2.54 65.30 33.00 318 2.46 67.40 33.00 328 2.39 69.50 32.50 338 2.32 71.60 32.00
Ol(EO)14
298 3.51 47.37 33.50 308 3.82 43.52 32.50 318 4.52 36.76 33.00 328 3.98 41.71 32.00 338 3.86 42.98 31.50
b. Effect of hydrophilic group.
more EO units (i.e. in case of Ol(EO)14SO3Na). This may be attributed to the coiling of this long oxyethylene chain and, accordingly, the increase in the cross-sectional area occupied at the interface as well as the hinder of attaining the meander type as previously mentioned. A comparative study between the tested anionic Ol(EO)9SO3Na which exhibits higher Гmax value (5.57 mol cm-2) than its corresponding nonionic sample Ol(EO)9 (Гmax = 3.05 mol cm-2) in spite of its charged head. The presence of EO units in the anionic surfactant molecule imparts it a special character combining together both that of nonionic and anionic surfactants, that is why the oxyethoxylated anionic compounds are called nonionic-anionic surfactants or compound surfactants (12).
3.2.Minimum surface area, Amin
a. Effect of hydrophobic group
At 298.15K a detectable increase in Amin value with the increase in the hydrophobic chain length from 12 to 18 carbon atoms, which contradicts the earlier published result (13). Concerning on the horizontal orientation of the adsorbed molecules at the aqueous / air interface the hydrophobic chains may be considered to lie flat along the interface. The presence of the double bond in the hydrophobic chain of Ol(EO)9 decreases the Amin occupied by the surfactant molecule at the interface possessing a value that is nearly equal to that of La(EO)9 [Table (1)]. This may be referred to the interaction of the neighboring unsaturated hydrocarbon chains via π-bond and provides closer packing. In case of samples ethoxylated with 14 EO units in their hydrophilic chains, Amin slightly increases as the tail length increases, inspite of the presence of the double bond. The large head size of these samples causes crowding at the interface that forces the long hydrocarbon tail (18 carbon atoms) to coil around itself and therefore the alkyl chain length seems to have a little effect on Amin in the presence of a large head size.
b. Effect of hydrophilic group
Amin decreases, in general, with the increase in the hydrophilic chain length at 298K. This behavior was interpreted by other investigators (11), where an increase in the dehydration around the molecule with the increase in ethoxylated chain length upon adsorption at the interface. The values of the area per molecule at the interface listed in Table (2) for the ethoxylated anionic surfactants under investigation indicate that Amin is affected by increasing the number of EO units, as the relatively long EO chain suffers a sort of coiling thus increasing the area occupied by the surfactant at the interface. A comparative study between the tested nonionic Ol(EO)9 and the anionic Ol(EO)9SO3Na at 298K. The lowest value of Amin shown by the anionic Ol(EO)9SO3Na is attributed to its higher surface activity because of the presence of EO units in its hydrophilic chain as mentioned before.
3.3. Surface tension reduction, πcmc
a. Effect of hydrophobic group
Concerning the values of πcmc for the studied nonionic surfactants at 298.15K, the values declared slight decreases with increase in the hydrophobic chain length which may be attributed to the increase in the area occupied at the interface by the surfactant molecules which possess long hydrocarbon
chains. This trend is supported by a previously published study (1), which concluded that πcmc slightly affected by changes in the length of the hydrophobic chain. The smaller heads of the tested nonionic surfactant ethoxylated by nine EO units, in comparison with those having 14 EO units, increase the probability of the hydrophobic tail of Ol(EO)9 to interact via dispersion forces due to the presence of the double bond leading the molecules occupied smaller area at the aqueous / air interface. This gives the reason for the opposite trend shown by St(EO)9 and Ol(EO)9 against St(EO)14 and Ol(EO)14.
Table (2) : Effictiveness of adsorption, Γmax, area / molecule at
surfacesaturation, Amin and effictiveness of surface tension
reduction,πcmc of the testedanionic surfactants at aqueous / air
interface at different temperatures.
b. Effect of hydrophilic group
The cross-sectional area of the polyoxyethylene chain at the interface therefore seems to be one of the most important factors that determine the effectiveness of polyoxyethylenated nonionics for reducing surface or interfacial tension (1). An exception is found for La(EO)14 which possesses a larger value of effectiveness of surface tension reduction over that of La(EO)9 at 298K due to the coiling of the large ethylene oxide unit in absence of the crowding of the long hydrocarbon chain length. In case of the tested anionic surfactants and at 298K [Table 2], increasing the EO units to 14 hardly affects the adsorption or surface tension reduction. As previously mentioned, this behavior may be referred to the increase in cross-sectional area by the presence of 9 EO units that shows more increases upon the addition of 14 EO units due to the coiling of the long oxyethylene chain in case of Ol(EO)14SO3Na.
3.4. Variation of surface parameters with temperature
3.4.1. Variation of Γmax with temperature
Fig. 1 display a slight decrease in Γmax for La(EO)9 upon raising the temperature from 298K to 308K. Other workers (14), attributed this behavior to the more randomly thermal motion of the hydrocarbon chains of the surfactant molecules in the adsorbed film caused by temperature. Γmax for this surfactant increases with further increase in the temperature to 318K, above which La(EO)9 exhibits a decrease until 338K. The increase observed in Γmax may be due to the dehydration effect, caused by raising the temperature from 308K to 318K that diminishes the head size of the surfactant molecules resulting in closer packing.
Surfactant
samples T(K)
Γmax x1010
(mol cm-2) Amin (Ǻ2)
πcmc (mNm-1)
OL(EO)9SO3Na
298 5.57 29.80 29.50
308 5.21 31.88 29.00
318 4.46 37.24 31.00
328 4.09 40.55 30.00
338 3.59 46.29 29.50
OL(EO)14SO3Na
298 2.63 63.16 33.50
308 2.54 65.28 33.00
318 2.46 67.39 32.00
328 2.39 69.51 31.50
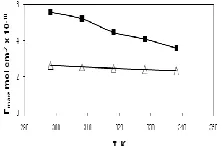
182 Fig. (1): Variation of surface excess concentration,Γmax, with
temperature: (□) La(EO)9; (■) St(EO)9; and (Δ) Ol(EO)9.
Γmax of Ol(EO)9 that shows a same trend up to 308K but above this a slight and continuous decrease is observed with the increase in temperature from 298K to 338K [Fig. 1]. As to St(EO)9, it shows a continuous increase up to 318K then decreases only slightly at higher temperatures, this means that the effect of the random thermal motion of the hydrocarbon chain, which disfavors adsorption may exceed at some temperatures that of the dehydration of the longer EO chain, which favors adsorption.
Fig. (2): Variation of surface excess concentration,Γmax, with
temperature: (□) La(EO)14; (■) St(EO)14; and (Δ) Ol(EO)14.
The overall feature of the variation of Γmax upon raising temperature of La(EO)14 and Ol(EO)14 are nearly similar to each other as shown in Figure (2). This may be due to the presence of the double bond in Ol(EO)14 which increase its hydrophilic character to become near La(EO)14 . The comparison between the saturated ethoxylated stearate [St(EO)9,14] and the unsaturated ethoxylated oleate [Ol(EO)9,14] shows that the trends of the saturated compounds oppose those for the unsaturated ones [Fig. 1 & 2], this result reveals the role played by the presence of the double bond. Different authors (10,15), reported that the effect of the double bond in the hydrocarbon chain on surface activity is rather small for nonionic surfactant species with relatively long polyoxyethylene chain. The disagreement in the trend observed in the present study with that recently reported may be attributed to the short EO chains of the surfactants under investigation, so, the effect of the hydrocarbon chain appears to have a priority over that of the hydrophilic head.
Fig. (3): Variation of surface excess concentration,Γmax, with
temperature: (■) Ol(EO)9SO3Na; and (Δ)
Ol(EO)14SO3Na.
The values of Γmax for the anionic surfactants under investigation are given in Table 2 at 298- 338K, and graphically represented in Fig. 3. As illustrated in this Figure, Γmax for the
two tested anionics decreases with the increase in the temperature from 298K to 338K. This result is consistent with that published earlier by others (14) thus deduced that for anionic surfactants, the higher the temperature, the lower is the Γmax values and attributed this to the more random orientation of the hydrocarbon chains of the surfactant ions in the adsorbed film because of the thermal motion. Careful examination of Fig. 3 reflects the wide range of variation in Γmax with temperature for the surfactant enclosing a short EO chain in its molecule viz. Ol(EO)9SO3Na while for Ol(EO)14SO3Na with longer EO chain, Γmax varies in a very narrow range. This behavior appears to be a result of the long EO chain of Ol(EO)14SO3Na molecule that undergoes an increase in its cross-sectional area upon raising the temperature. Also, the coiling of this long EO chain upon raising temperature hinders the meander type for EO chain to take place and hence no more water molecules could bind with it as mentioned before. This leads to a decrease in the number of H-bond that would break upon the increase in the temperature.
3.4.2. Variation of Amin with temperature
There are two opposite effects that affect the value of Amin (1,11,14) these are:
1. Decrease in the area per molecule at the interface resulting from the increase in the dehydration around the surfactant molecule upon increasing the temperature. 2. Increase in the area per molecule due to orientation as a
result of the thermal molecular motion at high temperatures.
For nonionic surfactants, the dehydration effect has a priority over the orientation effect. The values of minimum area occupied by a surfactant molecule at aqueous / air interface (Amin) for the tested surfactants are shown in Fig. (4&5) as a function of temperature.
Fig. (4): Variation of minimum surface area, Amin with
temperature: (□) La(EO)9; (■) St(EO)9; and (Δ) Ol(EO)9.
Fig. (5): Variation of minimum surface area, Amin with
temperature: (□) La(EO)14, (■) St(EO)14; and (Δ) Ol(EO)14.
may be due to the dehydration effect, caused by the high temperature that diminishes the head size of the surfactant molecule and leads it to occupy a smaller area. The increase in Amin shown at 338K by La(EO)9 declared the alternative role for the two factors where the effect of reorientation of the adsorbed molecules exceeds that of dehydration and therefore affects the value of Amin upon increasing temperature. A nearly constant behavior is given by La(EO)14 upon the increase in temperature from 298K to 338K, which may be referred to the coiling of the long EO chain compared to La(EO)9 that depresses the dehydration effect. Stearic acid, ethoxylated by 9 EO units shows a decrease in Amin upon the increase in temperature up to 318K followed by a small increase upon further heating [Fig. 4] due to the dehydration effect. The maximum shown by St(EO)14 may be due to the coiling of the long EO chain as previously mentioned. In case of oleate series [Fig. (4&5)], Ol(EO)9 shows a continuous increase in Amin. Meanwhile, Ol(EO)14 exhibits a minimum at 318K that may be attributed to the dehydration effect that acts at 298-318K and decreases the head size, together with the coiling of the EO chain thereby increasing the area occupied at the interface. As illustrated in Fig. (6), the variation of Amin for the tested anionics, Ol(EO)9SO3Na and Ol(EO)14SO3Na with increase in temperature simulates the trend given by the tested nonionic surfactant Ol(EO)9. This is reasonable because these two compounds belong to a type of surfactants known as nonionic-anionic as their molecule constitutes both ionic (SO3-) and nonionic (EO) hydrophilic groups. The continuous increase in Amin with temperature may be due to the increase in the thermal motion and the random orientation of the hydrocarbon chain as mentioned by others (14). In addition, the EO chains present in the molecules of these surfactants may suffer some coiling at high temperatures, which leads to an increase in Amin.
Fig. (6): Variation of minimum surface area, Amin with
temperature: (■) Ol(EO)9SO3Na; and (Δ) Ol(EO)14SO3Na.
The trends illustrated in Fig. (4-6) confirm the fact that the variation of Amin with temperature is affected by both dehydration and orientation effects. Therefore, the nature of dependence of Amin with temperature is the net result of which of these two effects predominates over the other.
3.4.3.Variation of πcmc with temperature
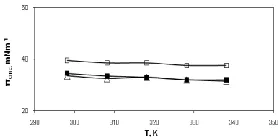
Fig. (7): Variation of effectiveness of surface tension reduction, πcmc with temperature: (□) La(EO)9, (■) St(EO)9; and
(Δ) Ol(EO)9.
Fig. (8): Variation of effectiveness of surface tension reduction, πcmc with temperature: (□) La(EO)14, (■) St(EO)14;
and (Δ) Ol(EO)14.
Fig. 7-9 shown a small gradual decrease of πcmc with most nonionic and anionics upon increasing the temperature from 298K to 338K except samples St(EO)9, Ol(EO)14 and Ol(EO)9SO3Na. In these three samples a small increase is observed at 318K that is followed by a decrease by further increase in the temperature to 338K. In fact, this result was decided (1) and explained by the effect of temperature on the effectiveness of surface tension reduction by surfactants is too sparse and so, no specific trend could be established.
Fig. (9): Variation of effectiveness of surface tension reduction,πcmc with temperature: (■) Ol(EO)9SO3Na; and (Δ)
Ol(EO)14SO3Na
4 Conclusion
From the results obtained in this work it is possible to reach the following conclusions:
• Γmax was found to decrease as the hydrophobic nonionic surfactant tail increase at 298K, while increasing the number of EO units caused increase in Γmax for most surfactant molecules.
• The presence of EO groups in the anionic, Ol(EO)9SO3Na which accepted it some nonionic-anionic characters and hence, it had higher Γmax than the corresponding nonionic Ol(EO)9.
• πcmc decrease with increase the hydrophobic chain length, while increase in EO units cause decrease in effectiveness of surface tension reduction.
• Temperatures caused remarkable effect on Γmax and Amin.
• πcmc was slightly affected by increasing temperature except St(EO)9, Ol(EO)14 and Ol(EO)9SO3Na.
AKNOLEDGEMENT
The authors greatly thank Prof. Dr. Th. M. Shimy for here helpful.
R
EFERENCES[1] M.J. Rosen, Surfactants and Interfacial phenomena. John Wiley & Sons, New York (1978).
184 [3] K.Elissa,―AnOverviewof Decision Theory,"unpublished.
(Unplublished manuscript)
[4] R. Nicole, "The Last Word on Decision Theory," J. Computer Vision, submitted for publication. (Pending publication)
[5] C. J. Kaufman, Rocky Mountain Research Laboratories, Boulder, Colo., personal communication, 1992. (Personal communication)
[6] D.S. Coming and O.G. Staadt, "Velocity-Aligned Discrete Oriented Polytopes for Dynamic Collision Detection," IEEE Trans. Visualization and Computer Graphics, vol. 14,
no. 1, pp. 1-12, Jan/Feb 2008,
doi:10.1109/TVCG.2007.70405. (IEEE Transactions )
[7] S.P. Bingulac, ―On the Compatibility of Adaptive Controllers,‖Proc. Fourth Ann. Allerton Conf. Circuits and
Systems Theory, pp. 8-16, 1994. (Conference
proceedings)
[8] H. Goto, Y. Hasegawa, and M. Tanaka, ―Efficient Scheduling Focusing on the Duality of MPL Representation,‖ Proc. IEEE Symp. Computational Intelligence in Scheduling (SCIS ’07), pp. 57-64, Apr. 2007, doi:10.1109/SCIS.2007.367670. (Conference proceedings)
[9] J. Williams, ―Narrow-Band Analyzer,‖ PhD dissertation, Dept. of Electrical Eng., Harvard Univ., Cambridge, Mass., 1993. (Thesis or dissertation)
[10]E.E. Reber, R.L. Michell, and C.J. Carter, ―Oxygen Absorption in the Earth’s Atmosphere,‖ Technical Report TR-0200 (420-46)-3, Aerospace Corp., Los Angeles, Calif., Nov. 1988. (Technical report with report number)
[11]L. Hubert and P. Arabie, ―Comparing Partitions,‖ J. Classification, vol. 2, no. 4, pp. 193-218, Apr. 1985. (Journal or magazine citation)
[12]R.J. Vidmar, ―On the Use of Atmospheric Plasmas as Electromagnetic Reflectors,‖IEEE Trans. Plasma Science, vol. 21, no. 3, pp. 876-880, available at http://www.halcyon.com/pub/journals/21ps03-vidmar, Aug. 1992. (URL for Transaction, journal, or magzine)
[13]J.M.P. Martinez, R.B. Llavori, M.J.A. Cabo, and T.B. Pedersen, "Integrating Data Warehouses with Web Data: A Survey," IEEE Trans. Knowledge and Data Eng.,
preprint, 21 Dec. 2007, doi: