Structural Interchange Of Mg And Zno In Mg
Doped Zno At Different Temperatures And Its
Influences In The Structural, Spectral,
Morphological, Compositional And Optical
Properties
V.Saraswathi, R.Ramanathan, R.Ramasamy
Abstract: Mg-doped ZnO were synthesized by the nitriding method at 500οC and 700οC. Morphological, compositional, structural and optical analysis has been studied for these temperatures. FTIR, SEM, EDAX, XRD, UV-Vis DRS spectrophotometry and PL studies were carried out for these samples. At 500οC, the XRD pattern shows extra peaks, which correspond to secondary phase. The extra peaks were not found in the XRD pattern at 700οC.Using Match 3 software, at 500οC, the MgO, which has a cubic structure changes its structure to the host structure, which was a hexagonal structure as ZnO and ZnO changes its structure to cubic structure, which is the structure of the dopant material. At 700οC the absence of extra peaks in the XRD pattern suggests that the MgO also has the structure of the host material, which is hexagonal structure, which is confirmed by the Match 3 software. PL spectra show that UV-emission band around 380-390 nm and blue emission peak for both the temperatures. Three peaks at389 nm, 466 nm and intense red emission at 641 nm was observed in the sample processed at 500οC. For the sample synthesized at 700οC, three peaks at 381 nm, 466 nm and weak peak at 557 nm were observed. The intense red peak observed for the sample processed at 500οC is attributed to the structural interchange of the dopant and the host materials.
Key words: Nitriding, Secondary phase, Match 3, red peak
————————————————————
1.INTRODUCTION:
Zinc-Oxide is a II-VI compound semiconductor having a wide band gap of 3.37 eV and binding energy of 60meV[1] . It has enormous applications in optical[2] and electric field[3]. But some applications require higher band gap than that of ZnO. Hence it can be tuned by proper doping with ZnO[4] . But before choosing the dopant, the radius and the band gap of the dopant atom is important. When Mg is added as dopant the band gap of MgO is 7.5 eV and the radius of Mg2+ ion is (0.57 Aο) where the band gap of ZnO is 3.37 eV the radius of Zn2+ ion is (0.60 Aο
) hence the Mg2+
replaces the Zn2+ ions in the lattice site. The band gap of the Mg doped ZnO can be used as electron blocking layer to reduce electron overflow at higher current density and hence the gap can be varied between 3.37 eV to 4 eV[5] and also optical constants such as refractive index, extinction coefficient and dielectric parameters can be altered[6]. However the preparation of the material is complex because ZnO has wurtzite structure (a=3.25 Aο and c=5.25 Aο) and MgO has a cubic structure (a=4.21 Aο) and the unstable solid solubility of MgO in ZnO[7]. This problem can be overcome by choosing the proper method of growing the nano particles. Hence the Mg doped ZnO plays major role in many applications[8] . Especially, in luminescence property the UV emission is blue shifted due to broadening of doping which establish that the band gap increases. So it opens the field for its potential applications in OLED technology[9] .In the present study the Mg doped ZnO have been grown by the nitriding method at different temperatures. The structural, morphological and optical properties are analyzed.
2. EXPERIMENTAL SECTION:
The Zinc Nitrate and Magnesium Nitrate were purchased from Nice Company, which were used without any further purification. 60 gm of Zinc nitrate was dissolved in75 ml of double distilled water and mixed with 60 gm of urea diluted with 10 ml water and citric acid diluted in 10 ml of water. The solution was kept in magnetic stirrer for 10 minutes. Then 5 gm of Magnesium nitrate diluted in 10 ml of water was mixed with the prepared zinc nitrate solution. The mixture was kept in a magnetic stirrer for one hour. Then 10 ml of Poly Ethylene Glycol (PEG) was added drop by drop to the mixture and kept in the hot plate for 10 hours at a constant temperature for drying purposes. After that it was kept in a muffle furnace for 500ο C for 3 hrs. The same procedure repeated for 700 ο C also.
2.1 Instrumental Used:
The synthesized material was characterized using the instruments XRD of Scanning Mode 2 Theta/Theta of Scanning type, Continuous Scanning X-Ray 40kV/30mA and the data was recorded using CuKβ radiation. JEOL JSM 6510-LV Scanning Electron Microscope with MOXTEK 550i thin film coated IXRF energy dispersive spectrometer (EDAX) is used for morphological and for determining the percentage of elements present in the sample. The Photo Luminescence studies were done using LS 45 Fluorescence Spectrometer by PerkinElmer model. Reflection and Transmission studies were done using JASCO UV-Vis DRS Photometric mode V - 650 Series model. The Band Gap of the material was studied using UV SPECTRUM-JASCO V-650 series of KUBELKA-MUNK model.
950 3.1 Fourier Transform Infrared Analysis (FTIR):Fourier
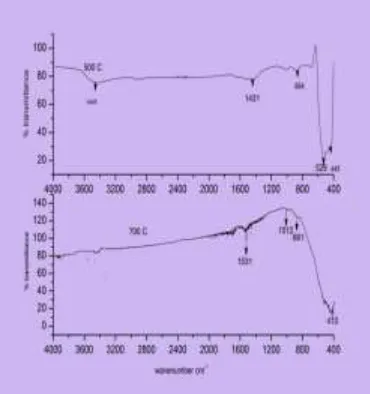
Transform Infrared Spectroscopy (FTIR) analysis is done for the sample. “Figure 1” shows the FTIR spectrum of synthesized Mg doped ZnO at 500ο C & 700ο C. The various modes of vibration are observed in different regions of FTIR spectrum and shown in “Table 1”. The peak at 3445cm-1 [10] at 500οC indicates the -OH stretching vibrations. These stretching vibrations correspond to hydroxyl band. The peak at 1531cm-1 [11] at temp 700ο C is due to bending vibration of free water. This vibration indicates the presence of bound H2O on the surface of the
sample. The peak at 1431 cm−1[12]for 500οC is associated with Mg-O. The peak at 1012 cm−1 [13] at temp700ο C is assigned to the stretching vibration mode Mg-O. This peak is related to the high oxygen content in this layer. The absorption at (864,861) cm-1 [14] is due to the stretching vibration of Mg-O bonding. The IR spectrum of ZnO usually shows a characteristic absorption band between 400-550cm−1 due to two transverse optical stretching modes of ZnO[15] . For the temp 500οC this maximum is split into two maxima, one at 529 cm−1 [16]is due to O-H stretching and the second one at 445 cm−1 [17] while for the temp 700οC it shows only one maximum at 410 cm−1 is the characteristic peaks of Zn-O stretching vibration. It is in the low frequency side is due to some structural changes by doping with Mg[18].
Figure 1 FTIR pattern of synthesized
Mg doped ZnO at temp 500οC and 700οC
Table 1 FTIR peak interpretations
3.2 Morphological and Compositional analysis:
The morphology of Mg doped ZnO, is studied from Scanning Electron Microscopy (SEM) is shown in “Figure 2 and 3”. It shows the seed-like structures of synthesized ZnO particles at 500οC, which are almost in spherical shape and also a few of them as a rod like structure in appearance and the crystallite size falls under nano region, from XRD analysis. As the temp 700οC particles of different size; a few of them are spherical but few have the particles of hexagonal facet. They are highlighted in the inset.
Figure 2 SEM pattern of synthesised ZnO at temp 500οC
Figure 3 SEM pattern of synthesised ZnO at temp 700οC
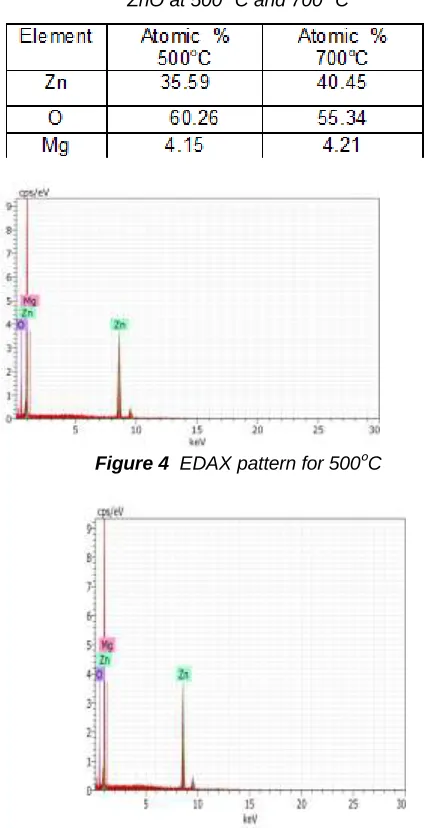
temperatures 500ο C and 700ο C. The spectra confirm the presence of the constituents zinc (Zn), oxygen (O) and magnesium in the particles. It is clear from the spectra that the particles are successfully synthesized. The consistent and sharp peaks with magnesium-zinc oxide demonstrates the synthesized particles are crystalline in nature, and the peaks associated with impurity are absent in EDAX spectra hence the synthesized Mg doped ZnO particles are in pure forms. The percentage of Zn, Mg and O elements present are tabulated in “Table 2”.
Table 2 The atomic percentage calculated for synthesized ZnO at 500ο C and 700ο C
Figure 4 EDAX pattern for 500οC
Figure 5 EDAX pattern for 700οC
3.3 Structural Analysis:
ZnO at different temperature is carried with the help of XRD method. The intensity data are collected over a 2θ range of
20-80ο . This XRD pattern has the characteristic peaks of ZnO [19] shown in the “Figure 6”. The average crystallite size and the various XRD parameters for both the temperatures is oriented along [101] plane and various parameters are tabulated in Table 3. The decrease in crystal size can be attributed to the formation of Mg-substituted ZnO (Mg-O-Zn) solid solution which inhibits the growth of crystal grains [20]. This can be explained as a function of Mg content by the Zener pinning effect. There are a variety of inherent defects present in ZnO with different ionization energies such as oxygen vacancy (VO),
zinc vacancy (VZn), oxygen interstitials (Oi) and zinc
interstitials (Zni) [21]. Due to these crystal defects and
imperfections, the expansion of grain boundaries gets restricted in a crystal which is called Zener pinning effect [22].The intensity of the diffraction increases with increase in temperature.
Figure 6 XRD pattern of synthesized Mg doped ZnO at temp 500οC and 700οC
The 2θ values for both the temperatures, which corresponds to [100], [002], [101], [102], [110], [103], [200], [112] planes, shows a typical XRD pattern of ZnO particles[23]. This XRD peak matches with the JCPDS card no. 05-0664 of the ZnO structure which are standard hexagonal peaks. Therefore, the XRD peaks indicating Mg ions are substituted for Zn ions because both have very similar ionic radii (0.57and 0.60 Å)[24] , and there are no variation in the structure of the Mg doped ZnO nanoparticles. But, there is a secondary phase at about 32 which corresponds to [110][25] and at an angle about 53ο corresponds to [103][26]which may be due to MgO which has tetragonal spaces wurtzite hexagonal structure with a doping amount of 3.5 mole% of mg doped ZnO. Hence, these results demonstrate the fact that Mg-doped ZnO synthesized at 500 °C contains amorphous MgO, which is not incorporated into the ZnO lattice, which forms a secondary phase but at temperature 700 °C MgO decomposes [27] and leads to Mg diffusion into the ZnO lattice structure. This confirms that temperature that Mg disrupts and occupies the Zn site [28] completely at higher temperature.The peak intensities seem to be increased for 700 °C when compared to 500 °C and at higher angle it shows a small shift towards low angle (show in Figure 6 inset), hence the lattice parameters, micro strain and dislocation density increases with decrease in crystallite size. This may be attributed to the introduction of Mg which immobilized the ZnO.
952
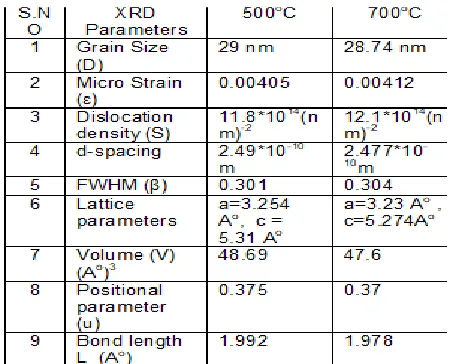
“Table 3” shows the grain size and the FWHM, which are calculated for all the peaks of XRD spectra.The grain size (D) was obtained from XRD peaks using the Debye- Scherrer’s equation[29]. The Microstrain can be calculated from
ε = β Cos θ / 4
The Dislocation Density of the nano particle is S = 1 / D2(nm)-2
The d- spacing of the atom is calculated by (n λ / Sin θ) Å Where n is the order of diffraction, λ = Wavelength of X-rays and θ is Diffraction Angle. The lattice constants can be calculated by using the relation[30],
1/d2hkl = 4/3((h 2
+hk+k2)/a2)+(l2/c2) With the first order approximation (n = 1) for the (101) plane. The lattice constant ‘a’ is obtained through the relation
a=λ /√
And the lattice constant ‘c’ can be derived from the relation c = λ/
The volume (V) of the unit cell for hexagonal system is V=0.866*a2*c When the temperature increases the lattice parameter and the lattice volume decreases. This indicates that the Mg ion substitutes into host lattice partially in tetrahedral Zn positions. It is observed that the incorporation of Mg ions creates significant changes in Zn-O bond length. Hence the structural adjustments may arise due to the radius
difference between the two substitution ions. The bond lengths are calculated from the relation
L=√ 2/3+(1/2-u)2c2)
where ‘a’ and ‘c’ is the lattice parameters and ‘u’ is a positional parameter. The positional parameter ‘u’ can be calculated by the relation,
u=(a2/3c2)+0.25
There is a decrease in bond length values with Mg doped ZnO particles when the temperature increases. Thus the blue shift of the UV emission, the shift of red to green band region to increase in temperature is confirmed by XRD studies by the absence of secondary peaks at 700οC which reveals that the Mg is incorporated into ZnO lattice
successfully.
Figure 7 XRD pattern of synthesized Mg doped ZnO at temp 500οC by Match 3 software
Figure 8 XRD pattern of synthesized Mg doped ZnO at temp 700οC by Match 3 software
Magnesium as MgO has cubic structure. When Mg is doped with ZnO which has tetragonal structure, there is interchange in the tetragonal structure and formation of secondary phase is observed. In the XRD analysis for 500ο C it is observed that there is secondary phase which is evident from extra peaks observed at 32ο C and 53ο C. From Match 3 program, it is observed that at 500ο.C Mg has a hexagonal structure and ZnO is seen in cubic structure.56% of Mg is there in hexagonal structure and 44% of ZnO is in a cubic structure at 500οC. This is a new phenomenon wherein there is a structural interchange by both the dopant and also the host materials. Hence, the secondary phase is due to structural interchange, though it is attributed to the disruption of the tetragonal structure, the host material, which is ZnO has interchanged to the structure of the dopant. It is important to see the optical properties due to this interchange. At 700ο C Mg ions diffuses into the hexagonal structure of the ZnO, which has been confirmed XRD analysis, which shows no secondary peaks and the same phenomena is confirmed through Match 3 program also (shown in “Figure 7 and 8”)
3.4 Optical Characterization:
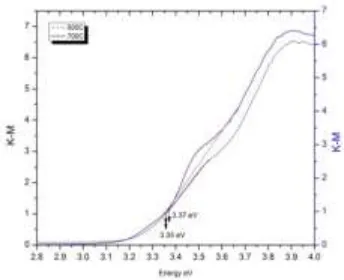
reflectance shifted towards the blue band emission(443 and 475 nm) and hence it indicates the incorporation of magnesium in the zinc oxide interstitial site. When Mg2+ substitute the Zn2+, due to the electro-negativity and ionic radius differences between Zn and Mg, the increase in oxygen vacancies and carrier concentration appears. Thus the optical band gap widening occurs. Hence the excitonic reflectance favors for the little quantum confinement effect[31] , since the size of the nano particle under study is much larger than the Bohr radius of ZnO (approximately 2.34 nm). If there is any presence of contaminants it would have acted as dopants in the ZnO, causing lower energy (higher wavelength) transitions, which would appear as small peaks or drops in the UV-Vis spectrum. But the spectrum shows a smooth line beyond the original drop. This confirms that the material has a good reflectance characteristic[32]. The sample show that the reflectance is increasing from UV to visible range with more than 65% of reflectance. The band gap energy calculation of ZnO material is performed by using KubelkaMunk plot[33] shown in the Figure 10. The optical band gap has been calculated and found to increase from 3.18 eV for undoped ZnO [34] to 3.34 eV for Mg-doped ZnO at temp 500οC and 3.37 eV for temp 700οC, because MgO has a wider band gap than ZnO[35]. Hsu et al. reported that doping with Mg increases the band gap of ZnO. Hence increase in the band gap is due to Burstein-Moss effect. The Excitonic transition energy shifted to a high energy value due to Mg doping in ZnO. However, Mg doping in the ZnO acts as a donor and the band gap of the structure increases.
Figure 9 UV-Vis DRS spectra for Reflectance for the temp 500ο C and 700 ο C
Figure 10 UV-Vis DRS Band gap energy of the material
3.5 Photo luminescence analysis:
The photoluminescence spectra is an effective methodology to study electronic, optical properties of
synthesized Mg doped Zinc oxide recorded for both the temperatures are shown in the “Figure 11 and 12”. It shows three distinct emission features which can easily be discerned: First peak around 389 nm(500ο C)[36] and the other at 381 nm(700ο C). This corresponds to the characteristic band edge emission of UV region. UV emission is known as a near-band-edge (NBE) emission, which originates from the recombination of the free exciton through an exciton-exciton collision process. The increase in the intensity of UV emission is due to improved crystal quality and a decrease in the stress of ZnO due to doping. The difference in the UV emission peaks is due to increase in temperature (without change in doping ration).Hence the tuning of the band gap can take place over a range of 67 meV by increase in temperature and it is due to substitution of Mg ions in Zn ions. The band emission of ZnO creates electrons from the valence to the conduction band and hence it leaves holes in the valence band. The holes move within the valence band to deep levels and recombination occurs between electrons from the conduction band facile donor levels and trapped holes on deep levels. The second peak at 466 nm (500ο C) and 461 nm (700ο C) which are sharp represents the blue band emission range. The radiation in the visible range is due to recombination between point defects and oxygen vacancies. The third peak at the red luminescence at 641 nm (500ο C) observed in the present case which is sharp with an increase in intensity has been assigned to electronic transitions from the Zni level to the valence band. The energy level
954
Figure 11 Photo Luminescence for temp 500οC
Figure 12 Photo Luminescence for temp 700οC
CONCLUSIONS:
Mg doped ZnO were synthesized by nitriding method. The FTIR result shows the presence of Zn, Mg and O in the samples. SEM result shows that when the temperature increases the crystal size decreases. EDAX studies reveal the purity of the samples. The XRD results show that at the 500οC the secondary phase exists, and at 700οC it was absent. From Match 3 software, it is observed for the sample processed at 500οC that there has been an interchange of host and dopant structure between MgO and ZnO structures, which is a new phenomena and when compared with the sample processed at 700οC, the PL studies shows an intense red peak at at 641 nm, for the sample processed at 500οC, in addition to common peaks whereas for the sample processed at 700οC, the PL studies shows a weak peak at 557 nm, in addition to the common peaks. The intense red peak observed for the sample processed at 500οC is attributed to the structural interchange of the dopant and the host materials. Data Availability Statement: The raw/processed data required to reproduce these findings cannot be shared at this time as the data also forms part of an ongoing study.
REFERENCES:
[1] Sreetama Dutta , S. Chattopadhyay , A. Sarkar , Mahuya Chakrabarti , D. Sanyal , D. Jana, Progress in material science doi.org/10.1016/j.egypro.2018.11.285
[2] V. Etacheri,R.Roshan,V.Kumar, ACS Applied Materials and Interfaces 42717–2725(2012).
https://doi.org/10.1021/am300359h
[3] C.J. Pan,K.F.Lin,W.T.Hsu,W.F.Hsieh, Journal of Physics: Condensed Matter 19186201
Journal of Physics: Condensed Matter, Volume 19,
Number 18 (2007).
[4]GopinathKasi and JongchulSeo ,MSC 9293, Kasi, G., & Seo, doi:10.1016/j.msec.2019.01.035.
[5] Kaushal, D. Kaur, Sol. Energy Mater. Sol. Cells
https://doi.org/10.1016/j.solmat.2008.09.039 .
[6] G. Xiong, U. Pal, J.G. Serrano, Correlations among size, defects, and photoluminescence in ZnO nanoparticles, J. Appl. Phys. https://doi.org/10.1063/1.2424538
[7] A. Ohtomo, M. Kawasaki, T. Koida, K. Masubuchi, H. Koinuma, Y. Sakurai,
Y. Youhida, T. Yasuda, Y. Segawa, Appl. Phys. Lett. 72 2466 (1998).
[8] K. Tanaka, T. Minemoto, H. Takakura, Sol. Energy 83 477–479
https://doi.org/10.1016/j.solener.2008.09.003 (2009). [9] PayalManzhi, ReenaKumari, Md.B. Alam, G.R.
Umapathy, Richa Krishna, Sunil Ojha,RituSrivastava, O.P. Sinha,Vacuum,10.1016/j.vacuum.2018.10.070
(2018).
[10] I.S.Saputra and Y.Yulizar,IOP Conf. Ser.: Mater. Sci. Eng. doi.10.1088/1757-899X(2004).
[11]E. Bhawani, G.S.Harish, P.Sreedhara Reddy, AJERe-ISSN: 2320-0847, DOI: 10.9790/9622-0708047275Volume-6, Issue-7, pp-30-35.
[12]XiaoqingQiu, Liping Li, Jing Zheng, Junjie Liu, Xuefei Sun, and Guangshe Li, J. Phys. Chem. C 112, 12242– 12248 (2008).https://doi.org/10.1021/jp803129
[13]Minghua Li, LibinZeng,YifengChen,LinZhuang, XuemengWang, and HuiShen, International Journal of Photo energy, 10.1155/2013/352473
https://doi.org/10.1155/2013/352473 (2013).
[14] Anh-Tuan Vu,Shunbo Jiang, Keon Ho, JoongBeomLee,Chang-Ha Lee, Chemical Engineering Journal 269, 82-93 doi.org/10.1016/j.cej.2015.01.089. [15] S. Hayashi, N. Nakamori, and H. Kanamori, Journal of
the Physical Society of Japan, vol. 46, pp. 176–183 (1979).
[16]AlojzAnzlovar, ZoricaCrnjak Orel, KsenijaKogej, andMajdaZigon, Journal of Nanomaterials
10.1155/2012/760872 (2012).
[17] ManishaC.Golcha, Vijaya S. Sangawar, Roshani N. Bhagat, NileshR.Thakare,IJIRST, 2349- 6010 (2018). [18] A.Geetha, R.Sakthivel and J.Mallika, World Journal of
Pharmacy and Pharmaceutical Sciences,Vol 6, Issue 8 (2017).
[19] L. Umaralikhan, M. Jamal Mohamed Jaffar, J Mater Sci: Mater Electron,10.1007/s10854-017- 6461-1(2017). [20] S. Suwanboon, P. Amornpitoksuk, A. Haidoux, J.C.
Tedenac, Journal of Alloys and Compounds, 462
10.1016/j.jallcom.2007.08.048 (2008).
[21]J.C. Fan, K.M. Sreekanth, Z. Xie, S.L. Chang, and K.V. Rao, Progress in Materials Science,
58(6)10.1016/j.pmatsci.2013.03.002 (2013).
[23] Saber FarjamiShayesteh, Armin AhmadiDizgah, Pramana Journal of Physics, Vol. 81, No.2, pp. 319–330 (2013) 10.1007/s12043-013-0562-z.
[24]P.Maddahi, N.Shahtahmasebi, A.Kompany, M.Mashreghi, S.Safaee, F.Roozban, 10.2478/s13536-013-0181-x.
[25]A.Sayed , El.Samanody, K. Ayman. El.Sawaf,MetwallyMadkou, Inorganica ChimicaActa 487 307–315 (2019).
[26]Heesung Moon , Changhun Nam, Changwook Kim, Bongsoo Kim, Materials Research Bulletin 412013–2017 (2006).
[27] VinodkumarEtacheri, RoshithRoshan, Vishwanathan Kumar, ACS Appl. Mater,10.1021/am300359h .
[28]B.K.Sonawane, M.P.Bhole, D.S.Patil, 10.1007/s11082-009- 931(2009).
[29] Riyadh M.Alwan,
QuraishA.Kadhim,KassimM.Sahan,RawaaA.Ali,
RoaaJ.Mahdi, .Kasim,AlwanN.Jassim,
10.5923/j.nn.20150501.01 (2015).
[30]SaimeSebnem Cetin , Ibrahim Uslu, ArdaAytimur, SuleymanOzcelik, Ceramics International 38 4201– 4208 (2012).
[31]M. Jay Chithra , M. Sathya , K. Pushpanathan,Acta Metall. Sin. (Engl. Lett.), 394–404, 10.1007/s40195-015-0218-8 (2015).
[32] Z. Khusaimi, N.A.M. Asib, S.Z. Umbaidilah, A.N. Afaah, C.N.E. Syafika,N.F. Chayed, M.Rusop, IJET, pp.186-190 (2018).
[33]J.Marselie, V. Fauzia and I.Sugihartono, Journal of Physics,012014 (2017).
[34] Xinhua Zhang, Yiqing Chen, TaiboGuo, Lizhu Liu, Meiqin Wei, QiangLi,ChongJia, and Yong Su,Journal of Experimental Nanoscience ,Vol. 7 513–519 (2012). [35] E. Burstein, Vol. 93, 3 pp.632-633.
doi:10.1103/PhysRev.93.632 (1954).
[36]M.K.Mishra, A.Narayan, R.K.Singh, R.S.Yadav, N.K.Nidhi, A.C.Pandey, Nano Science and Nano Technology, 8(2)(2013).
[37]Muhammad Amin, Nazar Abbas Shah, ArshadSaleemBhatti and Mohammad Azad Malik, CrystEngComm, doi.org/10.1039/C4CE00153B.