Competition And Real
Activities Manipulation
Sudip Datta, Wayne State University, USA Mai Iskandar-Datta, Wayne State University, USA Vivek Singh, University of Michigan-Dearborn, USA
ABSTRACT
We enrich the research on income manipulation by establishing a link among companies’ price-setting control and the extent of real activities management. Examining three types of real activities management, the results reveal an interesting asymmetry in how companies employ income manipulation based on their pricing strength. We discover that companies with weaker price-setting clout employ larger manipulation of sales and production costs as a tool to manage income, while firms with more dominant pricing power prefer managing discretionary expenses.
Keywords: Competition; Competitive Pressure; Income Manipulation; Real Activities Management
JEL Classification: G30; L11; M4; M41
1. INTRODUCTION
key matter in income manipulation investigation is to detect firm characteristics that determine income manipulation (see Healy & Wahlen, 1999). Firms can resort to two diverse types of income manipulations - accruals management and real activities manipulation. Extant income manipulation studies have concentrated on accruals management that involves the choice between accounting methods to manipulate reported income1, real activities management has not been studied as much. A few studies (Gunny, 2010; Zhang, 2008; Roychowdhury, 2006; Bartov, 1993) establish that management strategically manage operational decisions as an important tool for income manipulation. When managers choose to manage real activities, they make decisions to change the scheduling or configuration of underlying operational acts of the firm in order to manipulate reported income.
Many papers have already shown that a company’s competitive setting impacts its capital budgeting, capital structure, dividends and risk management activities.2 However the influence of competition on the declared income is mainly unexamined. Arguably, a firm’s price-setting clout gives the company the capacity to organically smooth out cash flow fluctuations and reduce income volatility by passing on any cost increases to the consumers, hence lessening the necessity to manage income. In this study, we explore empirically the connection between price-setting clout of companies and their capacity of income manipulation via real activities management. In particular, we pursue the important and yet unanswered question. Does competition faced by companies impact the extent of income manipulation through real activities management?
Although Datta, Iskandar-Datta, and Singh (2013) relate the product market power to income management, their focus was on accruals management. This is the first paper to relate the pricing environment of a firm to its degree of real activities manipulation. By addressing the above issue, we add to the body of knowledge by establishing whether a company’s relative intra-industry pricing environment affects its decisions regarding the transparency or informativeness of its reported income.
1 Prior research that document management through accruals include Abdallah and Hussain (2012), Saleh and Ahmed (2005), and Holland and Jackson (2004).
While firms may prefer real activities in certain situations, it is not clear what is the expected correlation between price-setting clout and the extent of income manipulation. On one hand, it can be argued that larger the capacity of firms with more price-setting clout to transfer production cost increases to consumers the lower the necessity to engage in income management. Alternatively, it can also be reasoned that managers of high market power firms are under relatively forgiving disciplinary environment, and hence enjoy greater discretion to manipulate income compared to their low market power firm counterparts. These two competing arguments create an interesting tension, making the compelling central issue examined in this study also an important empirical question.
Using a large sample of 43,628 firm-year observations during 1987-2009, we find that price-setting clout is a significant factor of a firm’s degree of real activities manipulation. In particular, we document a strong association of price-setting clout and three types of real activities manipulation that are typically used in prior studies. We find that companies with low price-setting clout resort to sales manipulation and, hence their operating cash flows are considerably lesser than companies with higher price-setting clout. The analysis also reveals that companies with low price-setting clout have greater tendency to utilize production costs in an effort to reduce their costs of goods sold. This is in support of research that documents that management resort to manipulations since declaring worse than anticipated income is harshly punished by the Wall Street (Skinner & Sloan, 2002). These results echo the findings documented in Datta et al. (2013) that companies with low price-setting clout resort to more accrual manipulation.
In contrast to these findings, firms with the strongest competitive market positions are more prone to manage discretionary (non-mandatory) expenses than firms with weaker market position. Overall, the analysis reveals an interesting asymmetry in how firms resort to income manipulations through real activities where firms with weak market positions favor engaging in manipulation of sales and manufacturing expenses as tools for income manipulation while companies with higher market power prefer managing discretionary (non-mandatory) expenses. After controlling for proxies of governance and information environment, our inferences regarding market power’s effect on real activities remains unaltered.
In the next section, we present testable hypotheses relating product market power to real activities management. Section 3 shows the data used, and the measures to capture price-setting clout and income manipulation. The results connected with price-setting clout and real activities management are in Section 4. We conclude the paper in Section 5.
2. HYPOTHESIS DEVELOPMENT
Roychowdhury (2006) documents that managers shape income by manipulating real activities through “channel stuffing” via quickening of sales, price discounts, reducing or delaying discretionary expenses, or overproducing. Surveys, conducted by Graham, Harvey and Rajgopal (2005) among others, provide evidence that managers are more willing to employ operational decisions management than accruals manipulation, perhaps since the latter is expected to attract the attention of watchdogs.Real activities management, on the other hand, is less discernible because these actions are more difficult to distinguish from normal business decisions. Another reason for not relying solely on accruals manipulation is that the magnitude of accrual-based strategies may not be sufficient to manage income to the desired level, whereas real activities management by its very nature have to be implemented before the end of the fiscal period.
Intra-industry price-setting clout that we simply designate as price-setting clout stems from the company’s facility to get abnormal rents (higher prices) from its consumers without impacting sales, thus affording a pricing advantage to the firm vis-à-vis its industry rivals. Distinctiveness and preeminence of product lines or a solid trade name and innovative marketing strategies are the symbols of solid price-setting clout. Prior studies have found multiple advantages that firms derive from price-setting clout.
First, companies with higher price-setting clout can better sustain their margins when they get external production cost increases since they have unique merchandise either or both marketing strategies. On the other hand, product substitutability magnifies price competition.3 Firms whose products could easily be substituted have lower capacity
to increase prices, and by extension, an inability to pass on these costs to protect profit margins. The ability to maintain superior profit margins in the face of idiosyncratic shocks allows such firms to establish a strategic response to fend off new competitors.
Second, superior financial performance may allow the firm greater access to capital markets, which can insulate it from the competition. The improved protection level of these companies in circumstances of cash shortages, enhances their ability to withstand worsening financial environment compared to companies with low price-setting clout. The improved cash-flow margin of safety turns into a lesser prospect of economic suffering and subsequent exit in response to production cost shocks. Given the above arguments, more price-setting clout allows companies to diminish insecurity about their expected cash-flows obviating the need for real activities management, while the pressures on firms without pricing power provide incentives for them to take recourse to more income manipulation.
Another rationale that suggests a relationship between relative pricing strength and reporting quality is the proprietary costs faced by firms with intense price pressures. Verrecchia (1983) suggests that on account of negative effect from information transparency, such companies like less information revelation to decrease destructive pressures from competitors. Thus, it can be argued that income management can act as mechanism through which the firm strategically withholds valuable information from rivals thereby reducing the transparency of financial statements.
We utilize three measures of real activities, namely, abnormal discretionary (non-mandatory) expenses, abnormal production costs and abnormal cash flows. Roychowdhury (2006) argues that to meet income benchmarks, managers can strategically influence income by reducing discretionary expenses, increasing production costs or increasing sales (which leads to lower cash flows).4 Sales manipulation involves behavior that accelerates revenue from upcoming year into the present year. While boosting sales, such manipulations also lower margins due to the lower prices and soft credit needed to enhance revenue beyond normal levels. This impacts the current period cash flow adversely. Thus, a company that manipulates increasing revenue now has a lower than normal cash flow. If product market power ameliorates (enhances) the need to manipulate income, then such firms will manage sales to a lesser (greater) extent, and hence, be less likely to experience reduction (increase) in less than normal cash-flow from operating activities. We also argue that companies with great price-setting clout are unlikely to enhance sales through offering price discounts as such action may undermine their brand value.
Managers can also influence income-reducing discretionary expenses that temporarily boost reported income. There are various forms of non-mandatory costs like R&D expenditure, marketing expenditure, SG&A and maintenance expenses. For example, results in Roychowdhury (2006) support the view that firm management circumvent declaring losses by cutting discretionary spending. Bens, Nagar and Wong (2002) report that firm-management cut expenditure on R&D and capital budgeting spending whenever EPS decreases happen as result of ESOP conversion to shares. However, the directional relationship between market power and discretionary expenses is unclear. The firms with low market power can reduce these expenses to manage income upwards. However, to the extent, these firms have to rely on greater innovation through R&D as per Schumpeter’s (1912) argument or cannot afford to reduce advertising and sales expenses to survive in the tough market place, we expect these firms to manipulate discretionary expenses to a lesser degree than firms with greater market power.
Further, managers can influence the expense related to COGS by overproducing, thereby spreading the constant indirect expenses over a greater quantity of output provided that carrying expenditures of inventory do not completely offset the benefit from manipulation. Recent work provides evidence that managers overproduce to decrease COGS (Thomas & Zhang, 2002; Roychowdhury, 2006; Gunny 2010). Specifically, we propose that if product market power insulates firms from the need to manipulate income, then such companies are unlikely to indulge in accelerating revenue, cutting their non-mandatory costs or increasing production. In addition to the extent the real activities could be managed to obfuscate information as argued in the theoretical model of Verrecchia (1983), the firms with low market power have more motivation to manipulate income. These above arguments lead to the following primary hypotheses:
Hypothesis 1: Companies with weaker price-setting clout will exhibit more tendency to manipulate sales leading to lower abnormal cash flows.
Hypothesis 2: Companies with weaker price-setting clout will exhibit more propensity to manage production costs leading to greater abnormal production costs.
Hypothesis 3: Companies with weaker price-setting clout will exhibit more tendency to manage discretionary expenses leading to lower abnormal discretionary expenses.
Theoretical studies have shown that the nature and intensity of the competition directly influences managerial behavior in an agency context. These studies suggest that competitive pressures themselves exert a corrective tool decreasing managerial dysfunctional behavior. Hart (1983) shows that when competitive pressures increase, firm-management have less leeway and are motivated to put in more efforts. Likewise, Hallström (1982) and Nalebuff and Stiglitz (1983) posit that when cost shocks in an industry are correlated, amplified competitive pressures afford shareholders with greater information which helps reduce moral hazard problem. Schmidt (1997) argues that higher rivalry in the industry escalates the prospect of bankruptcy of the company due to reduced profits, therefore giving robust motivation to firm-management to exert more efforts to remain employed. The main thrust of this theoretical strand of literature is that lack of competition provides weak disciplinary environment to managers. Other theoretical work has formalized this notion by investigating the prospective avenues through which competitive pressures impact firm-management motivations. (Raith, 2003).
A number of papers show that a company’s competitive setting impacts its capital budgeting, capital structure, dividends and risk-management decisions. Haushalter, Klasa and Maxwell (2006) document the effect of competitive forces on risk-management strategies, and Grullon and Michaely (2007) provides evidence that competitive environment impacts the distribution of cash to shareholders. Guadalupe and Pérez-González (2010) document that the more intense competitive environment, the less the personal advantages of management control.5
Prior empirical research also provides evidence that a feeble penalizing environs permits managers to indulge in greater income management (Bowen, Rajgopal, & Venkatachalam, 2008). By the same token, we argue that competitive disciplinary pressures may limit how much firms can manage real activities to manipulate their reported income. If competitive pressures are more effective at monitoring and disciplining management, then firms operating in such environments will exhibit lesser tendency to manipulate reported income. In contrast, companies operating in competitively more secure environments will manipulate income more.
The informational disclosure literature gives another rationale for companies with great price-setting clout to manage income. While Verrecchia (1983) proposes that companies described by extreme competitive environment reveal a lesser amount of information, Stivers (2004) proves that the more information is revealed with more extreme competitive environment. Stivers contends that in competitive industries, there will be at least one company with quality high enough to reveal its information, thereby allowing for the progression of information revelation until full disclosure is attained.
The above arguments provide backing to the premise that firms with high price-setting clout may have greater tendency to manage income via sales, overproduction, and discretionary expenses. Specifically, a firm with high market power can resort to lower prices or offer soft credit terms to manage revenue in the current year to drive out competitors from the market. One could also argue that companies with great price-setting clout can actually overproduce to manipulate income too since they are more likely to find customers to buy these products in the future unlike firms with weak product market power. Although firms with high market power can reduce discretionary expenses in the short run to influence income, they may be limited in this capacity for the following reasons. It may stand to reason that firms with high market power hold their superior pricing power because of the unique nature of their products, services, or brand image. These attributes may require higher expenditures on R&D, and sales and advertising making management of discretionary expenses difficult.
Hypothesis 1A: Firms with stronger product market pricing power will exhibit a greater propensity to manage sales which leads to higher abnormal cash flows.
Hypothesis 2A: Firms with stronger product market pricing power will exhibit a greater propensity to manage production costs which leads to lower abnormal production costs.
Hypothesis 3A: Firms with stronger product market pricing power will exhibit a greater tendency to manage discretionary expenses leading to higher abnormal discretionary expenses.
Given these opposing predictions, the correlation between competition and non-mandatory expenses remains an empirical question.
3. DATA AND MEASURES USED
3.1. Data
To begin with our sample includes all companies in the COMPUSTAT during 1987-2009. In addition companies should have data on Center for Research in Securities Prices (CRSP) and be part of NYSE/AMEX/NASDAQ with share code from 10 to 19. We exclude firms with sales/assets smaller than $ 1 million, on-US firms, and firms that change their fiscal year during the sample period. Firms are assigned to different industries based on Fama-French 49 industry classification. We drop financials (“Banks”, “Trading”, “Insurance”, and “Real Estate”) from our sample because of the differential nature of their financial statements and also eliminate utilities because they are subject to regulations. Finally, we include those firm-years with adequate data to calculate the real activities management variables. Using all the filters above, we obtain final sample of 43,628 firm-year observations with 6,019 unique firms.
3.2. Measuring Firm-Specific Price-Setting Clout
Following Gaspar and Massa (2006) and abundant industrial organization works (e.g. Lindenberg & Ross, 1981 etc.), we create our price-setting clout metric based on the Lerner Index (LI) (see Lerner, 1934) which is also denoted as the price-cost margin scaled by sales (PCM) measured as below:
𝑃𝐶𝑀 = 𝐿𝐼 ='()*+,-./','/&1'()*+ (1)
Where Sales is COMPUSTAT variable, SALE, cost of goods sold, COGS, is COMPUSTAT variable, COGS, and sales, general and administrative expenses, SG&A, is COMPUSTAT variable, XSGA.
To isolate the company-specific variables that impact price-setting clout from industry-wide factors, we calculate an adjusted metric of the Lerner Index. It is the value-weighted industry-adjusted Lerner Index (LIIA) measured as the difference between the company’s price-cost margin and the sales-weighted price-cost margin of the all companies within an industry as shown below:
𝑀𝑎𝑟𝑘𝑒𝑡𝑃𝑜𝑤𝑒𝑟 = 𝐿𝐼9− ∑=9>?𝜔9𝐿𝐼9 (2)
where LIiis the Lerner Index (as in equation (1) for company i, 𝜔9 is the fraction of revenue of company i to aggregate industry revenue where industry is categorized e according to Fama-French 49 Industry Classifications, and N is the number of companies in the industry. This adjusted Lerner Index metric measures the within-industry price-setting clout of a company.
3.3. Measurement of Income Management
industry pair. This initial stage allows us to forecast the “normal” value of cash flow from operations, and non-mandatory (discretionary) expenses. For each of these three variables we then calculate the abnormal component by taking away the forecasted component from the real value as found in dataset.
To obtain an estimate of the normal operating cash flow, we estimate coefficients 𝛼A, 𝛼?, 𝛼B, and 𝛼E in the following model.
-FGH
1GHIJ= 𝛼A+ 𝛼? ? 1GHIJ+ 𝛼B
'GH 1GHIJ+ 𝛼E
∆'GH
1GHIJ+ 𝜀9N (3)
Here i indicates companies, t indicates time, CFit indicates the cash flow from operations (Compustat variable OANCF), Ait-1 is past value of assets (Dataset variable, AT), Sit is revenue (dataset, SALE), and ΔSit is the difference in revenue calculated as St-St-1. Cash flow from operations is identified from COMPUSTAT. Then for every firm-year, abnormal cash flow (ACF) is simply the actual cash flow minus the expected cash flow estimated from the coefficients
𝛼O, 𝛼A O, 𝛼? O,B and 𝛼O,E using the appropriate industry-year regression and company’s revenue and past value of assets.
Abnormal discretionary expenses are similarly calculated where the actual discretionary expenses for the firm are subtracted from the normal discretionary expenses. The latter is computed as follows:
PQRS
1GHIJ= 𝛼A+ 𝛼? ? 1GHIJ+ 𝛼B
'GHIJ
1GHIJ+ 𝜀9N (4)
Where DEXPit is non-mandatory expenses for company i in year t, and it is the sum of R&D, Advertising and Selling, General and Administrative expenditures. The abnormal discretionary expenses (ADEXP) is computed as simply the actual non-mandatory expenditure minus the expected non-mandatory expenditure expenses based on the computed coefficients 𝛼O, 𝛼A O, ? and 𝛼OB using the appropriate industry-year regression and company’s difference in revenue and past value of assets.
The abnormal production costs are similarly calculated where the actual discretionary expenses for the firm are subtracted from the normal discretionary expenses. The latter is computed as follows:
S-.'TGH
1GHIJ = 𝛼A+ 𝛼? ? 1GHIJ+ 𝛼B
'GHIJ 1GHIJ+ 𝛼E
∆'GH 1GHIJ+ 𝛼U
∆'GHIJ
1GHIJ + 𝜀9N (5)
Where 𝑃𝐶𝑂𝑆𝑇9N= 𝐶𝑂𝐺𝑆9N+ ∆𝐼𝑁𝑉9N. Then for every firm-year, abnormal real activities measure, 𝐴𝑃𝐶𝑂𝑆𝑇, is simply the actual measure minus the normal measure computed with the forecasted coefficients 𝛼O, 𝛼A O, 𝛼? O, 𝛼B O,E and 𝛼OU from the appropriate industry-year regression and company’s revenue and past value of assets.
3.4. Description of Dataset
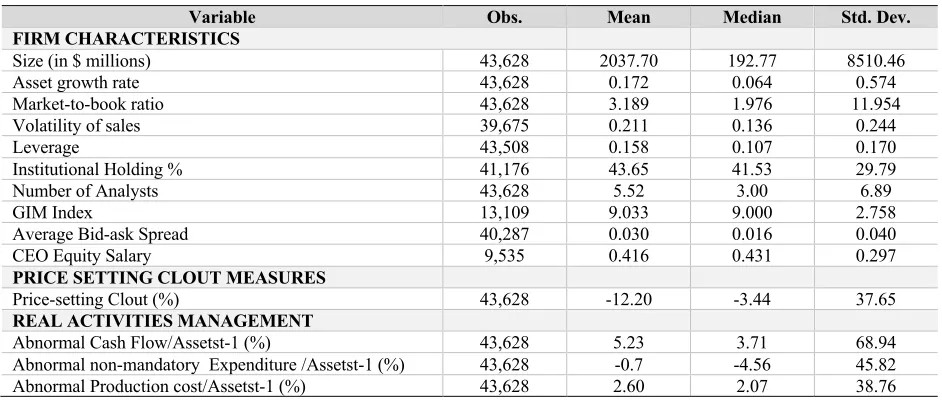
In Table 1 we show many relevant significant summary numbers. Variables are detailed in Appendix 1. The sample companies have a mean (median) market capitalization of $2,037 million ($193 million). Our typical firm is similar to Roychowdhury (2006) in terms of market capitalization ($137 million), while the median asset growth rate of 6.4 percent for our sample is similar to that reported by Yu (2008) of 9 percent. Our typical company has a volatility of 13.6 percent.
The median Market Power for our sample is -3.44, the comparable statistic in Gaspar and Massa (2006) is -5.8. Next, we report the descriptive statistics related to real activities management. The median abnormal cash flow as a proportion of lagged total assets is 3.71 percent, while the comparable figures for abnormal discretionary expenses and product cost are -4.46 and 2.07 percent, respectively.
and between abnormal cash flows and abnormal non-mandatory expenditure. We find that abnormal discretionary expenses is positively associated with asset growth, volatility and market-to-book ratio indicating that firms described by growth opportunities and greater risk are unlikely to engage in manipulating discretionary expenses downward as this may entail adverse long-term ramifications.
4. EMPIRICAL RESULTS
4.1. Multivariate Analysis
Here we look at the relationship between competition and real activities management in multiple regression, adjusting for company features revealed in the past studies, like the growth rate of assets, firm size, market-to-book ratio, leverage and volatility that have bearing on income manipulation. We use different formulations of the model given below for each of the three dependent real activities variables, ACF, ADEXP, and APCOST:
𝑅𝑒𝑎𝑙 𝐴𝑐𝑡𝑖𝑣𝑖𝑡𝑖𝑒𝑠N= βA+ β?𝑀𝑎𝑟𝑘𝑒𝑡 𝑃𝑜𝑤𝑒𝑟dN+ βB𝐺𝑟𝑜𝑤𝑡ℎdN+ βE𝑀𝑎𝑟𝑘𝑒𝑡 − 𝑡𝑜 − 𝑏𝑜𝑜𝑘dN+ βU𝑉𝑜𝑙𝑎𝑡𝑖𝑙𝑖𝑡𝑦dN+ βh𝑆𝑖𝑧𝑒dN
+βj𝐿𝑒𝑣𝑒𝑟𝑎𝑔𝑒dN+ 𝜀d (6)
where ACF is the abnormal operational cash flow, ADEXP is the abnormal non-mandatory expenditure, and APCOST is the abnormal production costs each scaled by past year lagged assets. We use year dummies to adjust for business cycle effects and industry dummies to control for differences across industries. The indexes i and t refer to company and time respectively. We cluster all the standard errors at the company level. We report the results in Table 3.
We use two representations for company growth because such companies are under more financial market pressure to manage their income (Lee, Li & Heng, 2006), namely, Growth and Market-to-book ratio. We adjust for company size for bigger companies are under greater vigil from analysts and are unlikely to indulge in income manipulation.
Using a maximum of 43,628 firm-year observations, our study establishes a connection between price-setting clout of companies and their extent of real activities management used to manipulate reported income. Our findings reveal that price-setting clout has a significant role in ascertaining a firm’s degree of real activities manipulation based on three different metrics that are commonly used in the literature. Consistent with our univariate results and with hypothesis H1, we report in Model 1 that the coefficient of abnormal cash flow from operations (ACF) is positive, 0.249, and highly significant. It is in line with the idea that low pricing power companies indulge in greater income manipulation. In Model 2, which employs abnormal production costs (APCOST) as the dependent variable, the coefficient of Market Power is -0.201, in line with our hypothesis H2. Next, in Model 3, the coefficient on Market Power is -0.070 when abnormal discretionary expense (ADEXP) is the dependent variable. This result supports hypothesis H3A. The magnitudes of the three coefficients of Market Power reveal that firms with weak pricing power engage in much larger manipulations of real activities with regard to sales and production costs but are not able to do so with respect to discretionary expenses perhaps because much of these expenses are necessary for their survival. Whilst, companies with superior price-setting clout do not have to give sales discount or resort to overproduction to manage income.
Overall, our multivariate analysis confirms the asymmetry in how firms resort to income manipulations through real activities as we find that weak market power firms are more inclined to manage sales and production costs while firms with higher market power prefer managing discretionary expenses and eschew sales manipulation that is often accompanied by price discounts that can dilute the value of the brand name. Taken together, the combination of our findings indicates that companies with lower price-setting clout strategically decide to indulge in more real activities management to impact reported income.
4.2. Accounting for the Influence of Governance Mechanisms
replace the discipline pressure of competition, then relevance of our price-setting clout variable may reduce in their presence.
The numbers reported in model 1, 4, and 7 of Table 4 confirm that the scrutiny by institutional investors does not influence managerial decisions to manipulate any of the three real activities in focus. However, the coefficients in Models 2, 5 and 8 indicate that analysts’ coverage impacts the extent to which real activities are manipulated. Model 2 which shows a negative and statistically significant coefficient suggests that greater analysts following increases abnormal cash flows (ACF) while the significantly positive coefficients in Model 5 and 8 reflects that analysts’ coverage of the firm reduces abnormal production costs (APCOST) and discretionary expenses (ADEXP). More importantly, whether analysts following, or institutional holdings are included, market-setting clout stays significant suggesting that the influence of market-setting clout remains important even after controlling for monitoring by institutional investors and analysts. Datta, Iskandar-Datta and Sharma (2011) examine whether financial analysts have more difficulty making forecasts for firms in more competitive environments (i.e. weaker pricing power). For such firms, they document that analysts’ income forecast errors are larger. Our study suggests that the difficulty of forecasting income in weak pricing environments could be due to a greater incidence of real activities management by such firms.6
Past research shows a negative relationship between poor information environment of the company and its bid-ask spreads (Leuz & Verrechia, 2000). Therefore, in Models 3, 6 and 9, we adjust for company’s information setting by including the company’s bid-ask spread. The coefficient of Spread in Model 3 is positive while it is negative in Models 6 and 9. The implication of these findings is that the higher the information asymmetry the greater the propensity to manipulate real activities. More importantly our main variable of interest Price-setting Clout remains highly significant in all the models.
4.3 Controlling for the Effect of Internal Monitoring
In this section, besides company characteristic variables, we adjust for internal governance factors. The results are shown in Table 5. We utilize Gompers, Ishii and Metrick (2003) GIM Index, that computes shareholder rights built on 24 provisions. A high value of GIM Index signifies poorer shareholder rights. Another variable that we employ to proxy for internal governance is the management compensation. Some papers demonstrate that management manage income to impact their bonuses (Guidry, Leone & Rock, 1999) and to profit from insider selling of their shares (Beneish & Vargus, 2002)7. We check the extent to which inside inducements move the impact of competitive lead in the industry, by incorporating the equity-based compensation as a portion of total CEO remuneration.
GIM Index’s coefficient, which is included in Models 1, 3 and 5, is significant and positive only in Model 3 (explaining abnormal production costs) but our main variable, Price-setting clout, stays significant in the presence of this governance proxy variable. In an un-tabulated results, we use the E-Index of Bebchuk, Cohen and Ferrel (2004) founded on 6 of the 24 provisions in the GIM index. Our results remain unchanged. The coefficient estimates on CEO EBC are insignificant except in Model 4 (explaining abnormal production costs) where it is negative. These findings imply that when management is more entrenched (high GIM index) and when equity incentives are low, there is a greater propensity to manage production costs. Nonetheless, our main variable of interest, Price-setting clout, remains significant.
Generally, our results presented in the tables reliably indicate that companies that use real activities manipulation to a greater extent are relatively small, use less debt, and have greater growth and volatility. Previously, Minton and Schrand (1999) also document that companies with greater cash-flow volatility have greater costs of outside financing. Therefore, our result of a significant link between cash flow volatility and real activities manipulation suggests that companies with increased costly outside financing tend to manage income. Maksimovic and Pichler (2001) argue that
companies that use state-of-the-art equipment and knowhow experience greater disclosure expenses. This rational indicates that companies with higher market-to-book ratio are further worried about revealing information by means of their financial reporting and would tactically manipulate income to a greater extent. Our result of positive and significant coefficients on Market-to-Book supports this surmise.
Finally, to check the robustness of our results and to circumvent any single-year abnormalities that may affect the variables, we re-estimate all our empirical results using a normalized Price-setting clout variable, All our inferences continue to hold to the use of a normalized Price-setting clout, computed as the mean of Price-setting clout (industry-adjusted Lerner Index) during last three years.
5. CONCLUSIONS
Using a large sample, we analyze three different metrics of real activities and find an interesting asymmetry in how firms resort to income manipulations through real activities. In particular, we find that firms with less dominant pricing power are more prone to engage in sales manipulation as a tool for income management. In contrast, firms with higher market power eschew sales manipulation that can entail discounts that dilute brand value. In addition, firms with weak product market positions have greater propensity to manage production costs in attempt to reduce cost of goods sold. However, firms with high pricing power favor managing discretionary spending which substantiates the idea that companies operating in tougher competitive environments have to be at the forefront of innovation and technological progress and therefore have less flexibility when it comes to R&D and marketing expenditures that are essential for firm viability. The asymmetry in real activities manipulation suggests that firms tailor their income manipulation to fit their product market profile.
Our finding that firms with inferior product pricing positions are more likely to indulge in real activities manipulation that distort the true income picture suggests that income reported by such firms are relatively more opaque. Our evidence is broadly in supportive of Verrecchia’s (1983) argument that proprietary costs in competitive industries reduce incentives for transparency.
AUTHOR BIOGRAPHIES
Sudip Datta is at The Wayne State University. He has published in Journal of Finance, Journal of Financial Economics, Financial Management, and others. E-mail: [email protected]
Mai Datta is at The Wayne State University. He has published in Journal of Finance, Journal of Financial Economics, Financial Management, and others. E-mail: [email protected]
Vivek Singh is at The University of Michigan-Dearborn. He has published in Financial Management, Journal of Financial Research, Journal of Applied Business Research, and others. E-mail: [email protected]
REFERENCES
Abdallah A.A., & Hussain, S. (2012). Do UK firms manage income to meet dividend thresholds?, Accounting and Business Research,42, 77-94.
Bartov, E. (1993). The timing of asset sales and income manipulations, Accounting Review68, 840 - 855.
Bebchuk, L., Cohen, A. & Ferrell A. (2004) What Matters in Corporate Governance? Review of Financial Studies, 22, 783-827. Bens, D., Nagar V. & Wong, M. (2002). Real investment implications of employee stock option exercises. Journal of Accounting
Research, 40, 359–406.
Beneish, D. & Vargus M. (2002). Insider trading, earnings quality, and accrual mispricing, Accounting Review 77, 755-791. Bergstresser, D. & Philippon, T. (2006). CEO incentives and earnings management. Journal of Financial Economics 80,
511-529.
Bowen, R., Rajgopal, S. & Venkatachalam, M. (2008) Accounting Discretion, Corporate Governance and Firm Performance,
Contemporary Accounting Research 25, 351-405.
Bushee, B. (1998). The influence of institutional investors on myopic R&D investment behavior. The Accounting Review 73,
305–33.
Datta, S., Iskandar-Datta, M. & Sharma, V. (2011). Product market pricing power, industry concentration and analysts’ income forecasts, Journal of Banking and Finance 35, 1352-1366.
Datta, S., Iskandar-Datta, M. & Singh, V. (2013). Product market pricing power, industry concentration and analysts’ income forecasts, Journal of Banking and Finance 37, 3273-3285.
Fama, E. (1980). Agency Problems and the Theory of the Firm, Journal of Political Economy 88, 288-307.
Gaspar, J. & Massa, M. (2006). Idiosyncratic volatility and product market competition, Journal of Business 79, 3125-3152. Guadalupe, M. & Pérez-González, F. (2010). Competition and Private Benefits of Control, Working Paper, Columbia University. Gompers, P., Ishii, J. & Metrick, A. (2003). Corporate Governance and Equity Prices, Quarterly Journal of Economics118,
107-155.
Graham, J., Harvey, C. & Rajgopal, S. (2005). The economic implications of corporate financial reporting, Journal of Accounting and Economics 40, 3-73.
Grullon, G. & Michaely, R. (2007). Corporate payout policy and product market competition, Working Paper, Rice University. Guidry, F., Leone, A. & Rock, S. (1999). Earnings-based bonus plans and earnings management by business unit managers.
Journal of Accounting and Economics 26, 113-142.
Gunny, K. (2010) The relation between earnings management using real activities manipulation and future performance: Evidence from meeting earnings benchmarks, Contemporary Accounting Research 27, 855-888.
Hart, O. (1983). The Market Mechanism as an Incentive Scheme, The Bell Journal of Economics 14, 366-382.
Haushalter, D., Klasa, S. & Maxwell, W. (2006). The influence of product market dynamics on a firm’s cash holdings and hedging behavior, Journal of Financial Economics 84, 797-825.
Healy, P. & Wahlen, J. (1999). A review of the earnings management literature and its implications for standard setting,
Accounting Horizons 13, 365-383.
Holmström, B. (1982) The Moral Hazard in Teams, The Bell Journal of Economics 13, 324-340.
Holland, K., & Jackson, R. (2004). Earnings management and deferred tax, Accounting and Business Research 34, 101-123. Hotelling, H. (1929). Stability in competition, Economic Journal 39, 41-57.
Lang, M. & Lundholm, R. (1996). Corporate disclosure policy and analyst behavior. The Accounting Review 71, 467–492. Lee, C., Li, L. & Heng, Y. (2006). Performance, growth and earnings management, Review of Accounting Studies 11, 305-334. Lerner, A. (1934). The concept of monopoly and the measurement of monopoly power. Review of Economic Studies 1, 157-175. Leuz, C., & Verrecchia, R. (2000). The economic consequences of increased disclosure, Journal of Accounting Research 38,
91-124.
Lindenberg, E. & Ross, S. (1981). Tobin's q ratio and industrial organization, Journal of Business 54, 1-32.
Maksimovic, M., & Pichler, P. (2001). Technological innovation and initial public offerings, Review of Financial Studies 14,
459-494.
Minton, B. & Schrand, C. (1999). The impact of cash flow volatility on discretionary investment and the costs of debt and equity financing, Journal of Financial Economics 54, 423-460.
Nalebuff, B. & Stiglitz, J. (1983), Prices and incentives: towards a general theory of compensation and competition, Bell Journal of Economics 14, 21-43.
Raith, M. (2003). Competition risk and managerial incentives, American Economic Review 93, 1425-1436.
Roychowdhury, S. (2006). Earnings management through real activities manipulation, Journal of Accounting and Economics 42,
335-370.
Saleh, N. & Ahmed, K. (2005). Earnings management of distressed firms during debt, renegotiation, Accounting and Business Research 35, 69-86.
Schmidt, K. (1997). Managerial incentives and product market competition, Review of Economic Studies 64, 191-213. Schumpeter, J. (1912). The theory of economic development. Harvard University Press, Cambridge, Mass.
Skinner, D. & Sloan, R. (2002). Earnings surprises, growth expectations, and stock returns or don’t let an earnings torpedo sink your portfolio, Review of Accounting Studies 7, 289-312.
Stivers, A. (2004). Unraveling of information: Competition and uncertainty. B.E. Journal of Theoretical Economics 4, 1-30. Thomas, J. & Zhang, H. (2002). Inventory changes and future returns, Review of Accounting Studies 7, 163–187.
Verrecchia, R. (1983). Discretionary disclosure, Journal of Accounting and Economics 5, 365-380. Yu, F. (2008). Analyst coverage and earnings management, Journal of Financial Economics 88, 245-271.
APPENDIX 1
Variable Definitions
Asset Growth is computed as the difference in total assets (COMPUSTAT item AT) divided by past year assets.
Bid-Ask Spread is calculated as mean of the daily closing (ask price-bid price)/closing price for each company in each year.
CEO EBC is measured as the value of equity-based compensation ($ sum of granted options and restricted stockholdings) divided by aggregate CEO remuneration.
GIM Index is an index computing shareholder rights developed by Gompers, Ishii, and Metrick (2003) integrating 24 governance provisions and state antitakeover law such as charter and bylaw provisions.
Institutional holdings for each company is computed as the aggregate shareholding of all institutional investors recorded in the 13-F quarterly files distributed over the number of shares outstanding. Institutional shareholdings is assumed to remain constant during subsequent months till the next quarter holdings information becomes available.
Leverage is computed as past one year total long-term debt (COMPUSTAT item DLTT) spread over total assets (COMPUSTAT item AT).
Size is calculated as the number of shares outstanding multiplied with market price of the share (CRSP files).
Price-setting Clout calculated as Revenue (COMPUSTAT item sale) minus cost of goods sold (COMPUSTAT COGS) minus sales, general and administrative expenses (COMPUSTAT item XSGA) spread over revenue, which is industry-adjusted by subtracting sales-weighted price-cost margin of all companies within an industry.
Market-to-book is market capitalization divided by the book value of the firm (COMPUSTAT item CEQ).
Number of Analyst is number of useable forecasts used to calculate average monthly income estimate for each company in summary IBES dataset.
Table 1. Descriptive Statistics
This table shows summary statistics for important variables of our dataset. We have grouped the descriptive statistics into four categories: company characteristics variables, Price-setting clout metric, industry competition metrics, and real activities manipulation measures. The statistics are founded on a maximum of 43,628 firm-year observations extracted from the merger of the COMPUSTAT and CRSP databases for 1987-2009. These denote 6,019 unique companies spread over 36 industries constructed from Fama-French 49 Industry classification. All variables are described in Appendix 1.
Variable Obs. Mean Median Std. Dev.
FIRM CHARACTERISTICS
Size (in $ millions) 43,628 2037.70 192.77 8510.46
Asset growth rate 43,628 0.172 0.064 0.574
Market-to-book ratio 43,628 3.189 1.976 11.954
Volatility of sales 39,675 0.211 0.136 0.244
Leverage 43,508 0.158 0.107 0.170
Institutional Holding % 41,176 43.65 41.53 29.79
Number of Analysts 43,628 5.52 3.00 6.89
GIM Index 13,109 9.033 9.000 2.758
Average Bid-ask Spread 40,287 0.030 0.016 0.040
CEO Equity Salary 9,535 0.416 0.431 0.297
PRICE SETTING CLOUT MEASURES
Price-setting Clout (%) 43,628 -12.20 -3.44 37.65
REAL ACTIVITIES MANAGEMENT
Abnormal Cash Flow/Assetst-1 (%) 43,628 5.23 3.71 68.94
Abnormal non-mandatory Expenditure /Assetst-1 (%) 43,628 -0.7 -4.56 45.82
Abnormal Production cost/Assetst-1 (%) 43,628 2.60 2.07 38.76
Table 2. Correlation Matrix of Firm Characteristics and Real Activities Management
This table shows correlations of some important company variables of our dataset and the three metrics f real activities management. The statistics are founded on a maximum of 43,628 firm-year observations extracted from the merger of the COMPUSTAT and CRSP databases for 1987-2009.All variables are described in Appendix 1. Correlations in bold signify significance at the 1% level or better.
Variables ACF APCOST ADEXP Volatility Growth Market-to-Book Size Leverage
ACF 1.00 -0.09 0.04 -0.03 -0.03 0.01 0.00 0.04
APCOST 1.00 -0.18 0.05 0.05 -0.01 -0.03 -0.03
ADEXP 1.00 0.12 0.12 0.12 0.05 -0.04
Volatility 1.00 0.34 0.03 -0.06 -0.10
Growth 1.00 0.05 0.02 0.03
Market-to-Book 1.00 0.03 0.00
Size 1.00 0.02
Table 3. Market Power and Real Activities Management
This table shows the findings of OLS regressions probing the influence of Price-setting clout on various real activities measures. The statistics are founded on a maximum of 43,628 firm-year observations extracted from the merger of the COMPUSTAT and CRSP databases for 1987-2009.The dependent variables are: the abnormal cash flows (ACF), abnormal production cost (APCOST) and abnormal discretionary expenses (ADEXP) (described in the text). All variables are described in Appendix 1.P-values shown in the parentheses are calculated with standard errors controlled for company-level clustering.
Independent Variables
Dependent Variables
ACF APCOST ADEXP
Model 1 Model 2 Model 3
Price-setting Clout (<0.00) 0.249 (<0.00)-0.201 (<0.00) -0.074
Growth (0.90) 0.143 -2.476 (0.00) (<0.00) 10.923
Log (Market-to-Book)/100 -0.394 (0.45) (<0.00) -6.841 (<0.00) 9.243
Size/1000 (0.00) 8.402 (<0.00) 11.375 (<0.00) -28.976
Leverage (<0.00) -10.036 (<0.00) 18.378 (<0.00) -25.406
Volatility/100 (<0.00) -8.470 (<0.00)15.795 (<0.00) 8.037
Constant (0.00) 0.0322 (0.00) 0.0322 -0.028 (0.31)
Year Dummy Yes Yes Yes
Industry Dummy Yes Yes Yes
Table 4. Market Power, Real Activities Management and Firm’s Information Environment
This table shows the findings of OLS regressions exploring the influence of price-setting clout on various real activities measures. The statistics are founded on a maximum of 43,628 firm-year observations extracted from the merger of the COMPUSTAT and CRSP databases for 1987-2009. The abnormal cash flow (ACF), the abnormal production expenses (APCOST) and the abnormal non-mandatory expenditure (ADEXP) (defined in the text). All other variables are described in Appendix 1. P-values shown in the parentheses are calculated with standard errors controlled for company-level clustering.
Independent Variables Model 1 Model 2 ACF Model 3 Model 4 APCOST Model 5 Model 6
Price-setting clout (<0.00) 0.249 (<0.00) 0.250 (<0.00) 0.249 (<0.00) -0.200 (<0.00) -0.203 (<0.00) -0.199
Institutional Holdings (0.70) 0.006 -0.021 (0.15)
Log (1+Num of analyst)/100 (0.00) 1.675 (<0.00) -2.821
Bid-Ask Spread/100 (<0.00) 0.331 -0.154 (0.04)
Growth (0.94) 0.082 (0.83) 0.235 (0.81) 0.277 -2.463 (0.00) -2.631 (0.00) -2.576 (0.00)
Log (Market-to-Book)/100 -0.552 (0.32) -0.267 (0.60) -0.620 (0.28) (<0.00) -6.916 (<0.00) -7.055 (<0.00) -6.821 Size/1000 (0.00) 8.535 (0.64) 1.332 (<0.00) 13.706 (<0.00) 12.468 (<0.00) 23.278 (<0.00) 9.445 Leverage (<0.00) -9.963 (<0.00) -10.412 (<0.00) -10.062 (<0.00) 18.857 (<0.00) 19.011 (<0.00) -18.268 Volatility/100 (<0.00) -9.081 (<0.00) -8.685 (<0.00) -8.846 (<0.00) 16.244 (<0.00) 16.157 (<0.00) 16.132
Constant (0.08) 0.029 (0.84) 0.002 (0.01) 0.030 -0.010 (0.65) (0.34) 0.021 -0.019 (0.35)
Year Dummy Yes Yes Yes Yes Yes Yes
Industry Dummy Yes Yes Yes Yes Yes Yes
Number of Obs. 37,388 39,563 39,408 37,388 39,563 39,408
Independent Variables Model 7 Model 8 ADEXP Model 9
Price-setting clout (<0.00)-0.074 (<0.00) -0.073 (<0.00) -0.070
Institutional Holdings (0.12) 0.023
Log (1+Num of analyst)/100 (<0.00) -2.232
Bid-Ask Spread/100 -0.231 (0.01)
Growth (<0.00) 10.954 (<0.00) 11.046 (<0.00) 10.757
Log (Market-to-Book)/100 (<0.00) 9.744 (<0.00) 9.412 (<0.00) 9.573
Size/1000 (<0.00) -31.784 (<0.00) -38.393 (<0.00) -34.041
Leverage (<0.00) -26.298 (<0.00) -25.907 (<0.00) -24.874
Volatility/100 (<0.00) 8.023 (<0.00) 7.750 (<0.00) 8.089
Constant -0.050 (0.10) -0.067 (0.02) -0.036 (0.21)
Year Dummy Yes Yes Yes
Industry Dummy Yes Yes Yes
Table 5. Price-setting Clout, Real Activities Management And Governance
This table shows the findings of OLS regressions inspecting the impact of price-setting clout on various real activities measures. The statistics are founded on a maximum of 43,628 firm-year observations extracted from the merger of the COMPUSTAT and CRSP databases for 1987-2009.The abnormal non-mandatory expenditure is defined in the text. All other variables are described in Appendix 1. P-values shown in the parentheses are calculated with standard errors controlled for company-level clustering.
Independent Variables Model 1 ACF Model 2 Model 3 APCOST Model 4 Model 5 ADEXP Model 6
Price-setting clout (0.00)0.238 (0.01) 0.307 (<0.00) -0.218 (<0.00) -0.225 -0.067 (0.00) -0.059 (0.04)
GIM Index/100 (0.81) 0.049 (0.01) 0.477 -0.070 (0.71)
CEO EBC -0.329 (0.88) -3.704 (0.007) (0.59) 0.764
Growth (0.83) 0.893 -1.066 (0.77) -4.558 (0.00) (<0.00) -5.739 (<0.00) 10.496 (<0.00) 8.577 Log (Market-to-Book)/100 (0.03)2.244 (0.32) 1.546 (<0.00) -8.848 (<0.00) -9.292 (<0.00) 9.005 (<0.00) 7.961 Size/1000 (0.19) 5.580 12.010 (0.04) (<0.00) 20.650 (<0.00) 25.792 (<0.00) -39.718 (<0.00) -35.820 Leverage -15.479 (0.00) -17.172 (0.03) (<0.00) 26.649 (<0.00) 28.208 (<0.00) -33.976 (<0.00) -30.775 Volatility of Sales/100 -12.430 (0.00) -3.100 (0.44) (<0.00) 21.364 (<0.00) 22.609 (0.58) 1.991 (0.03) 8.466
Constant -0.013 (0.55) (0.04) 0.070 -0.085 (0.01) -0.084 (0.01) (0.52) 0.025 (0.16) 0.053
Year Dummy Yes Yes Yes Yes Yes Yes
Industry Dummy Yes Yes Yes Yes Yes Yes