ScholarlyCommons
Publicly Accessible Penn Dissertations
Spring 5-17-2010
Exploring the Relationship between Middle School
Children’s Body Mass Index and the Home Food
Environment within the Contextual Process of
Food Choice
Joanna E. Holsten
University of Pennsylvania, [email protected]
Follow this and additional works at:http://repository.upenn.edu/edissertations
Part of theCommunity Health and Preventive Medicine Commons,Maternal and Child Health Commons,Maternal, Child Health and Neonatal Nursing Commons, and thePublic Health and Community Nursing Commons
This paper is posted at ScholarlyCommons.http://repository.upenn.edu/edissertations/130 For more information, please [email protected].
Recommended Citation
Holsten, Joanna E., "Exploring the Relationship between Middle School Children’s Body Mass Index and the Home Food Environment within the Contextual Process of Food Choice" (2010).Publicly Accessible Penn Dissertations. 130.
Exploring the Relationship between Middle School Children’s Body Mass
Index and the Home Food Environment within the Contextual Process of
Food Choice
Abstract
Rates of childhood obesity and comorbidities have been escalating steadily over the past three decades. Children’s food environment may promote excessive consumption of energy-dense food. This concurrent mixed-methods dissertation examined the relationship between physical home food environment (availability and accessibility) and body mass index (BMI) of middle school children within the contextual process of their food choices. Sixty-five children from a U.S. public middle school were enrolled. BMI z-scores were calculated based on measured weight and height, and derived against national reference data for standardization. Food store receipt and purchase log data were collected as a measure of home food availability. Home food accessibility, dietary intake, and other BMI covariates were measured via questionnaires and recalls. Hierarchical multiple regression analyses were conducted (n=58 participants). Semi-structured interviews were conducted with a sub-sample of children (n=47 participants) to explore factors that affect their food choices in the home. A data-driven content analysis was performed. Quantitative and qualitative data were integrated in analysis by exploring the differences in qualitative data by overweight status and in the interpretation of the results. Home food availability and accessibility were not significantly associated with BMI z-scores. However, dietary intake of fruits, low-fat dairy, and sugar-sweetened beverages were correlated with their availability in the home. Qualitative data revealed that children’s food choice in the home was a dynamic process involving three main interacting components – the child, parent, and food – embedded in the context of time. Overweight children emphasized weight concerns and nutritional aspects of foods, such as calories, in describing their food choices. Compared to healthy weight children, overweight children also expressed greater emotion in their preferences for and awareness of higher-energy foods in their homes. The inconsistency between the desire to lose weight and preferences for and awareness of higher-energy foods along with the significant associations between availability and intake support a focus on physical home environment within family-based obesity interventions. Future research should test the relationship between the home food environment, dietary intake, and BMI with larger cross-sectional or prospective studies and explore children’s process of food choice in other settings.
Degree Type Dissertation
Degree Name
Doctor of Philosophy (PhD)
Graduate Group Nursing
First Advisor
Charlene W. Compher
home food environment, body mass index, children, obesity, food availability, food choice
Subject Categories
Community Health and Preventive Medicine | Maternal and Child Health | Maternal, Child Health and Neonatal Nursing | Public Health and Community Nursing
BODY MASS INDEX AND THE HOME FOOD ENVIRONMENT WITHIN THE
CONTEXTUAL PROCESS OF FOOD CHOICE
Joanna E. Holsten
A DISSERTATION
in
Nursing
Presented to the Faculties of the University of Pennsylvania
in
Partial Fulfillment of the Requirements for the
Degree of Doctor of Philosophy
2010
Supervisor of Dissertation_____________________________________________
Charlene W. Compher, PhD, RD, FADA, CNSC, LDN
Associate Professor of Nutrition Science
Graduate Group Chairperson ____________________________________________ Lorraine J. Tulman, DNSc, RN, FAAN
Associate Professor of Nursing
Dissertation Committee
Janet A. Deatrick, PhD, FAAN, RN Associate Professor of Nursing
Shiriki Kumanyika, PhD, MPH Professor of Epidemiology
Jennifer Pinto-Martin, PhD, MPH
DEDICATION
ABSTRACT
EXPLORING THE RELATIONSHIP BETWEEN MIDDLE SCHOOL CHILDREN’S
BODY MASS INDEX AND THE HOME FOOD ENVIRONMENT WITHIN THE
CONTEXTUAL PROCESS OF FOOD CHOICE
Joanna E. Holsten
Charlene W. Compher
Rates of childhood obesity and comorbidities have been escalating steadily over the past
three decades. Children’s food environment may promote excessive consumption of
energy-dense food. This concurrent mixed-methods dissertation examined the
relationship between physical home food environment (availability and accessibility) and
body mass index (BMI) of middle school children within the contextual process of their
food choices. Sixty-five children from a U.S. public middle school were enrolled. BMI
z-scores were calculated based on measured weight and height, and derived against
national reference data for standardization. Food store receipt and purchase log data were
collected as a measure of home food availability. Home food accessibility, dietary intake,
and other BMI covariates were measured via questionnaires and recalls. Hierarchical
multiple regression analyses were conducted (n=58 participants). Semi-structured
interviews were conducted with a sub-sample of children (n=47 participants) to explore
factors that affect their food choices in the home. A data-driven content analysis was
performed. Quantitative and qualitative data were integrated in analysis by exploring the
differences in qualitative data by overweight status and in the interpretation of the results.
z-scores. However, dietary intake of fruits, low-fat dairy, and sugar-sweetened
beverages were correlated with their availability in the home. Qualitative data revealed
that children’s food choice in the home was a dynamic process involving three main
interacting components – the child, parent, and food – embedded in the context of time.
Overweight children emphasized weight concerns and nutritional aspects of foods, such
as calories, in describing their food choices. Compared to healthy weight children,
overweight children also expressed greater emotion in their preferences for and
awareness of higher-energy foods in their homes. The inconsistency between the desire to
lose weight and preferences for and awareness of higher-energy foods along with the
significant associations between availability and intake support a focus on physical home
environment within family-based obesity interventions. Future research should test the
relationship between the home food environment, dietary intake, and BMI with larger
cross-sectional or prospective studies and explore children’s process of food choice in
TABLE OF CONTENTS
LIST OF TABLES………...………..….xi
LIST OF FIGURES………..….xii
INTRODUCTION………...1
1. Introduction and Significance………..1
2. Overall Objective and Aims……….7
Specific Aim 1……….8
Hypothesis 1……….8
Hypothesis 2……….8
Hypothesis 3……….8
Specific Aim 2……….9
Specific Aim 3……….9
3. Manuscript Overview………...9
FIRST MANUSCRIPT - Measuring Home Food Availability: Evaluation of Food Receipt and Food Purchase Log Collection Methodology………....12
1. ABSTRACT………...13
2. INTRODUCTION……….………14
3. METHODS………15
Data Collection………..15
Data Entry………..16
Data Coding………...…16
4. EVALUATION...………...……….…….19
Process Evaluation……….………19
Seasonality Findings………..………20
Correlation Between Receipt/Log and Questionnaire Data………...………21
5. DISCUSSION………21
Comparison with Other Receipt Protocols………21
Comparison with Other Measurement Methods………23
Limitations……….24
6. IMPLICATIONS………...25
7. ACKNOWLEDGEMENTS………...25
8. REFERENCES………..…26
SECOND MANUSCRIPT - The Process of Children’s Food Choice in the Home Environment: A Qualitative Descriptive Study……….31
1. ABSTRACT………...32
2. INTRODUCTION……….…33
3. METHODS………....35
Approach………....35
Setting………35
Sampling Methods……….35
Participants………36
Semi-Structured Interview Guide………..37
Data Analysis……….38
4. RESULTS………..40
The Context of Time……….……….…41
The Child………...…42
Hunger levels: Fill me up. ………43
Food preferences: Love, hate, like, don’t like, whatever……….…..44
Time pressure and activity prioritization: I don’t have time………..46
Lack of food preparation effort and skills: Grab and open…………..…..47
Expected physical consequence of food: Food helps and hurts………….48
The Parent……..………48
Parent presence: When mom’s home.………...….49
Time pressure and activity prioritization: Mom doesn’t have time……...49
Parent effort and skill: If mom doesn’t feel life cooking………...50
Family food preferences: Everybody likes it……….…50
Financial concerns: Not enough money……….…51
Health concerns: Keeping the family healthy………51
The Food………51
Food attributes: Sweet, salty, hot, homemade………...52
Food available at home: Whatever we have in there……….…53
Food cost: Expensive or on sale. ………...…53
Outside Influences……….…54
Media. ………...55
Food stores. ………...55
Restaurants. ………...55
School. ………..55
Actions………...56
Food purchasing: Parent buys.………...56
Food preparation: Parent picks and prepares………57
Rules, guidance, and modeling: Parent allows, says, wants, does………57
Reciprocal requests: Asking and picking………..58
Child’s food choice: I pick, I make, I have, I don’t eat……….58
5. DISCUSSION………...….60
Theoretical Comparisons………...62
Strengths………...….63
Limitations……….63
Implications for Research……….…….64
6. ACKNOWLEDGEMENTS……….……..66
7. REFERENCES………...………….…….67
THIRD MANUSCRIPT- Understanding the Relationship Between Children’s Body Mass Index and Home Food Environment within the Context of Food Choice: A Concurrent Mixed Methods Study………75
1. ABSTRACT………...76
3. METHODS………80
Design………80
Study Sample……….81
Measures………81
Food environment. ………81
Body measurements. ……….…82
Potential covariates. ………..…83
Factors that affect food choice. ………..…...83
Study Procedures………...84
Data Analysis……….84
4. RESULTS………..87
Description of the Main Quantitative Variables and Bivariate Relationships…...87
Participant and household characteristics. ………87
Non-dietary covariates. ……….88
Dietary intake. ………...88
Intake or purchase of food from restaurants, food stores, and school…...89
Physical home food environment: availability and accessibility………...89
Multivariate Relationship between the Physical Home Food Environment and BMI………90
Qualitative Factors that Affect Children’s Food Choice in the Home by Overweight Status………..91
Expected physical consequences of food: Weight concerns………..92
Home food availability and attributes………92
5. DISCUSSION………93
Strengths and Limitations……….96
Implications……….……….97
6. ACKNOWLEDGEMENTS………..99
7. REFERENCES………....100
CONCLUSION………117
REFERENCES CITED………..…..123
LIST OF TABLES
FIRST MANUSCRIPT
Table 1. Food group category definitions and examples of items
included or excluded by the coding rules for each group………..29
Table 2. Correlation between receipt/log data and child-reported and
parent-reported questionnaire data for home food availability variables………..30
THIRD MANUSCRIPT
Table 1. Effect size estimates and corresponding variable and
regression sets utilized in the sample size calculation……….107
Table 2. Descriptive statistics of non-dietary variables and
bivariate correlations with BMI………...…108
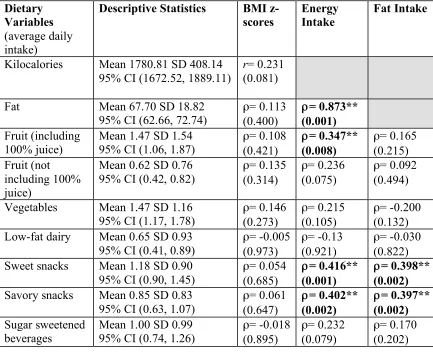
Table 3. Descriptive Statistics of dietary variables and bivariate
correlations with BMI z-scores and intake variables………...109
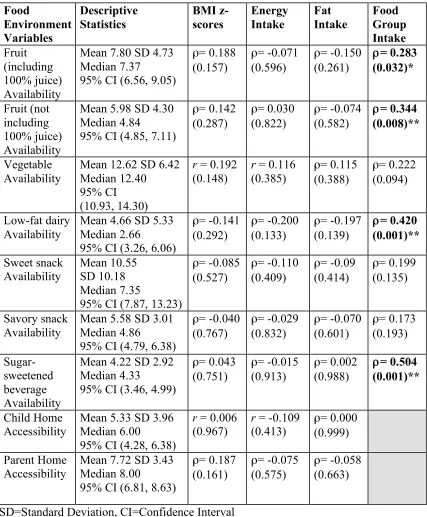
Table 4. Descriptive Statistics of home food environment variables
and bivariate correlations with BMI z-scores and intake variables……….110
Table 5. Hierarchical Linear Regression for Body Mass Index
Z-Scores for Middle School Children (n=58)………..111
APPENDIX
Table of evidence summarizing studies that examined the relationship
LIST OF FIGURES
SECOND MANUSCRIPT
Figure 1. A model depicting the process of children’s food choices
in the home setting……….73
Figure 2. A flow diagram depicting a child’s food choices throughout
a typical week. ………..…74
THIRD MANUSCRIPT
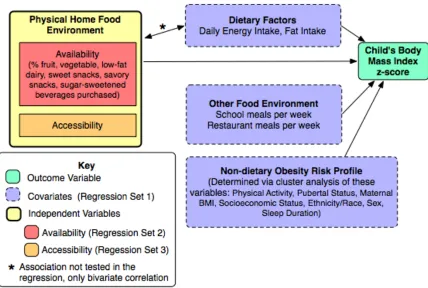
Figure 1. Conceptual Model of the Quantitative Variables………...………112
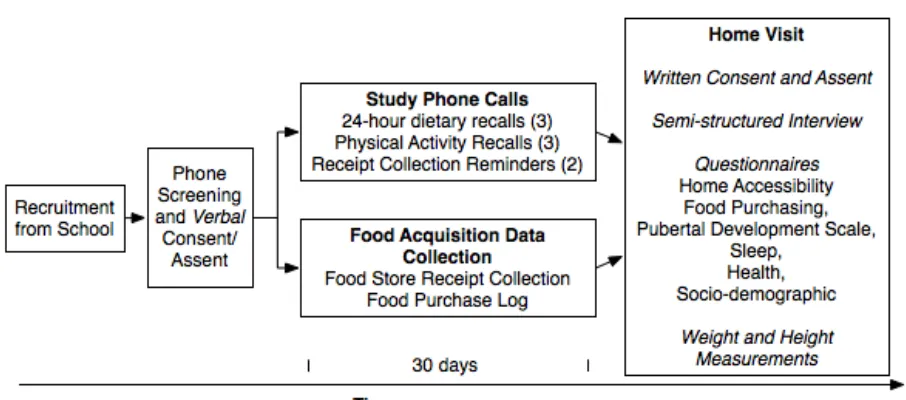
Figure 2. Study Flow Diagram. ………...……113
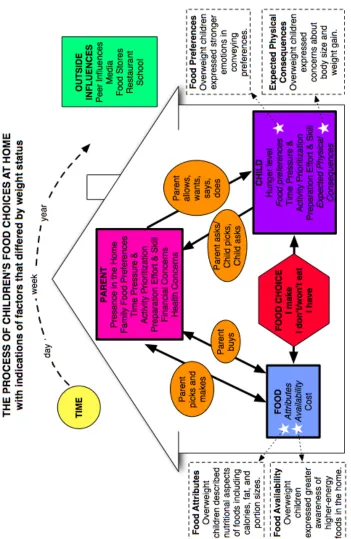
Figure 3. The Process of Children’s Food Choices at Home………...……114
Figure 4. Healthy Weight Children’s Unprompted Responses for
Food Available at Home………..…115
Figure 5. Overweight Children’s Unprompted Responses for
Exploring the Relationship between Middle School Children’s Body Mass Index and
the Home Food Environment within the Contextual Process of Food Choice
Introduction and Significance
Childhood obesity, defined as at or above the 95th body mass index (BMI)
percentile, affects 19% of children ages 6 to 19 years in the United States, a three fold
increase over almost three decades (Ogden, Carroll, Curtin, Lamb, & Flegal, 2010).
Obesity in children is associated with physical, social, and mental health co-morbidities
such as type 2 diabetes mellitus, social stigma, and depression respectively (Institute of
Medicine, 2005). Due to the overwhelming prevalence and severe health consequences,
childhood obesity prevention and treatment quickly emerged as national health priorities.
Healthy People 2010 listed obesity as a leading health indicator and many of the
co-morbidities as crucial focus areas (U.S. Department of Health and Human Services,
2000).
At the individual level, obesity results when more energy is consumed than
expended over an extended period of time (U.S. Department of Health and Human
Services, 2009b). Dietary intake and physical activity are the primary behaviors
underlying this imbalance, however interventions targeting these behaviors at the
individual level have not had lasting impact (Summerbell et al., 2005). The Ecological
Model of Health Behavior captures a broad view of behavior and considers five primary
levels of influence: intrapersonal factors, interpersonal processes and primary groups,
organizational factors, community factors, and public policy (Sallis & Owens, 2002).
These levels interact, leading to reciprocal causation (McLeroy, Bibeau, Steckler, &
obesity epidemic and the interactions of environmental factors with individual
behaviors represent some of the greatest gaps in the literature.
Widespread and profound societal changes during the last few decades have
increased the availability of inexpensive, convenient, energy-dense food (Hill, Wyatt,
Reed, & Peters, 2003). Between 1985 and 2000, food supply trends have indicated an
increase in added sugars, fats, and grains, especially refined grains, compared to other
food groups. Food cost trends have shown the opposite effect, with fruits and vegetables
prices increasing the most and carbonated soft drinks increasing the least in retail price
(Putnam, Allshouse, & Kantor, 2002). At the same time, many children are deviating
from national nutrition recommendations. In recent studies, percentages of youth
meeting the United States Department of Agriculture (USDA) recommendations ranged
from approximately 30% for fruit, grain, meat, and dairy to 36% for vegetables. Sixteen
percent of youth did not meet any recommendations, and only 1% met all
recommendations (Munoz, Krebs-Smith, Ballard-Barbash, & Cleveland, 1997). These
changes in the food environment and dietary patterns of children have coincided with the
upward trajectory of obesity (Binkley, Eales, & Jekanowski, 2000). Many leading health
organizations call for environmental solutions to stem the epidemic (Kumanyika, 2001;
World Health Organization & Food and Agriculture Organization of the United Nations,
2003). However, limited research is available to describe the relationship between the
food environment and obesity, particularly for children. This research study helps
address this critical gap in obesity research.
The food environment involves sources of energy and other nutrients and the
children spans numerous settings, including food stores, restaurants, homes, and
schools. Of all these settings, the home environment plays a crucial role in children’s
food consumption habits. Although food consumed away-from-home is increasing,
national data demonstrate that children consume two thirds of their food intake at home
(Adair & Popkin, 2005; Guthrie, Lin, & Frazao, 2002; Neilsen, Siega-Riz, & Popkin,
2002). In addition, eating at home provided the greatest amount of energy from
low-nutrient, energy-dense foods on a typical school day (Briefel, Wilson, & Gleason, 2009)
and the majority of sugar-sweetened beverages are consumed in the home environment
(Wang, Bleich, & Gortmaker, 2008). The home food environment is particularly
complex due to the influence of other organizations, such as food stores and restaurants,
and interpersonal influences of the family (Glanz, Sallis, Saelens, & Frank, 2005). The
physical home food environment involves availability and accessibility of food in an
individual’s residence. Availability refers to the presence of foods in an environment.
Accessibility refers to the placement, preparation, and maintenance of the foods that
encourage consumption (Hearn et al., 1998).
The physical home food environment is a fundamental element of food choice; if
food is not available and accessible to a child, the child cannot consume it. In addition,
the home food environment provides a context of learning about food and nutrition
(Birch & Davison, 2001). The physical home food environment is theorized to influence
the BMI of children as follows: less availability of lower-energy foods predicts lower
consumption and greater availability of higher-energy foods predict higher consumption
leading toward excess energy intake and eventual obesity (Rosenkranz & Dzewaltowski,
systematic bias by BMI (Savage, Mitchell, Smiciklas-Wright, Symons Downs, &
Birch, 2008), and the educational and contextual implications of the environment, it is
important to study the direct relationship between the physical home food environment
and BMI, beyond dietary intake.
Many cross-sectional studies have found direct associations between the
availability and accessibility of foods in children’s homes and the intake of those foods
(Pearson, Biddle, & Gorely, 2009). However, only six studies investigated the
relationship between the home food environment and weight status (Ard et al., 2007;
Byrd-Bredbenner & Abbot, 2009; Downs et al., 2009; Gable & Lutz, 2000; Haines,
Neumark-Sztainer, Wall, & Story, 2007; Humenikova & Gates, 2008). The appendix
contains a table of evidence that summarizes these six studies. Five of the six studies did
not find significant associations between the home food environment variables and
weight status (Ard et al., 2007; Downs et al., 2009; Gable & Lutz, 2000; Haines et al.,
2007; Humenikova & Gates, 2008). A single study found that greater availability of
vegetables was significantly associated with lower BMI-for-age (Humenikova & Gates,
2008). Two studies found unexpected inverse relationships with greater availability of
high-energy snack foods inversely associated with overweight in girls (Haines et al.,
2007) and the nutrition adequacy ratios for energy and saturated fat available at home
significantly lower in households with obese children (Byrd-Bredbenner & Abbot, 2009).
These mixed results may be due to the limitations of self-reported or cross-sectional food
environment measures and the lack of consideration to covariates for weight status.
While a solid foundation of research has investigated the effect of the physical home food
between the home food environment and body mass index (BMI) using valid
measures and designs.
In addition to quantitatively assessing the relationship between the physical home
food environment and BMI, an investigation of the specific factors that influence this
relationship is also needed. Many qualitative studies have explored parents’ and
children’s perceptions of general factors that affect food choice, particularly for fruit and
vegetable intake. Focus groups with youth in middle and/or high school found that many
factors influence food choices including: taste, availability of foods at home, hunger,
food cravings, health benefits, time and effort of food preparation and consumption, cost,
advertising, parent support (modeling, cooking, buying, and serving foods), peer
support/approval, body image, and mood (Cullen et al., 2003; McKinley et al., 2005;
Molaison, Connell, Stuff, Yadrick, & Bogle, 2005; Neumark-Sztainer, Story, Perry, &
Casey, 1999; Wind, Bobelijn, De Bourdeaudhuij, Klepp, & Brug, 2005). However, many
of these studies employed a directed approach using established theories to guide the
questions and analysis, which may have limited the findings to pre-specified concepts or
pathways and discounted potentially important factors. In some of these studies, details
of the analysis were not described raising questions about the credibility of the findings.
No studies have directly explored factors that potentially influence the relationship
between the physical home food environment and BMI with inductive methods. By
qualitatively exploring child’s perceptions of the home food environment and their food
choices within the environment, the relationship can be better understood and potential
solutions can be identified.
between the physical home food environment and BMI z-scores within the context
of food choices for middle school children. Quantitative data on the availability and
accessibility of foods in the home and qualitative data on factors that affect food choice
in the home were collected concurrently to explain the relationship between the home
food environment and BMI. The dependent variable was children’s BMI z-scores. BMI
was selected as the outcome for weight status because it is a widely accepted and
validated unit of measurement correlated with body fat (Garrow & Webster, 1985; Mei et
al., 2002; U.S. Department of Health and Human Services, 2009a). BMI z-scores
standardized the observed BMIs by indicating how many standard deviations children
were above or below the age and sex specific population mean, which were derived
against the U.S. CDC 2000 reference data (Kuczmarski et al., 2000). This
standardization allows for cross-sectional classification of adiposity for children (Cole,
Faith, Pietrobelli, & Heo, 2005). The independent variables included home food
availability and accessibility. The availability of different food groups in the home
environment was quantifiably measured using four weeks of food store receipt data and
an accompanying food purchase log. These data provided an objective measure of
availability, which many other studies in the literature lacked. The accessibility of food
was measured using a self-report questionnaire. Dietary factors, physical activity,
pubertal status, demographic variables, and external food environment factors were also
measured as covariates of BMI. Theoretically the relationship between the physical
home food environment and BMI should involve dietary intake, but due to the limitations
in measurement of dietary variables (Savage et al., 2008) the direct relationship was
Qualitative methods were embedded in the study to describe the context of the
phenomenon and assess the utility of the Ecological Model in directing research.
Semi-structured interviews were conducted with a sub-sample of children to understand the
potential factors that influence the relationship between the physical home food
environment and BMI. Maximum variation sampling techniques were used to
purposefully select a sample that represented a wide range of BMI z-scores and
socio-demographic characteristics (Patton, 2002). Interviews elicited children’s perspective on
the physical food environment and how they make food choices within the home setting.
A conventional content analysis was conducted to analyze the interview data. The
process that emerged from the analysis helped to explain the relationship between the
physical home food environment and BMI.
Quantitative and qualitative data were collected concurrently and integrated, both in
analysis by exploring the differences in qualitative data by overweight status, and in the
interpretation of the results, by contextually seating the quantitative findings in the
process of children’s food choice. The study deductively explored the direct relationship
between the home food environment and BMI and inductively assessed children’s food
choices to contextualize the quantitative findings and assess the utility of the Ecological
Model. Both quantitative and qualitative data were necessary to provide a
comprehensive and complete understanding of the relationship between the home food
environment and BMI in children.
Overall Objective and Aims
The main purpose of this mixed-methods study was to examine the relationship
within the contextual process of their food choices. The research questions
addressed in this study included: What is the relationship between availability and
accessibility of “lower-energy” and “higher-energy” foods in the home and BMI for
middle school children? Within the context of the home food environment, what other
factors related to eating patterns help to explain BMI?
Specific Aim 1
The first specific aim was to quantitatively determine the direct relationship
between the physical home food environment (availability and accessibility) and BMI
z-scores of middle school children after controlling for non-dietary obesity risk profiles
(cluster analysis of non-dietary covariates), dietary intake (average daily energy and fat
intake), and external food environment factors (frequency of meals at school and
restaurants).
Hypothesis 1. There is an inverse relationship between availability of
“lower-energy” foods (i.e. fruits, vegetables, and low-fat dairy) and BMI z-scores after
controlling for home food accessibility, non-dietary obesity risk profiles, dietary intake,
and external food environment factors.
Hypothesis 2. There is a direct linear relationship between the availability of
“higher-energy” foods (i.e. sweet snacks, savory snacks, and sugar-sweetened beverages)
and BMI z-scores after controlling for home food accessibility, non-dietary obesity risk
profiles, dietary intake, and external food environment factors.
Hypothesis 3. There is an inverse relationship between home accessibility of
“lower-energy” foods and BMI z-scores after controlling for home food availability,
Specific Aim 2
The second specific aim used qualitative methods to describe factors that influence
the relationship between the physical home food environment and BMI as perceived by
middle school children.
Specific Aim 3
The third specific aim was to integrate the quantitative and qualitative findings to
describe the relationship between the home food environment and BMI and to assess the
utility of the Ecological Model in explaining this relationship and directing future
research.
Manuscript Overview
This dissertation is presented in a manuscript format with three separate papers
prepared for publication that highlight discrete components of the research process: the
food receipt and purchase log methodology, the qualitative description of children’s food
choice process in the home, and the mixed methods assessment of the relationship
between the physical home food environment and BMI.
For this dissertation, a food receipt and purchase log protocol was developed to
measure home food availability of “lower-energy” and “higher-energy” food groups to
understand the relationship between their availability and BMI in children. The first
manuscript describes and evaluates the receipt/log methodology for measuring home food
availability. The receipt/log protocol, including data collection, entry, and systematic
coding, is fully presented and then evaluated as an overall research process to determine
both feasibility for participants and utility for researchers. Food receipt and log data are
further determine utility as a research tool. The discussion highlights how this
protocol advanced the method compared to previous receipt/log protocols and other home
food availability measurement methods. The first manuscript presents the
methodological description and assessment needed to confidently assess the relationship
between the physical home food environment and BMI in the final manuscript.
In this dissertation, the qualitative method inductively explored factors that affect
children’s food choices in the home in order to understand both children’s perspective of
the environmental contributions, like availability and accessibility, and the overarching
context of food choice. This allows for a more thorough understanding of the
relationship between the home food environment and BMI. The second manuscript
describes the process of middle school children’s food choice in the home, which
emerged from a content analysis with grounded theory overtones of semi-structured
interview data. The manuscript identifies all the contributing factors and their
interactions that surfaced in the content analysis through the presentation of the model of
children’s food choice process. The manuscript details how children’s food choices at
home resulted from the interaction of the child, parent, food, and outside influences over
time. The utility of the Ecological Model of Health Behavior is also assessed for its
ability to conceptualize food choices and direct future research. Presenting the broader
context of food choice in the home allows for contextual understanding of the
information provided by the combined quantitative and qualitative data that are presented
in the final manuscript.
With the methodological and contextual groundwork provided by the first two
main objective of the dissertation – to examine the relationship between physical
home food environment and BMI of middle school children as seated within the
contextual process of their food choices. The final manuscript describes the home food
environment variables, BMI, and covariates that were quantitatively measured and
reports the findings from the regression analysis that tests the hypotheses. In addition,
the integration of the quantitative and qualitative data is presented in comparing of the
interview data between the overweight and healthy weight children. Lastly, the
discussion further integrates the results and interprets them within the context of
children’s food choice process to explain the findings and suggest future directions for
research.
The results from these three manuscripts are reviewed in a final conclusion that
summarizes the contributions of each manuscript in furthering our understanding of the
relationship between the physical home food environment and BMI of middle school
children. Explanations for the findings that lie outside of the home food environment are
Measuring Home Food Availability:
Evaluation of Food Receipt and Food Purchase Log Collection Methodology Joanna E. Holsten, MPH, MS, RN
University of Pennsylvania, School of Nursing
Dissertation
Chairperson: Charlene W. Compher, PhD, RD, FADA, CNSD, LDN Committee Members: Janet A. Deatrick, PhD, FAAN, RN
Abstract
Objectives: 1) To describe a food receipt and purchase log protocol to measure home food availability; 2) To evaluate the data collection process, receipt seasonality, and utility of the receipt/log method compared to questionnaires. Methods: Home food availability was assessed using: food receipts, food purchase logs, and questionnaires. Sixty-five adolescents and parents were enrolled. Receipt/log data were collected over 30 days and coded into “lower-energy” and “higher-energy” food categories. Descriptive and bivariate analyses were performed. Results: Few families reported missing food receipts with more than three items (5%) and all food receipt items with two exceptions were identifiable. No significant seasonal variations were found. Questionnaire and receipt data were significantly correlated for all food categories with the exception of children’s perceptions of dairy (!=0.06, p=0.650), and parent’s perceptions of sweet snacks (!=0.24, p=0.071) and sugar-sweetened beverages (!=0.21,p=0.118).
Conclusions: The receipt/log method offers a feasible data collection protocol and systematic data-coding scheme to improve measurement of home food availability.
Measuring Home Food Availability:
Evaluation of Food Receipt and Food Purchase Log Collection Methodology Introduction
The home food environment plays a crucial role in children’s diet and health. Several studies have found that home availability of “lower-energy” and “higher-energy” foods are related to intake (Pearson, Biddle, & Gorely, 2009), and intake of these foods correlate with weight status or weight loss (Bradlee, Singer, Qureshi, & Moore, 2009; Epstein, Paluch, Beecher, & Roemmich, 2008). Home food availability refers to the presence of food items in an individual’s residence. In previous research, home food availability has been measured using three main methods: self-report questionnaires, observed home inventories, and household food acquisition data. However, measuring home food availability presents several challenges including variation over time and between different individuals’ perspectives. Documenting all food inputs that come into the home offers a promising approach to measure home food availability using objective data.
Two methods often combined to document household food acquisition are food receipt collection and food purchase logs. Receipt collection involves participants gathering itemized food receipts over a period of time. A food purchase log often accompanies receipt collection to document food purchases without itemized receipts, or clarify purchases on a receipt for non-household use, preventing under and
the data collection process, receipt seasonality, and utility of the receipt/log method compared to questionnaires, and 3) highlight improvements from previous protocols and other methods.
Methods
A food store receipt and log protocol was developed to measure home food availability of “lower-energy” and “higher-energy” food groups to understand the relationship between their availability and body mass index (BMI) in children. Participants were recruited from one public middle school with a student body of 742 located in a Northeastern suburb of the United States. A convenience sample of 65 adolescents and parents was enrolled (8.8% enrollment rate).
Data Collection
Families who consented to participate were given verbal instructions over the phone and sent a packet instructing them to begin collecting all receipts for food items that entered the home and recording items without a receipt (i.e. gift of banana bread) or items on a receipt not intended for the home (i.e. candy for a school party). Each family started receipt collection on different dates from September 2008 to April 2009.
Enrollment was suspended so that no data collection occurred during the winter holiday period. The instruction packet included: a magnetic receipt envelope for the refrigerator, a food purchase log, and written instructions. Each family received two data collection reminder calls. During the second call, home visits were scheduled with families to occur after receipt/log collection.
questioned about possible missing receipts. If the family reported missing receipts, they were asked how many items would have been missing. Questionnaires were administered to the child and parent and the child’s weight and height were measured. One questionnaire assessed how often items in each food group were present in the home with five ordinal response options ranging from ‘hardly ever’ (1) to ‘always’ (5). The reliability and validity of this questionnaire has not been documented, but it had been used in research with children and parents (Gable & Lutz, 2000).
Data Entry
One month of data were entered for each participant, starting two days after consent and continuing 30 days from the start date. All receipt data were scanned and imported into a spreadsheet using the NEAT Receipt software program (Version 3, NEAT Receipts, Philadelphia, PA). Additional items and item clarifications recorded on the food purchase logs were hand entered. Food items were considered single line items on receipts.
Data Coding
Although receipt and log data recorded all possible foods, the coding protocol
selected only food items that met eligibility criteria for one of six groups: fruit,
Fruits, vegetables, and low-fat dairy were considered “lower-energy” food groups that is, relatively high in micronutrients and low in kilocalories. In turn, greater intake of these “lower-energy” foods (relative to “higher-energy” foods) is associated
with lower BMI (Bradlee et al., 2009; Epstein et al., 2008). The United States
Department of Agriculture (USDA) food pyramid classifications of fruits, vegetables, and low-fat dairy items (U.S. Department of Agriculture, 2010) were the starting point for coding these foods. To systematically exclude high-energy versions of fruits, vegetables, and low-fat dairy items, an “energy-density” cutoff was applied. A food’s energy density is “the amount of energy per unit weight” (i.e. kilcalories/100 grams) (World Cancer Research Fund / American Institute for Cancer Research, 2007, p. 324). Fruit, vegetable, or low-fat dairy items with greater than 100 kilocalories per 100 grams were eliminated from the “lower-energy” food groups, excluding strawberry jam, French fries, and cheese, respectively. An expert panel report recommended this approach to categorize foods that do or do not promote excess weight gain (World Cancer Research Fund / American Institute for Cancer Research, 2007).
Sweet snacks, savory snacks, and sugar-sweetened beverages were considered “higher-energy” foods that is, relatively low levels of micronutrients and high levels of
kilocalories. Greater intake of these “higher-energy” foods is associated with higher
versions of sweet and savory snacks (100 kilocalories/100 grams or less), such as gelatin desserts, from the snack food groups.
Sugar sweetened beverages included any non-dairy drink with greater than 10
calories per serving that were not 100% juice. Although most sugar-sweetened beverages
were less than 100 kilocalories/100 grams due to their high water content, all sugar-sweetened beverages were excluded since they are not a part of the USDA recommended intake (U.S. Department of Agriculture, 2010) and are linked with adolescent obesity (Haines, Neumark-Sztainer, Wall, & Story, 2007).
Additional food product information needed for coding (i.e. beverage sugar content) was obtained from food company websites, or if unavailable, the USDA nutrition database. Energy-density information was obtained from the USDA Food and Nutrient Database for Dietary Studies (Version 3, Agricultural Research Service, Food Surveys Research Group, Beltsville, MD).
Data Analysis
The percentages of items in each category out of the total food items were calculated as the final home food availability variables. Descriptive analyses were conducted to describe the participant characteristics, receipt and log collection process, the percentage of items in each category, and the home food availability questionnaire responses. Means and variances were calculated for each continuous variable.
Frequencies and percentages were calculated for categorical variables.
Using the non-parametric Mann-Whitney U Test, the percentages of items in the food categories and demographic variables were compared to see if there was a
did not. In order to identify any seasonal effect on the home food availability data, the families that collected in the fall months (September to November) were compared to those that collected in the winter months (January to March) using a Mann Whitney U Test. Spearman correlations were conducted between the receipt and questionnaire data. P-values less than 0.05 were considered statistically significant.
Evaluation
The receipt and log collection protocol was evaluated to determine feasibility for participants and utility for researchers.
Process Evaluation
Of the 65 participants enrolled, 58 households both remained eligible (2
participants were ineligible at the home visit) and completed receipt/log collection and home visits (92.3% response rate). Only five participants did not complete receipt collection. The mean age of the children was 12.48 years (range 11.1-14.5 years) with
29% overweight (>85th and <95th BMI percentile) and 10% obese (>95th BMI percentile)
(U.S. Department of Health and Human Services, 2009). The majority of children were non-Hispanic and white. The median annual income range was $75,000 to $99,000, and 60% identified a college degree or greater as the highest level of education attained by either parent.
Over a period of 30 days, families collected an average of 9+4.5 food store receipts (range 2-21) with the majority from supermarkets. During data collection, 64% of families used the food purchase log. Of the 37 families that used the log, 68% (n=25)
noted food purchased from a store without a receipt; 43% (n=16) noted food notintended
recorded food from restaurants. In reviewing the receipts with the parents, 35% (n=20) recalled information that should have been recorded on the food purchase log.
Seventy-four percent of families (n=43) reported that they were not missing any receipts. Fifteen families (26%) reported that they could potentially be missing a receipt, but only three of these families reported that they were definitely missing a receipt from a large shopping trip that included more than two items and could not recall them all. The families (n=15) that stated that they might be missing receipts of any size had a
significantly higher percentage of sugar-sweetened beverages (p=0.013) and had
significantly lower parental education levels (p=0.017) than those with complete receipt collection. In comparing families that reported that they were definitely missing at least one receipt from a large shopping trip (n=3), and the rest of the sample, there were no significant differences in the percentages of food items available. They also had significantly lower parental education (p=0.004) and income levels (p=0.021).
In reviewing the data, only two receipts had unreadable items due to water damage. Thirty-two items needed to be clarified with store managers. Only two items could not be coded due to vague labeling (i.e. “manager special”) and the parent’s inability to recall the item.
Seasonality Findings
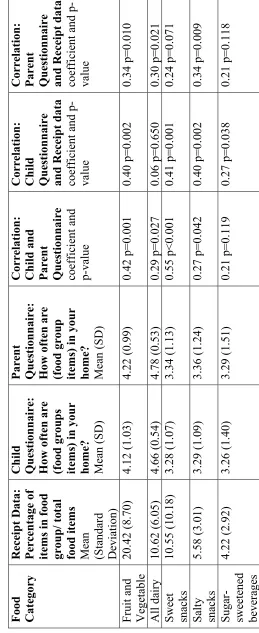
Correlation Between Receipt/Log and Questionnaire Data
In order to compare receipt/log and questionnaire data, alterations were made to the receipt/log food categories to match the questionnaire groupings, including
combining the fruits and vegetables into one category and using all dairy items instead of just the low-fat items. Child and parent questionnaire responses were significantly
correlated for all food groups (!=0.27-0.55) besides sugar-sweetened beverages. Child
questionnaire responses and receipt/log data were significantly correlated for all food categories except dairy (Table 2). Parent questionnaire responses and receipt/log data were significantly correlated for fruits and vegetables, dairy, and savory snacks; however sweet snacks and sugar-sweetened beverages were not significantly associated (Table 2).
Discussion
In light of the method’s description and analysis, following is a comparison of the receipt/log protocol with other receipt protocols and other methods used to measure home food availability.
Comparison with Other Receipt Protocols
seasons is another concern, yet our seasonality analysis corroborates French and colleagues’ (2009) lack of significant differences in purchases based on month of
enrollment. However, the study did not collect data over the spring and summer months when fresh fruits and vegetables are highly available. The types of receipts collected by the participants also differ between protocols. Some studies collected all restaurant receipts, which provided a comprehensive understanding of food purchasing, but did not necessarily represent home food availability.
Protocols also differ in techniques to document purchases without receipts and record details about foods. Several studies trained participants to document additional details directly on the receipts (Rankin et al., 1998; Winett et al., 1997) or make detailed annotations of all purchases (French, Wall, Mitchell, Shimotsu, & Welsh, 2009) during the data collection period. These annotation techniques may produce more accurate results since information is recorded closer to the purchase occasion; although extensive annotation may decrease accuracy by increasing subject burden and awareness of
healthful qualities of food (i.e. percent milk-fat) during the data collection period. While the post-collection review introduces recall and social desirability bias, it may reduce burden and reactivity by limiting the amount that participants need to consciously record during data collection. In addition, annotations recorded directly on the food receipts interfered with the scanning process used to input the receipt data.
reported missing receipts, the purchasing levels were not significantly less for any of the food categories; instead families that reported missing one or more receipts had significantly higher percentages of sugar-sweetened beverages than families missing no receipts, implying underestimation of their availability. Since these families had lower education levels and incomes, researchers might find difficulty attaining complete data collection in populations of different socio-demographic backgrounds.
The level of nutritional analysis and classification of food groups represent the main differences in data coding. Other studies utilized nutritional databases (Rankin et al., 1998; Ransley et al., 2001; Winett et al., 1997) to estimate energy, macronutrient, and fiber in food purchases. While analyzing foods by nutrients may provide more precise research outcomes, analyzing foods by categories produce results that can be applied more readily to individual dietary decisions and allow investigation of the association with intake of food groups. Many protocols lack a consistent strategy for determining classification in particular food groups. This protocol employed “energy density” cutoffs, which advances the method by creating a consistently applied rule in coding decisions, specifically for obesity research.
Comparison with Other Measurement Methods
Self-report questionnaires are widely used to measure home food availability.
However, questionnaires theoretically measure the participants’ perception of availability
(!=0.06) while both child and parent perceptions of all other food categories had much higher correlations (!=0.21-0.40), possibly indicating children’s lower awareness of dairy availability. In addition, the lack of significant correlation for the parent’s reported availability of sweets and sugar-sweetened beverages could indicate parents’ social desirability bias, similar to other research findings (van Assema, Glanz, Martens, & Brug, 2007). While individuals can still withhold receipts, the social pressure may be lessened since it is not directly tied to an individual’s response (French et al., 2009). Although since receipt/log data collection and food acquisition occur concurrently, participants may temporarily alter the pattern of food purchases due to the awareness that they are being observed. Unlike questionnaires, the issue of reactivity limits the
receipt/log method. While there is no gold standard of home food availability
measurement, the receipt/log method offers a grounding to objective data over time rather than potentially conflicting participant perceptions or a cross-sectional self-reported inventory.
Limitations
Implications
By providing a detailed description of data collection and coding, future studies can replicate the protocol and continue to refine it. The protocol appears highly feasible for families with children since few families reported missing receipts for large shopping trips, all items with the exception of two were identifiable following the protocol, and 92% of families initially enrolled completed receipt/log collection. In addition, the 30-day data collection protocol conceptually allowed for daily and weekly variations. The lack of significant variation between seasons adds support for this methodology as a stable measure of home food availability over fall and winter months. Compared to self-report questionnaires, the receipt/log method is grounded in objective data, reducing reliance on self-reported information that is subject to recall and social desirability bias and avoiding conflicting reports between individuals. Although, reactivity or the potential that participants change their food purchasing behaviors due to observation cannot be ruled out as a limitation of the method. Overall, the food receipt and purchase log method offers several advantages over other methods and advances the development of a feasible and systematic protocol to improve measurement of home food availability.
Acknowledgements
References
Bradlee, M. L., Singer, M. R., Qureshi, M. M., & Moore, L. L. (2009). Food group intake and central obesity among children and adolescents in the third National Health and
Nutrition Examination Survey (NHANES III). Public Health Nutrition, 1-9.
Epstein, L. H., Paluch, R. A., Beecher, M. D., & Roemmich, J. N. (2008). Increasing healthy eating vs. reducing high energy-dense foods to treat pediatric obesity.
Obesity, 16(2), 318-326.
French, S. A., Wall, M., Mitchell, N. R., Shimotsu, S. T., & Welsh, E. (2009). Annotated
receipts capture household food purchases from a broad range of sources. The
International Journal of Behavioral Nutrition and Physical Activity, 6(37). Gable, S., & Lutz, S. (2000). Household, parent, and child contributions to childhood
obesity. Family Relations, 49, 293-300.
Haines, J., Neumark-Sztainer, D., Wall, M., & Story, M. (2007). Personal, behavioral,
and environmental risk and protective factors for adolescent overweight. Obesity,
15(11), 2748-2760.
Martin, S. L., Howell, T., Duan, Y., & Walters, M. (2006). The feasibility and utility of
grocery receipt analyses for dietary assessment. Nutrition Journal, 5(10).
Pearson, N., Biddle, S. J., & Gorely, T. (2009). Family correlates of fruit and vegetable
consumption in children and adolescents: A systematic review. Public Health
Rankin, J. W., Winett, R. A., Anderson, E. S., Bickley, P. G., Moore, J. F., Leahy,
M., Harris, C. E., & Gerkin, R. E. (1998). Food purchase patterns at the supermarket
and their relationship to family characteristics. Journal of Nutrition Education,
30(2), 81-88.
Ransley, J. K., Donnelly, J. K., Khara, T. N., Botham, H., Arnot, H., Greenwood, D. C., & Cade, J. E. (2001). The use of supermarket till receipts to determine the fat and
energy intake in a UK population. Public Health Nutrition, 4(6), 1279-1286.
U.S. Department of Agriculture. (2010). MyPyramid. Retrieved April 1, 2010, from
http://www.MyPyramid.gov
U.S. Department of Health and Human Services. (2009). Healthy weight – it’s not a diet,
it’s a lifestyle! About BMI for children and teens. Retrieved April 1, 2010, from http://www.cdc.gov/healthyweight/assessing/bmi/childrens_bmi/about_childrens_b mi.html
van Assema, P., Glanz, K., Martens, M., & Brug, J. (2007). Differences between parents'
and adolescents' perceptions of family food rules and availability. Journal of
Nutrition Education & Behavior, 39(2), 84-89.
Wansink, B., Payne, C. R., & Shimizu, M. (2009). "Is this a meal or snack?" Situational
cues that drive perceptions. Appetite,54(1), 214-216.
Winett, R. A., Anderson, E. S., Bickley, P. G., WalbergRankin, J., Moore, J. F., Leahy, M., Harris, C. E., & Gerkin, R. E. (1997). Nutrition for a lifetime system(c): A multimedia system for altering food supermarket shoppers' purchases to meet
World Cancer Research Fund / American Institute for Cancer Research. (2007).
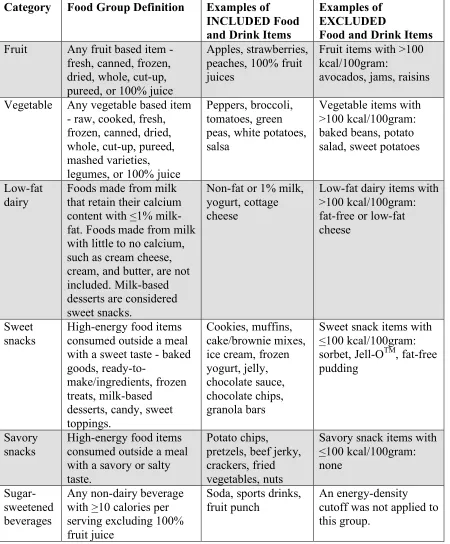
Table 1
Food group category definitions and examples of items included or excluded by the coding rules for each group
Category Food Group Definition Examples of INCLUDED Food and Drink Items
Examples of EXCLUDED
Food and Drink Items
Fruit Any fruit based item -
fresh, canned, frozen, dried, whole, cut-up, pureed, or 100% juice
Apples, strawberries, peaches, 100% fruit juices
Fruit items with >100 kcal/100gram:
avocados, jams, raisins Vegetable Any vegetable based item
- raw, cooked, fresh, frozen, canned, dried, whole, cut-up, pureed, mashed varieties, legumes, or 100% juice
Peppers, broccoli, tomatoes, green peas, white potatoes, salsa
Vegetable items with >100 kcal/100gram: baked beans, potato salad, sweet potatoes
Low-fat dairy
Foods made from milk that retain their calcium content with <1% milk-fat. Foods made from milk with little to no calcium, such as cream cheese, cream, and butter, are not included. Milk-based desserts are considered sweet snacks.
Non-fat or 1% milk, yogurt, cottage cheese
Low-fat dairy items with >100 kcal/100gram: fat-free or low-fat cheese
Sweet snacks
High-energy food items consumed outside a meal with a sweet taste - baked goods,
ready-to-make/ingredients, frozen treats, milk-based desserts, candy, sweet toppings.
Cookies, muffins, cake/brownie mixes, ice cream, frozen yogurt, jelly, chocolate sauce, chocolate chips, granola bars
Sweet snack items with <100 kcal/100gram:
sorbet, Jell-OTM, fat-free
pudding
Savory snacks
High-energy food items consumed outside a meal with a savory or salty taste.
Potato chips, pretzels, beef jerky, crackers, fried vegetables, nuts
Savory snack items with <100 kcal/100gram: none
Sugar-sweetened beverages
Any non-dairy beverage with >10 calories per serving excluding 100% fruit juice
Soda, sports drinks, fruit punch
The Process of Children’s Food Choice in the Home Environment:
A Qualitative Descriptive Study
Joanna E. Holsten, MPH, MS, RN
University of Pennsylvania, School of Nursing
Dissertation
Chairperson: Charlene W. Compher, PhD, RD, FADA, CNSD, LDN
Committee Members: Janet A. Deatrick, PhD, FAAN, RN
Shiriki Kumanyika, PhD, MPH
Abstract
A qualitative descriptive approach was used to inductively describe the process of middle
school children’s food choice in the home with particular attention to environmental
contributions. Semi-structured interviews were conducted with a sub-sample of 11 to 14
year-old children. A data-driven content analysis with grounded theory overtones was
performed. Children’s food choice in the home emerged as a process that involved three
main interacting components, the child, parent, and food, embedded in the context of
time. The parent created food options through food purchasing and preparation and
indirectly affected the child’s food choices by setting rules, providing information, and
modeling behaviors. Pertinent aspects of the food included its availability within the
home, specified attributes, such as flavor and preparation, and cost. The child affected
the parent’s decisions through communicating food preferences. The child evaluated
potential food options based on their hunger level, food preferences, time pressure and
activity prioritization, food preparation effort and skills, and expected physical
consequences of food in order to make their final food choices. Future research should
continue to examine the process of food choice using multiple data collection techniques
and sources, such as participant observation and parent interviews, across many behavior
settings including school.
Keywords:food choice, children, obesity, overweight, body mass index, home, food
The Process of Children’s Food Choice in the Home Environment:
A Qualitative Descriptive Study
Introduction
Prevalence rates of childhood obesity have increased dramatically over three
decades (Ogden, Carroll, Curtin, Lamb, & Flegal, 2010) and children’s dietary patterns
are moving further from recommendations. Nationally, children’s intake of
nutrient-dense foods, such as fruits, vegetables and low-fat dairy has declined (Guenther, Dodd,
Reedy, & Krebs-Smith, 2006; Neilsen, Siega-Riz, & Popkin, 2002), and intake of
energy-dense foods low in nutrients, such as snacks and sugar-sweetened beverages, has
increased (Neilsen et al., 2002; Wang, Bleich, & Gortmaker, 2008). These trends
adversely affect children’s health in communities across the United States. In order to
understand dietary intake and improve children’s diet and health, it is important to
examine the circumstances surrounding children’s food choices.
Since the majority of children’s intake occurs at home (Neilsen et al., 2002) and
many fundamental dietary behaviors are established and reinforced in this setting (Birch
& Davison, 2001), the home is a crucial environment to understand food choice. The
home food environment is particularly complex to investigate due to the effect of other
organizations (Glanz, Sallis, Saelens, & Frank, 2005), such as food stores, and
interpersonal influences of the family. Current models of the home food environment
consist of interactions between built, natural, socio-cultural, political, and economic
domains (Rosenkranz & Dzewaltowski, 2008) broadly directed by an ecological
specific process of food choice in the home setting and delineate the role of potential
environmental factors from children’s perspectives.
Many qualitative studies have explored factors that affect food choice. Focus
groups with children and adolescents found a large number of factors that influence food
choices including: taste, availability of foods at home, hunger, food cravings, health
benefits, time and effort of food preparation and consumption, cost, advertising, parent
support (modeling, cooking, buying, and serving foods), peer support/approval, body
image, and mood (Cullen et al., 2003; McKinley et al., 2005; Molaison, Connell, Stuff,
Yadrick, & Bogle, 2005; Neumark-Sztainer, Story, Perry, & Casey, 1999; Wind,
Bobelijn, De Bourdeaudhuij, Klepp, & Brug, 2005). However, these studies explored
factors that primarily affected fruit and vegetable intake and not the entirety of children’s
diet. The studies were also heavily directed by established health behavior theories,
which may have limited the findings to pre-specified concepts or pathways and
discounted potentially important factors. In addition, many of the studies did not state the
type of qualitative analysis performed on the data, raising credibility concerns.
No studies have explored the factors that affect children’s food choice specifically
in the home setting using a non-directed approach. This qualitative descriptive study
inductively describes the process of middle school children’s food choice in the home
with particular attention to environmental contributions. The inductive data analysis was
then used to assess the utility of the Ecological Model of Health Behavior.
Understandingchild’s perceptions of the home food environment and their food choices
within the environment can help direct future research in identifying potential risk factors
Methods
Approach
A qualitative descriptive approach (Sandelowski, 2000) was used to describe
factors that affect children’s food choices within the home environment. Face-to-face,
semi-structured interviews were conducted with a large sub-sample of children involved
in a concurrent mixed methods study investigating the association between the home food
environment and body mass index (BMI) (Holsten, Compher, Deatrick, & Kumanyika,
2010). The qualitative descriptive approach was selected since it can provide rich
information regarding eating decisions that are grounded in environmental and cultural
contexts (Sullivan-Bolyai, Bova, & Harper, 2005). The study also had grounded theory
overtones in that the analysis emphasized the examination of social interactions, which
led to the description of food choices as an interacting process. The University of
Pennsylvania Institutional Review Board approved the study.
Setting
All participants were recruited from a public middle school with a student body of
approximately 742. The school population was more racial and ethnically diverse than
the state or zip code area of the school (U.S. Census Bureau, 2008). The school was
located in a suburb of a U.S. Northeastern city with nearby recreation opportunities and
ample supermarkets and restaurants. The interviews took place in private locations
within the participants’ homes.
Sampling Methods
The overall study involved a convenience sample of students (n=58) who were
the household under study, above the 5th BMI percentile for age and sex, and lacked
current health conditions or medications that caused significant diet or weight changes.
From the overall study sample, a sub-sample of children was invited to be interviewed.
Only one child refused the interview and two children were excluded based on sampling
criteria after data collection resulting in 47 interviews for analysis. The nature of
qualitative descriptive research prevented the sample size from being determined in
advance. Due to the rapid enrollment process necessary for the concurrent quantitative
aim, researchers were unable to determine saturation in analysis before the majority of
interviews were conducted. As analysis progressed, thematic saturation occurred with
fewer interviews than were collected (n=29), but the remaining interviews confirmed the
findings.
Maximum variation techniques (Patton, 2002) were used to select the
interviewees for analysis to ensure that each informant was as different as possible along
the dimensions of race, ethnicity, household income, and BMI. BMI was selected as a
measure of weight status since it is a widely accepted and validated unit of measurement
correlated with body fat (Garrow & Webster, 1985; Mei et al., 2002; U.S. Department of
Health and Human Services, 2009). Interviews with all overweight and obese children
(>85th BMI percentile), children of most races and ethnicities, and from the lowest and
highest levels of household income and maternal education were selected for coding
based on the heterogeneous sampling technique.
Participants
Of the 47 participants that were interviewed, the average age of the sample was
an equal amount of boys and girls. The majority of parents had a college degree or
greater (28 participants) and were in the $75,000 to $99,999 income bracket (18
participants). The majority of participants were identified by their parents as white (34
participants), followed by black (9 participants), one or more races (3 participants), and
Asian (1 participant). Only three children were identified as Hispanic. Sixteen
participants were considered overweight (>85th and <95th BMI percentile), and only two
participants were considered obese (>95th BMI percentile) (U.S. Department of Health
and Human Services, 2009) based on measured weight and height from the quantitative
data of the overall study.
Semi-Structured Interview Guide
All qualitative interviews were conducted using a semi-structured interview
guide. The interview guide was structured using the funneling technique, which started
with a general question about eating on a typical day and then worked towards gaining
detailed perceptions of influences on food choice in the home environment using a series
of probes. Initial probing questions were open-ended, such as “Can you tell me more
about that?” Additional probing questions asked about different types of influences
including people at home, food storage, food preparation, and food availability. Neither
the questions nor analysis were directed by theory, which is critical in exploring potential
factors that lie outside the bounds of established theory and in verifying the utility of
theories that guide current research. Lastly, a summary question asked the child if there
was any other information that would be important in understanding their food choices.


![Tetra μ3 iodo tetrakis[(tri tert butylphosphine)copper(I)]](data:image/gif;base64,R0lGODlhAQABAIAAAP///wAAACH5BAEAAAAALAAAAAABAAEAAAICRAEAOw==)