*Corresponding author, E-mail: [email protected]
GENETIC DIVERSITY ANALYSIS OF INDIGENOUS MAIZE CULTIVARS
USING RAPD MARKERS
POONAM THAKUR, PUSHPA STEH*, SUNIL KUMAR KHANDELWAL AND S.L. GODAWAT
Department of Molecular Biology & Biotechnology, Rajasthan College of Agriculture, Maharana Pratap University of Agriculture & Technology, Udaipur-313 001, Rajasthan
Received on 16 July, 2007, Revised on 13 Feb., 2008
SUMMARY
PCR-based random amplified polymorphic DNA (RAPD) markers were employed to assess genetic diversity in ten maize cultivars, viz. 4 hybrids and 6 composites. Fourteen out of the fifteen random primers screened revealed polymorphism among the genotypes. Most of the primers revealed single polymorphic band and 92.92 % of the products were polymorphic. Seventy four scorable fragments were obtained with an average of 5.3 bands per primer and the average number of polymorphic bands found to be 5.1. Based on polymorphism 5 RAPD primers OPD-05, OPC-08, OPP-16, OPE-03 and OPF-17 were found to be highly discriminative. Genetic similarity based on jaccard’s similarity coefficient ranged from 0.214 - 0.725, indicating narrow genetic variability among the genotypes based on RAPD markers. The ten cultivars of maize formed two major clusters in the dendrogram. The studies comprising ten maize cultivars showed that association between dendrogram obtained by RAPD marker and kernel colour.
Key words: Genetic relationship, maize, polymorphism, RAPD.
INTRODUCTION
Maize (Zea mays L.) holds a unique position in world agriculture as food, feed and industrial crop. World collection of maize comprise about 12,000 accession that are represented in 256 races, of which about 30 are in the process of extermination (Machado et al. 1998). It is estimated that only 2% of the maize germplasm is utilized in breeding programs and an important fraction cultivated and conserved by small landholders /farmers. Perhaps over last decade PCR technique had led to the development of several novel genetic assays based on selective amplification of DNA. This popularity of PCR is primarily due to its simplicity and high probability of success. The main reason for the success of PCR analysis is the gain of a large number of genetic markers that require small amount of DNA without the
requirement for cloning, sequencing or any other form of the molecular characterization of the genome. RAPD is also one of the PCR based markers.
variation in Indian maize inbreds with RAPD markers. The present study was undertaken with an objective of evaluating the maize cultivars at molecular level by PCR marker (RAPD).
MATERIAL AND METHODS
A set of ten maize cultivars (Table 1) released from different places, viz. Maharana Pratap University of Agriculture and Technology (MPUAT), Udaipur, Punjab Agricultural University (PAU), Ludhiana, Indian Agricultural Research Institute (IARI), New Delhi and Shri Ram Seeds, Hyderabad, were analyzed in this study. Total DNA was extracted from bulked leaves from seedlings germinated on filter paper in the dark at ambient temperature. After a week, the etiolated leaves were harvested, grounded in liquid nitrogen and the DNA was extracted by using CTAB procedure (Doyle and Doyle 1987). DNA sample were quantified in UV
spectrophotometer. RAPD analysis was carried out in a volume of 20µl containing 200µM dNTP mix, 3U Taq polymerase, 1X reaction buffer, 0.5 µM primers and 50ng of template DNA. Amplification was performed in a thermo gradient thermocycler with the following programs: 1 initial denaturation step at 94ºC for 4 min, followed by 45 cycle at 94ºC for 1 min., 35ºC for 1min. and 72ºC for 2min. and a final cycle of 72ºC for 7min. The amplified products were separated by 1.2% agarose gel electrophoresis containing 0.5µg/ml of EtBr. The gels were photographed under UV light and images transferred to a micro computer for further analysis. A 100 bp DNA ruler was included in the gel as standard molecular weight marker.
RESULTS
DNA quantification was carried out by spectrophotometric measurements. The concentration of
Table 1. Brief description of different maize cultivars
Variety Maturing Plant height Yield Seed type Seeds source (Days) (cm) (q/ha)
Malan (C1) 110-120 250 35-40 White, hard Land race
(Local)
Arawali Makka-1 (C2) 80-85 151-173 30-40 White, hard, large, shiny *MPUAT, Udaipur (composite)
Pratap Early Hybrid-1 (C3) 80-85 143-178 35-40 White, bold, shiny *MPUAT, Udaipur (monohybrid)
Pratap Makka-3 (C4) 75-78 170-180 40-45 White, hard, bold, shiny *MPUAT, Udaipur (composite)
Pratap Makka-4 (C5) 75-80 175-180 45-50 White, hard, bold *MPUAT, Udaipur (composite)
Pratap Makka-5 (C6) 85-90 195-205 45-50 White, bold, hard *MPUAT, Udaipur (composite)
Navjot (composite) (C7) 70-75 175-180 40-45 Yellow, hard, bold PAU, Ludhiana
Bio- 9681 (hybrid) (C8) 80-85 180-185 45-50 Yellow, hard, bold, large Shriram Bioseeds, Hydrabad
Bio- 9637 (hybrid) (C9) 75-80 185-190 40-45 Yellow, hard, bold, large Shriram Bioseeds, Hydrabad
PEHM-2 (hybrid) (C10) 80-90 180-185 45-50 Yellow, hard, bold Division of Genetics, IARI
DNA preparation varied from 5.10 µg/µl (Pratap makka-4) to 10.17µg/µl (Navjot). The quality of DNA was determined by calculating the ratio between A260 and A280 which ranges from 1.8-2.1, which is an indicator of moderate good quality of plant DNA and the ratio was almost consistent irrespective of maize cultivars. The good quality of DNA was also supported by appearance of single, compact, sharp band that was not sheared on 0.8% agarose gel electrophoresis corresponded to the high molecular weight DNA compared with standard DNA marker (1Kb) (Henry 1997, Sambrook 1989).
All the ten varieties of maize cultivars were examined for RAPD genetic marker with 14 decamer primers (OPERON). Molecular markers data in conjunction to morphological data could be highly useful in precise differentiation and relatedness among the cultivars. Each RAPD products was assumed to represent a single locus and data were scored as presence for (1) and for its absence (0).
Only those fragments, which consistently amplified were considered for analysis. Electrophoresis pattern of RAPD profile on 1.2 per cent agarose gel is illustrated in Plate 1 with three specific primers. Primer OPD-05 (P3) gave bands in the range of ~ 2000bp to ~ 300 bp with 100 % polymorphism. OPF-17 (P6) had given 4 scorable bands with two polymorphic bands (~ 800 bp & ~ 300 bp) while OPP-16 (P12) gave 5 scorable bands between ~ 1400 bp to ~ 500 bp.
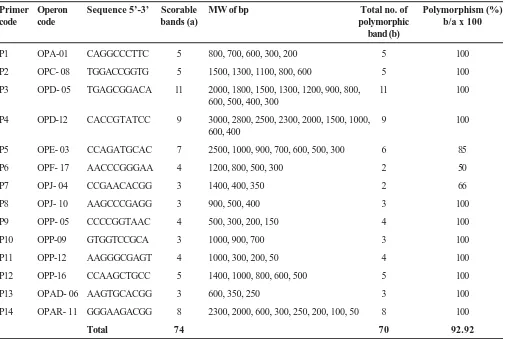
Table 2 shows the total number of amplified products whether polymorphic or monomorphic with all primers. The highest numbers of scorable bands are found in primer OPD-05 which gave 11 scorable bands while the lowest numbers of bands 3 are obtained with primers OPAD-06, OPJ-04, OPJ-10, OPP-09. Seventy four scorable amplified fragments were obtained with 14 primers with an average of 5.3 bands per primer. Seventy bands were found to be polymorphic and the level of polymorphism was 92.92 per cent. The average number of polymorphic bands found to be 5.1 per primer.
Different primers showed variation in their ability to detect polymorphism such as OPC-08 does not amplify with C1 cultivars. Primers OPE-03 gives a unique band with C9 at ~ 2500 bp, ~ 900 bp and it is monomorphic
to all cultivars at ~ 600 bp. Similarly primer OPF-17 has four scorable bands out of which 1200 bp and ~ 500 bp bands shows monomorphism. A ~ 300 bp band is unique in C1 cultivars while ~ 800 bp band is monomorphic to cultivars C1, C2, C3, C4, C5, C6 and C7 while it is absent in C8, C9 and C10. OPP-16 primer is an informative primer with 100% polymorphism. It has 5 scorable bands, ~ 800 bp is unique to variety C8. ~ 1400 bp band is monomorphic to C1, C2, C3, C4, C6 and C10, but it is absent in C5, C7, C8 and C9. Similarily ~ 600bp band is absent in C2 and C3 while present in rest cultivars. A ~ 500bp band is present in C7, C8, C9 and C10 while it is absent in C1, C2, C3, C4, C5 and C6. The results clearly indicate that OPD-05 (P3) proved to be the best primer in our investigation with total 45 fragments and 11 highest numbers of scorable bands as well as 100 per cent
polymorphism. Other primers OPD-12 (P4), OPE-03 (P5), OPF-17 (P6) and OPP-16 (P12) gaves 32, 32, 28 and 28 fragments respectively and gaves 100, 85, 75, 50 and 100 per cent polymorphism.
Primer OPA-01 (P1) is a very informative primer that divides the 10 maize cultivars in two cluster. The cluster I which includes C1, C2, C3, C4 and C5 does not show any band while cluster II (C6, C7, C8, C9, C10) showed the amplified products. Similarly OPP-09 showed bands with cultivars C8, C9 and C10, which indicates their similarity between these cultivar as well as these two primer are suitable in distinguishing the cultivar released from MPUAT to other cultivars used in the present research. Although C6 is released from MPUAT but showing similarity coefficient of 0.46 with cluster II.
DISCUSSION
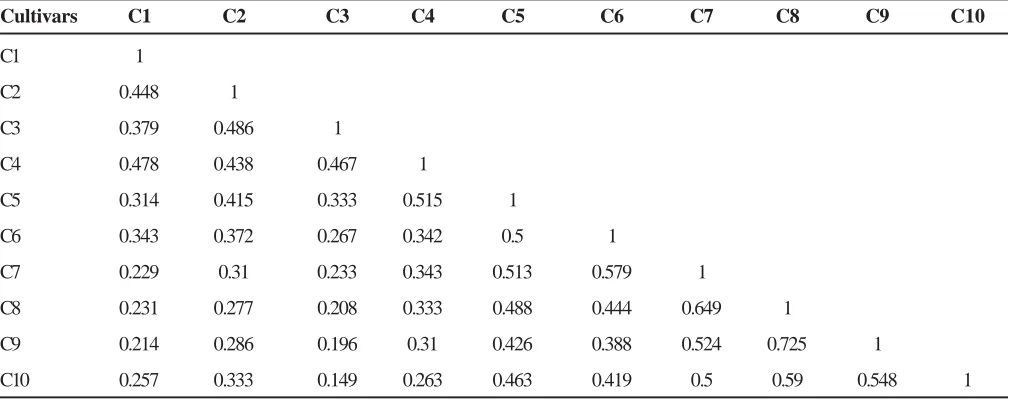
The RAPD data were used to obtain a similarity matrix (Table 3). The similarity coefficient lies in the range of 0.214 to 0.725. The dendrogram (Fig. 1) clearly indicated two main clusters. The cluster I include C1, C2, C3, C4 and C5, where except C1 all are released from MPUAT, Udaipur. The cluster I have two sub-clusters C2 - C3, C4 - C5. In cluster 1 sub cluster C2 and C3 are related to each other at 0.48 similarity coefficient. Their resemblance may be due to the fact that C2 and C3 are derived from the same pool, i.e. X2W. C4 and C5 have similarity coefficient of 0.53 because the base material for the development of these composite is from national pool-2 (early white). C3 also belongs to same pool because it has two parents hybrid derived by crossing EI-116 x EI-364, both of its parent
Table 2. Polymorphism information of RAPD primers analyzed
Primer Operon Sequence 5’-3’ Scorable MW of bp Total no. of Polymorphism (%)
code code bands (a) polymorphic b/a x 100
band (b)
P1 OPA-01 CAGGCCCTTC 5 800, 700, 600, 300, 200 5 100
P2 OPC- 08 TGGACCGGTG 5 1500, 1300, 1100, 800, 600 5 100
P3 OPD- 05 TGAGCGGACA 11 2000, 1800, 1500, 1300, 1200, 900, 800, 11 100
600, 500, 400, 300
P4 OPD-12 CACCGTATCC 9 3000, 2800, 2500, 2300, 2000, 1500, 1000, 9 100
600, 400
P5 OPE- 03 CCAGATGCAC 7 2500, 1000, 900, 700, 600, 500, 300 6 85
P6 OPF- 17 AACCCGGGAA 4 1200, 800, 500, 300 2 50
P7 OPJ- 04 CCGAACACGG 3 1400, 400, 350 2 66
P8 OPJ- 10 AAGCCCGAGG 3 900, 500, 400 3 100
P9 OPP- 05 CCCCGGTAAC 4 500, 300, 200, 150 4 100
P10 OPP-09 GTGGTCCGCA 3 1000, 900, 700 3 100
P11 OPP-12 AAGGGCGAGT 4 1000, 300, 200, 50 4 100
P12 OPP-16 CCAAGCTGCC 5 1400, 1000, 800, 600, 500 5 100
P13 OPAD- 06 AAGTGCACGG 3 600, 350, 250 3 100
P14 OPAR- 11 GGGAAGACGG 8 2300, 2000, 600, 300, 250, 200, 100, 50 8 100
Table 3. Genetic relationship among the cultivars similarity coefficient
Cultivars C1 C2 C3 C4 C5 C6 C7 C8 C9 C10
C1 1
C2 0.448 1
C3 0.379 0.486 1
C4 0.478 0.438 0.467 1
C5 0.314 0.415 0.333 0.515 1
C6 0.343 0.372 0.267 0.342 0.5 1
C7 0.229 0.31 0.233 0.343 0.513 0.579 1
C8 0.231 0.277 0.208 0.333 0.488 0.444 0.649 1
C9 0.214 0.286 0.196 0.31 0.426 0.388 0.524 0.725 1
C10 0.257 0.333 0.149 0.263 0.463 0.419 0.5 0.59 0.548 1
are also derived from X2W pool. Morphologically C4 and C5 are also very much similar. The similarity coefficient between sub cluster C2-C3, C4-C5 with malan which is a local landrace is 0.42. The reason may be due to malan is a local land race of mewar belt and possess altogether different plant behavior like plant height, maturity time therefore, it reveals altogether dissimilarity. The second major cluster including C6, C7, C8, C9 and C10. Dendrogram showing similarity coefficient 0.72 between C8 and C9. Both are hybrid and released from private
sector their similarity may be due to resemblance in the parental line (inbreds). Looking to the morphological similarity both are having yellow and hard seed with approximate similar plant height, yield potential and maturity time (Carvolho et al., 2004). C7 is showing resemblance with C8-C9 having similarity coefficient (0.58). They may have blood common with C8-C9. Cultivar C10 is a single crop hybrid and their parent may be related to [(C8-C9)-C7]. Morphologically it is also showing similarity and the similarity coefficient is 0.54. These facts explain the separation of yellow and white endosperm maize cultivars into two clusters by RAPD (Doebley et al. 1988). While C6 had white colour endosperm but its other morphological characteristic are more related to cluster II containing yellow endosperm. From the Table 2 it is clear that major grouping is based on grain colour and is correlated with RAPD grouping. Classification is based on other morphological/ phenological data do not correlate with RAPD.
Hence study comprising ten maize cultivars showed that there was an association between the dendrogram obtained by RAPD markers and morphological characteristics and their known pedigree (Yu and Pauls 1993, Kongkiatngan et al. 1996, Parentoni et al. 2001). Nevertheless, its could be concluded that RAPD profile were more efficient in detecting polymorphism and distinguishing cultivars.
Fig. 1. Dendrogram generated for ten maize cultivars using UPGMA cluster analysis based on Jaccard similarity coefficient for RAPD data
C1 C2 C3 C4 C5 C6 C7 C8 C9 C10
0.32 0.42 0.52 0.62 0.72
REFERENCES
Carvalho, P.V., Raus, C.F., Ferreira, J.M., Rosangela, M.P.N. and Raus, P.M. (2004). Genetic diversity among maize (Zea mays L.) landraces assessed by RAPD markers.
Genet. Mol. Biol.27: 228-236.
Doebley, J.F.,Wendel, J.D., Smith, J.S.C., Stubes, C.W. and Goodman, M.M. (1988). The origin of cornbelt maize:The isozymes evidence. Econ. Bot. 42: 120-131.
Dos, S.J.B., Nienhuies, J., Skroch, P., Tivang, J. and Slocum, M.K. (1994). Comparison of RAPD and RFLP. Genetic Markers in determining genetic similarity among
Brassica oleracea L. Genotypes. Theo. Appl. Genet. 87:
909-915.
Doyle, J.J. and Doyle, J.L. (1987). A rapid DNA isolation procedure for small quanties of fresh leaf tissue.
Phytochem. Bull. 19: 11-15.
Ferreira, M.E. and Grattapaglia, B. (1986). Introducao ao uso de marcadores moleculares em analise genetica. (2nd
edition). EMBRAPA-CENARGEN, Brasilia.
Henry, R.J. (1997). Practical Applications of Plant Molecular Biology. Capman & Hall, London.
Jones, P.P. and Sutton, J.M. (1997). Plant Molecular Biology Essential Techniques. John Wiley & Sons, New York.
Kongkiatngam, P., Waterway, M.J., Coulman, B.E. and Fortin, M.G. (1996) Genetic variation among cultivars of red clover (Trifolium pretence L.) detected by RAPD marker amplified from bulk genomic DNA. Euphytica89: 355-361.
Lanza, L.L.B., De, S.J.C.L., Ottoboni, L.M.M., Vieira, L.M.C. and De, S.A.P. (1997). Genetic distance of inbred lines
and prediction of maize single cross performance using RAPD marker. Theor. Appl. Genet.94: 1023-1030.
Machado, A.T., Pereira, M.B., Pereira, M.E., Machado, C.T.T. and Medice, L.E. (1998). Avaliacao de variedades locais melhoradas de milho em diferentes regioes do Brasil. In: A.C., Soares, A.T., Machado, B.M. Silva, and J.M. von der Weid (eds.), Milho Crioulo, Conservacao E USO da Biodiversidade, pp. 93-106. AS-Pta, Rio de Janeiro.
Marsan, P.A., Egidy, G., Monfredini, G., Disilvestro, S. and Motto, M. (1993). RAPD markers in maize genetic analysis. Maydica 38: 259-264.
Mauria, S., Singh, N.N., Bhat, K.V. and Lakhanpaul, S. (2002). Assessment of genetic variation in Indian maize inbreds using RAPD markers. J. Genet. Breed.56: 15-19.
Moeller, D.A. and Schaal, B.A. (1999). Genetics relationships among American maize accessions of the great plains assessed by RAPDs. Theor. Appl. Genet. 99: 1061-1067.
Parentoni, S.N., Magalhaes, J.V., Pacheco, C.A.P., Santos, M.X., Abadie, T., Gama, E., Guimaraes, P., Meirelles, W.F., Lopes, M.A., Vasconcelos, M. and Paiva, E. (2001). Heterotic groups based on yield-specific combining ability data and phylogenetic relationship determined by RAPD markers for 28 tropical maize open pollinated varieties. Euphytica 121:197-208.
Sambrook, J., Fritsch, E.F. and Maniatis, T. (1989). Molecular cloning. A laboratory manual, (2nd ed.). CSH Laboratory
Press, Cold Spring Harbor, New York.