R E S E A R C H A R T I C L E
Open Access
Marginal structural models for the estimation of
the risk of Diabetes Mellitus in the presence of
elevated depressive symptoms and antidepressant
medication use in the Women
’
s Health Initiative
observational and clinical trial cohorts
Christine Frisard
1*, Xiangdong Gu
2, Brian Whitcomb
2, Yunsheng Ma
1, Penelope Pekow
2, Martha Zorn
2,
Deidre Sepavich
1and Raji Balasubramanian
2Abstract
Background:We evaluate the combined effect of the presence of elevated depressive symptoms and antidepressant medication use with respect to risk of type 2 diabetes among approximately 120,000 women enrolled in the Women’s Health Initiative (WHI), and compare several different statistical models appropriate for causal inference in non-randomized settings.
Methods:Data were analyzed for 52,326 women in the Women’s Health Initiative Clinical Trials (CT) Cohort and 68,169 women in the Observational Study (OS) Cohort after exclusions. We included follow-up to 2005, resulting in a median duration of 7.6 years of follow up after enrollment. Results from three multivariable Cox models were compared to those from marginal structural models that included time varying measures of antidepressant medication use,
presence of elevated depressive symptoms and BMI, while adjusting for potential confounders including age, ethnicity, education, minutes of recreational physical activity per week, total energy intake, hormone therapy use, family history of diabetes and smoking status.
Results:Our results are consistent with previous studies examining the relationship of antidepressant medication use and risk of type 2 diabetes. All models showed a significant increase in diabetes risk for those taking antidepressants. The Cox Proportional Hazards models using baseline covariates showed the lowest increase in risk , with hazard ratios of 1.19 (95 % CI 1.06–1.35) and 1.14 (95 % CI 1.01–1.30) in the OS and CT, respectively. Hazard ratios from marginal structural models comparing antidepressant users to non-users were 1.35 (95 % CI 1.21–1.51) and 1.27 (95 % CI 1.13– 1.43) in the WHI OS and CT, respectively–however, differences among estimates from traditional Cox models and marginal structural models were not statistically significant in both cohorts. One explanation suggests that time-dependent confounding was not a substantial factor in these data, however other explanations exist. Unadjusted Cox Proportional Hazards models showed that women with elevated depressive symptoms had a significant increase in diabetes risk that remained after adjustment for confounders. However, this association missed the threshold for statistical significance in propensity score adjusted and marginal structural models.
(Continued on next page)
* Correspondence:[email protected]
1Division of Preventive and Behavioral Medicine, Department of Medicine,
University of Massachusetts Medical School, 55 Lake Avenue North, Worcester, MA 01655, USA
Full list of author information is available at the end of the article
(Continued from previous page)
Conclusions:Results from the multiple approaches provide further evidence of an increase in risk of type 2 diabetes for those on antidepressants.
Keywords:Antidepressant medication, Depression, Type 2 diabetes, Marginal structural models, Propensity score
Background
Diabetes is a chronic illness with serious health conse-quences, such as adult blindness, non-traumatic limb amputation, renal failure and neuropathy. Previous lit-erature has noted considerable diabetes and depression among postmenopausal women, with a prevalence rate that is approximately 12 % for each [1, 2]. Recent lit-erature also suggests an increased risk of diabetes among those who are depressed and on antidepres-sant medications [3 –6 ]. It is increasingly important to further investigate whether depression or anti-depressant medication is influencing this association given that approximately 11 % of American women take antidepressant medication, and use is rising [7]. While the rates of use for depression treatment has remained the same, off-label use of antidepressants has increased significantly [8]. Examples of off-label use include treatment for certain types of pain, fibro-myalgia, insomnia, and general unhappiness. In this analysis, we compare four statistical approaches to evaluate the combined effect of the presence of ele-vated depressive symptoms and antidepressant medica-tion use on incident type 2 diabetes using data on approximately 120,000 women in the Women’s Health Initiative (WHI).
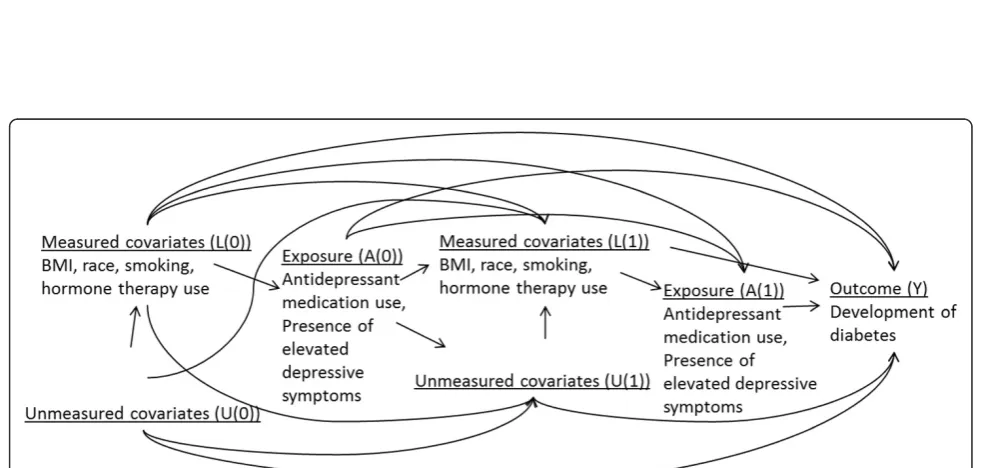
The WHI is a longitudinal study including repeated measurements for presence of elevated depressive symp-toms, antidepressant use and self-reported diagnosis of type 2 diabetes. A previously reported analysis in the WHI [9] found that elevated depressive symptoms and antidepressant medication use resulted in increased type 2 diabetes risk. This analysis was based on Cox models that are subject to bias in the presence of time-dependent confounding [10–12]. A probable mechanism that gives rise to time-dependent confounding in this context is shown in Fig. 2 (Appendix) - participants with increased BMI could be more likely to be depressed and/or on antidepressants in the future [13]. Moreover, BMI and depression/antidepressant medication use can also significantly influence future diabetes risk. Thus, an analysis based on Cox models as in the previous literature [9] to evaluate the causal relationship be-tween presence of elevated depressive symptoms/anti-depressant use (exposure) and diabetes risk (outcome) could result in biased estimates by misattributing the effects of time-dependent confounders to the expo-sures of interest.
In the presence of time-dependent confounding, all Cox models including those that incorporate time-varying covariates are subject to bias [10–12]. Marginal structural models (MSMs) overcome limitations of Cox models - MSMs use inverse probability of treatment/ exposure weighting and, given assumptions, can yield consistent and unbiased causal estimates of the effect of exposure [10–12]. Other methods in this setting in-clude propensity score adjusted models in which the probability of treatment assignment conditional on baseline covariates (or propensity score) is adjusted for as an additional covariate.
The objective of this work was to estimate the com-bined effect of antidepressant medication use/presence of elevated depressive symptoms on type 2 diabetes in the WHI, and to compare results obtained from MSMs and propensity score adjusted Cox models to more traditional approaches such Cox models [9, 14, 15]. The results presented in this paper go beyond a previ-ously reported analysis of this hypothesis in the WHI [9] by comparing results from four different statistical approaches including MSMs that are recommended for causal inference in observational studies.
Methods
Women’s health initiative (WHI)
The WHI enrolled 68,132 participants into clinical trials (WHI-CT) and 93,676 participants into an observational study (WHI-OS) between 1993 and 1998 [16–19]. Eligibil-ity criteria included: postmenopausal women aged 50 to 79 years, reliable/mentally competent, and expected sur-vival and local residency for at least three years. Medica-tion use, presence of elevated depressive symptoms, and diabetes status were collected from participants over an average of 7.6 years of follow-up. We analyzed data with follow-up to 2005.
Study variables Incident diabetes
Antidepressant medication use
WHI-CT participants were instructed to bring all current prescription and nonprescription medications in ori-ginal containers to clinic visits at baseline and years 1, 3, 6, and 9. WHI-OS medication data were col-lected at baseline and year 3. The Master Drug Data Base (MDDB: Medi-Span, Indianapolis, IN) was used to categorize the medications. Based on the MDDB classifi-cation, a binary indicator for antidepressant medication use was created. Antidepressants include the following major groups: 1) Selective serotonin reuptake inhibi-tors; 2) Monoamine oxidase inhibiinhibi-tors; 3) Tricyclic antidepressants; 4) Tetracyclics; 5) Serotonin/norepin-ephrine reuptake inhibitors (SNRIs); 6) Aminoketones; 7) Triazolopyridines; and 8) Dibenzoxazepine. A di-chotomous indicator of antidepressant medication use was then created for each measurement period [9]. Due to sample size limitations, we did not perform analyses by class of medication.
Elevated depressive symptoms
Elevated depressive symptoms were measured using the 6-item Center for Epidemiological Studies Depression Scale (CES-D) [21]. A participant was determined to have elevated depressive symptoms if their score was 5 or higher on the CES-D. Presence of elevated depressive symptoms was available at baseline and year 3 in the WHI-OS and at baseline, year 1, and close out in the WHI-CT. Only 6 % of participants were assessed at years 3, 6, and 9. Due to high levels of missing values at year 1 and later, analysis in the CT cohort adjusted only for baseline presence of elevated depressive symptoms.
BMI
BMI was available at baseline and year 3 in the WHI-OS and at baseline, years 1, 3, 6 and 9 in the WHI-CT.
Other covariates
Other variables available at baseline for inclusion in multi-variable models include: age, race/ethnicity (American Indian/Alaskan Native; Asian or Pacific Islander; Black/ African American; Hispanic/Latino; White; Other), educa-tion (<=high school; high school or GED; > = high school, but less than 4 years of college; 4 or more years of college), minutes of recreational physical activity per week, total energy intake, hormone therapy use (never, former, current), family history of diabetes (no, yes, don’t know) and smoking status (never smoked, past smoker, current smoker).
Statistical analysis Analysis datasets
WHI OS: included 68,169 women after exclusions for self-reported diagnosis of diabetes at baseline or missing
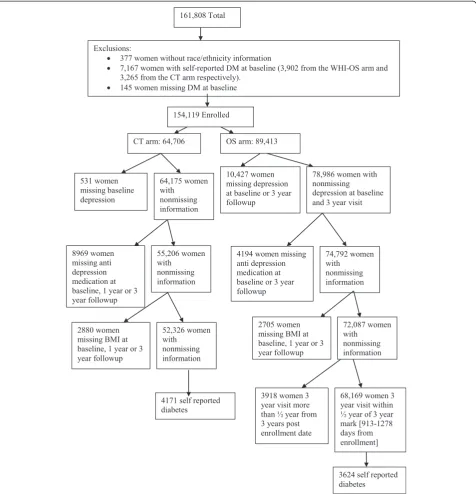
data on one or more of the following: baseline diabetes status, race/ethnicity, presence of elevated depressive symptoms, antidepressant medication use, BMI or women for whom the Year 3 visit occurred more than 3.5 years post enrollment (Fig. 1). 3624 (5.3 %) women reported diagnosis of type 2 diabetes during follow-up. Antidepressant use, BMI, presence of elevated depressive symptoms was available at baseline and year 3 and in-cluded in analyses.
WHI CT: included 52,326 women after the following exclusions - women with a self-reported diagnosis of diabetes at baseline or missing data on one or more of the following: diabetes status at baseline, race/ethni-city, baseline presence of elevated depressive symp-toms, antidepressant medication use, BMI (Fig. 1). 4171 (8.0 %) women reported diagnosis of type 2 dia-betes during follow-up. Antidepressant use and BMI were recorded at baseline, year 1 and year 3. Models adjusted for presence of elevated depressive symptoms at baseline because presence of elevated depressive symptoms was only measured on a small percentage (6.26 %) of women after year 1.
Statistical models
We compared results from four approaches for estimating the association between the presence of elevated depres-sive symptoms/antidepressant medication use with inci-dent type 2 diabetes, in the WHI-OS and WHI-CT datasets separately. Results reported by Ma and colleagues [9] were based on multivariable Cox models as in Approach 1 and Approach 2 described below. The results from these models were compared to propensity score ad-justed models (Approach 3) and MSMs (Approach 4) [22–25]. The interaction of elevated depressive symptoms and antidepressant medication use was investigated in all models, but all interactions were insignificant (p > 0.26 in WHI-OS, p > 0.06 in WHI-CT).
Approach 1is a Cox proportional hazards (PH) model including the following covariates at baseline: elevated de-pressive symptoms, antidepressant use, BMI, age, ethni-city, education, minutes of recreational physical activity per week, total energy intake, hormone therapy use, family history of diabetes and smoking status.
Approach 2is a Cox model with time-varying values of elevated depressive symptoms (WHI-OS only), anti-depressant medication use and BMI, and baseline values of age, ethnicity, education, minutes of recre-ational physical activity per week, total energy intake, hormone therapy use, family history of diabetes and smoking status.
model. Predictors included in the model were baseline measures of BMI, age, ethnicity, education, minutes of recreational physical activity per week, total energy in-take, hormone therapy use, family history of diabetes and smoking status.
Approach 4 is a MSM for a time to event outcome [10]. Two separate logistic regression models were fit to calculate the probability of being on antidepressants and the probability of censoring (not observing the outcome
by that point in time). The models incorporated time-varying data on the presence of elevated depressive symptoms and BMI while adjusting for baseline values of age, ethnicity, education, minutes of recreational physical activity per week, total energy intake, hormone therapy use, family history of diabetes and smoking sta-tus. These models were used to determine the stabilized Inverse Probability of Treatment (IPTW) weights. In the WHI-CT analysis, models were also adjusted for clinical
site. To relax the linearity assumption, we added a quad-ratic function of time to the model. Model details and associated SAS code are included in the Appendix.
Results
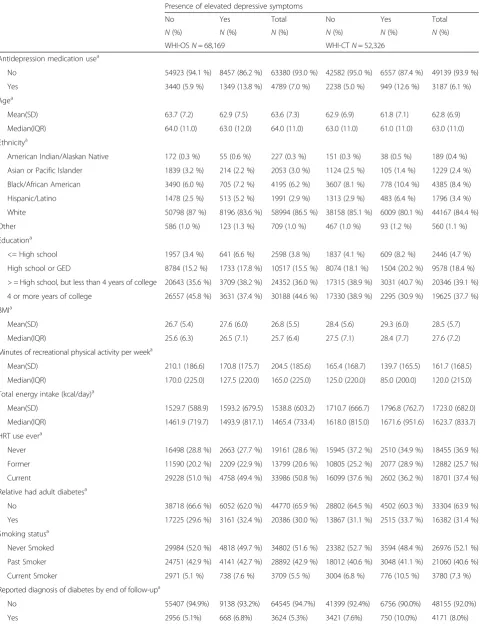
Table 1 presents baseline characteristics of our study population, by antidepressant medication use. Baseline characteristics by presence of elevated depressive symp-toms are shown in Table 4 (Appendix). In both cohorts, the mean age was approximately 63 years old (63.6 (OS); 62.8 (CT)). Women were primarily White (86.5 % (OS); 84.4 % (CT)) and most had greater than high school education (80 % (OS); 76.4 % (CT)). Approximately 30 % of women on antidepressants had elevated depressive symptoms (28.2 % (OS); 29.8 % (CT)). A greater percent-age of antidepressant medication users than non-users reported current use of hormone replacement therapy (64.9 % vs. 49.7 % (OS); 53.6 % vs. 36.3 % (CT)). Anti-depressant users and non-users had approximately equal proportions that reported a family history of diabetes (30 % vs. 30.6 % (OS); 31.4 % vs. 31.6 % (CT)) or current smoking (7.2 % vs. 5.4 % (OS); 9.0 % vs. 7.2 % (CT)). Mean BMI was similar for those on antidepressants vs. not (27.91 vs. 26.70 (OS); 29.41 vs. 28.48 (CT)).
OS cohort
Elevated depressive symptoms
An unadjusted model including only baseline values of antidepressant medication use and presence of elevated depressive symptoms showed a significant increase in diabetes risk for those with elevated depressive symp-toms (HR 1.34; 95 % CI: 1.23-1.45). Approaches 1 and 2 that adjust for other confounders also resulted in a sta-tistically significant association between the presence of elevated depressive symptoms and increased risk of dia-betes–however, this association did not remain statisti-cally significant in propensity score adjusted models and MSMs.
Antidepressant medication use
All models showed a consistent, statistically significant increase in diabetes risk for those exposed to antidepres-sant medications vs. those who were not (Table 2). Ap-proach 1 using baseline measures only yielded a HR of 1.19 (95 % CI 1.06–1.35). Approach 2 and Approach 3 using time-varying antidepressant medication use, pres-ence of elevated depressive symptoms and BMI, yielded almost identical results for antidepressant medication use [Approach 2: 1.31 (95 % CI 1.18 –1.46); Approach 3: 1.32 (95 % CI 1.19–1.47)]. There were no significant differences in the HRs estimated for the presence of ele-vated depressive symptoms between Approaches 2 and 3. The results from MSMs (Approach 4) were almost identical to Approaches 2 and 3 –the HR (CI) for
antidepressant medication use was 1.35 (95 % CI 1.21 – 1.51). In this application, the MSM approach yielded simi-lar results to the traditional extended Cox model.
CT cohort
Elevated depressive symptoms
As in the WHI-OS, the unadjusted model showed a sig-nificant increase in diabetes risk for those with elevated depressive symptoms. While this association was statisti-cally significant in Approaches 1 and 2, it did not remain so in the propensity score adjusted model (Approach 3) and the MSM (Approach 4).
Antidepressant medication use
As in the WHI OS, all models in the WHI-CT showed a consistent, statistically significant increase in diabetes risk for those exposed to antidepressant medications vs. those who were not.
Table 3 presents an estimate of variation in antidepres-sant medication use and presence of elevated depressive symptoms at baseline and year 3, by cohort. In the WHI-OS, 4.9 % of women were using antidepressant medication at both time-points, whereas 88.5 % never used them. 2.2 % of women who were using antidepres-sant medication at baseline had stopped by year 3, and 4.5 % who were not using antidepressant medication at baseline had started by year 3. 6.4 % experienced ele-vated depressive symptoms at both baseline and year 3, while 76.3 % never did. 8 % of women who experienced elevated depressive symptoms at baseline did not report experiencing those symptoms at year 3, and 9.3 % with-out elevated depressive symptoms at baseline did experi-ence them by year 3. Similar patterns were observed in the WHI-CT.
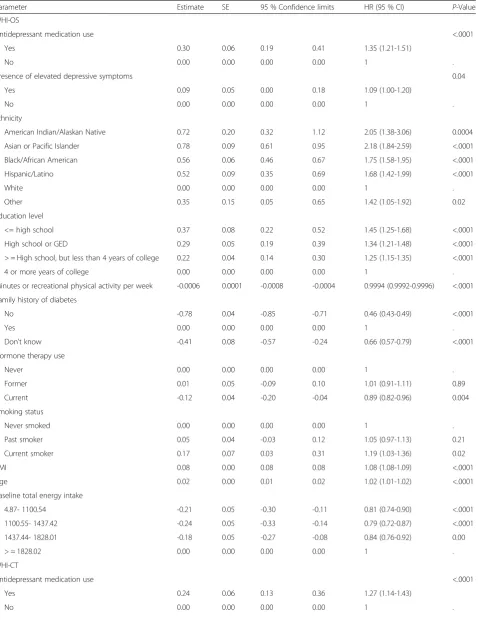
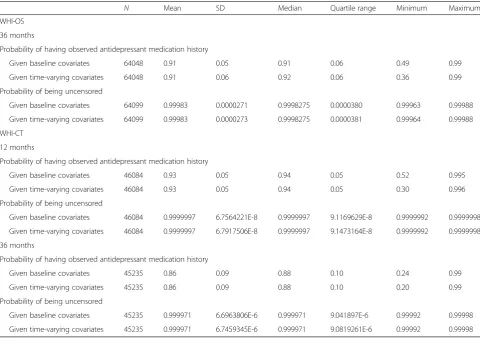
Table 5 (Appendix) presents the HRs and 95 % CIs for all covariates in the MSMs, in the WHI-OS and CT co-horts. Table 6 (Appendix) presents the distributions of the IPTW weights, including the estimated probability of hav-ing one’s own observed treatment history and censoring history at follow-up time points. The probability of remaining uncensored was close to 1 for both cohorts at each follow-up time point given both the baseline and time-varying covariates. There was variation in the prob-ability of having one’s own observed treatment history, but the mean and median were close to 1 at 36 month follow-up in the WHI-OS and 12 and 36 month follow-up in the WHI-CT.
Discussion
Table 1Baseline characteristics of study participants in the Women’s Health Initiative (N = 120,495) Antidepressant medication use
No Yes Total No Yes Total
N(%) N(%) N(%) N (%) N(%) N(%)
WHI-OS N = 68,169 WHI-CT N = 52,326
Baseline presence of elevated depressive symptomsa
No 54923 (86.7 %) 3440 (71.8 %) 58363 (85.6 %) 42582 (86.7 %) 2238 (70.2 %) 44820 (85.7 %)
Yes 8457 (13.3 %) 1349 (28.2 %) 9806 (14.4 %) 6557 (13.3 %) 949 (29.8 %) 7506 (14.3 %)
Agea
Mean (SD) 63.7 (7.3) 62.1 (7.3) 63.6 (7.3) 62.8 (6.9) 61.77 (6.9) 62.8 (6.9)
Median (IQR) 64.0 (11.0) 62.0 (12.0) 64.0 (11.0) 63.0 (11.0) 61.0 (11.0) 63.0 (11.0)
Ethnicitya
American Indian/Alaskan Native 208 (0.3 %) 19 (0.4 %) 227 (0.3 %) 181 (0.4 %) 8 (0.3 %) 189 (0.4 %)
Asian or Pacific Islander 2009 (3.2 %) 44 (0.9 %) 2053 (3.0 %) 1207 (2.5 %) 22 (0.7 %) 1229 (2.4 %)
Black/African American 4037 (6.4 %) 158 (3.3 %) 4195 (6.2 %) 4266 (8.7 %) 119 (3.7 %) 4385 (8.4 %)
Hispanic/Latino 1845 (2.9 %) 146 (3.1 %) 1991 (2.9 %) 1711 (3.5 %) 85 (2.7 %) 1796 (3.4 %)
White 54614 (86.2 %) 4380 (91.5 %) 58994 (86.5 %) 41243 (83.9 %) 2924 (91.8 %) 44167 (84.4 %)
Other 667 (1.1 %) 42 (0.9 %) 709 (1.0 %) 531 (1.1 %) 29 (0.9 %) 560 (1.1 %)
Education
<= High school 2409 (3.8 %) 189 (4 %) 2598 (3.8 %) 2302 (4.7 %) 144 (4.5 %) 2446 (4.7 %)
High school or GED 9765 (15.5 %) 752 (15.9 %) 10517 (15.5 %) 8991 (18.4 %) 587 (18.5 %) 9578 (18.4 %)
> = High school, but less than 4 years of college 22587 (35.9 %) 1765 (37.2 %) 24352 (36.0 %) 19110 (39.1 %) 1236 (39.0 %) 20346 (39.1 %)
4 or more years of college 28152 (44.7 %) 2036 (42.9 %) 30188 (44.6 %) 18426 (37.7 %) 1199 (37.9 %) 19625 (37.7 %)
BMIa
Mean (SD) 26.7 (5.5) 27.9 (6.0) 26.8 (5.5) 28.5 (5.6) 29.4 (6.0) 28.5 (5.7)
Median (IQR) 25.6 (6.3) 26.7 (7.2) 25.7 (6.4) 27.6 (7.2) 28.4 (8.0) 27.6 (7.2)
Minutes of recreational physical activity per weeka
Mean (SD) 206.9 (186.2) 172.1 (174.8) 204.5 (185.6) 163.2 (169.0) 138.9 (159.2) 161.7 (168.5)
Median (IQR) 165.0 (225.0) 135.0 (212.5) 165.0 (225.0) 125.0 (215.0) 85.0 (195.0) 120.0 (215.0)
Total energy intake (kcal/day)a
Mean (SD) 1533.1 (599.9) 1615.1 (640.4) 1538.8 (603.2) 1716.7 (679.5) 1819.7 (711.9) 1723.0 (682.0)
Median (IQR) 1461.3 (730.1) 1533.2 (765.8) 1465.4 (733.4) 1618.3 (832.5) 1716.3 (870.8) 1623.7 (833.7)
Hormone replacement therapy usea
Never 18423 (29.6 %) 738 (15.7 %) 19161 (28.6 %) 17793 (37.9 %) 662 (21.6 %) 18455 (36.9 %)
Former 12885 (20.7 %) 914 (19.4 %) 13799 (20.6 %) 12122 (25.8 %) 760 (24.8 %) 12882 (25.7 %)
Current 30931 (49.7 %) 3055 (64.9 %) 33986 (50.8 %) 17057 (36.3 %) 1644 (53.6 %) 18701 (37.4 %)
Family history of diabetes
No 41656 (66.0 %) 3114 (65.2 %) 44770 (65.9 %) 31282 (63.9 %) 2022 (63.7 %) 33304 (63.9 %)
Yes 18923 (30.0 %) 1463 (30.6 %) 20386 (30.0 %) 15378 (31.4 %) 1004 (31.6 %) 16382 (31.4 %)
Don’t know 2569 (4.1 %) 198 (4.1 %) 2767 (4.1 %) 2280 (4.7 %) 147 (4.6 %) 2427 (4.7 %)
Smoking statusa
Never smoked 32614 (52.0 %) 2188 (46.2 %) 34802 (51.6 %) 25547 (52.5 %) 1429 (45.2 %) 26976 (52.1 %)
Past smoker 26685 (42.6 %) 2207 (46.6 %) 28892 (42.9 %) 19615 (40.3 %) 1445 (45.7 %) 21060 (40.6 %)
(HR 1.13 [95 % CI 1.07–1.20]) and antidepressant use at baseline (1.18 [95 % CI 1.10–1.28]), based on Cox models. Multivariable longitudinal analyses confirmed this relationship with recent antidepressant medica-tion use, but found only prolonged elevated depres-sive symptoms to be significantly associated with increased risk. Our analyses were performed on 120,495 women in the WHI and adjusted for the same confounders, but utilized Cox models as well as propensity score adjusted models and MSMs. Our analyses found a consistent, significant increase in diabetes risk among those reporting antidepressant medication use by four different statistical approaches. In all approaches considered, presence of elevated de-pressive symptoms was rendered marginally or non-significant after adjusting for confounders. Our results are consistent with previous studies examining the
relationship of antidepressant medication use and risk of type 2 diabetes [3–6, 27, 28].
Of the four different modeling approaches considered in this paper, MSMs are the gold standard for use in observa-tional studies in which the presence of time-dependent confounding (Fig. 2, Appendix) is a possibility. For obser-vational study settings in the absence of time-dependent confounding, propensity score adjusted models can be used to adjust for bias in exposure assignment. Propensity score adjusted models correct for confounding by indica-tion– this bias is present in studies in which individuals who are prescribed or take a medication are inherently different in their risk profile with respect to outcome when compared to those who do not take the drug. In the absence of confounding by indication and time-dependent confounding, simpler Cox models with or without time-varying covariates are appropriate.
Table 1Baseline characteristics of study participants in the Women’s Health Initiative (N = 120,495)(Continued)
Reported diagnosis of diabetes by end of follow-upa
No 60077 (94.8 %) 4468 (93.3 %) 64545 (94.7 %) 45269 (92.1 %) 2886 (90.6 %) 48155 (92.0 %)
Yes 3303 (5.2 %) 321 (6.7 %) 3624 (5.3 %) 3870 (7.9 %) 301 (9.4 %) 4171 (8.0 %)
Years from enrollment to developing diabetesa
Mean (SD) 7.7 (1.5) 7.6 (1.5) 7.7 (1.5) 8.0 (1.7) 7.9 (1.7) 8.0 (1.7)
Median (IQR) 7.9 (2.0) 7.9 (2.0) 7.9 (2.0) 8.0 (1.7) 8.00 (1.9) 8.0 (1.8)
a
P–value of <0.002 or lower
Table 2Hazard ratios for presence of elevated depressive symptoms and antidepressant use with respect to incident diabetes risk Unadjusted Cox
PH model
Approach 1a Approach 2a Approach 3a Approach 4a
Cox PH Model (baseline antidepressant medication use and baseline presence of elevated depressive symptoms)
Cox PH Models (baseline values of all predictors)
Cox Models (time varying antidepressant medication use, presence of elevated depressive symptoms, and BMI; baseline values for other covariates)
Cox Models (time varying antidepressant medication use, presence of elevated depressive symptoms, and BMI; adjusted for propensity score and baseline values for other covariates)
Marginal Structural Models (time varying antidepressant medication use, presence of elevated depressive symptoms, and BMI; baseline values for other covariates)
Predictor HR (95 % CI) HR (95 % CI) HR (95 % CI) HR (95 % CI) HR (95 % CI)
Observational Cohort (OS) (N= 68,169)
Antidepressant medication use up to year 3
1.26 1.19 1.31 1.32 1.35
(1.12–1.41) (1.06–1.35) (1.18–1.46) (1.19–1.47) (1.21–1.51)
Presence of elevated depressive symptoms
1.34 1.11 1.12 1.09 1.10
(1.23–1.45) (1.02–1.21) (1.03–1.23) (1.00–1.19) (1.00–1.20)
Clinical Trial (CT) (N= 52,326)
Antidepressant medication use up to year 3
1.17 1.14 1.26 1.25 1.27
(1.04–1.31) (1.01–1.30) (1.12–1.41) (1.12–1.40) (1.13–1.43)
Presence of elevated depressive symptoms
1.31 1.13 1.12 1.09 1.10
(1.21–1.42) (1.04–1.23) (1.03–1.22) (0.996–1.18) (1.00–1.20)
a
Table 3Estimate of variation in presence of depressive symptoms and antidepressant medication use over time WHI-OSN= 68,169
Antidepressant use at baseline No antidepressant use at baseline
N(%) N(%)
Antidepressant use at year 3 3321 (4.9 %) 3083 (4.5 %)
No antidepressant use at year 3 1468 (2.2 %) 60297 (88.5 %)
Presence of elevated symptoms at baseline No presence of elevated symptoms at baseline
N(%) N(%)
Presence of elevated symptoms at year 3 4348 (6.4 %) 6333 (9.3 %)
No presence of elevated symptoms at year 3 5458 (8.0 %) 52030 (76.3 %)
Baseline Year 3
Mean (SD) Mean (SD)
BMI 26.80 (5.5) 27.09 (5.6)
WHI-CTN= 52,326
Antidepressant use at baseline No antidepressant use at baseline
N(%) N(%)
Antidepressant use at year 3 2031 (3.9 %) 1979 (3.8 %)
No antidepressant use at year 3 1156 (2.2 %) 47160 (90.1 %)
Baseline Year 3
Mean (SD) Mean (SD)
BMI 28.54 (5.7) 28.78 (5.9)
We did not observe differences in hazard ratio esti-mates between the four modeling approaches that were considered. One explanation for the concordance of esti-mates from these different approaches suggests that time-dependent confounding by BMI was not a substan-tial factor in these data –thus, BMI measured over the course of observation may not be strongly affected by exposure (i.e., as an intermediate) and/or did not exert a strong influence on our exposure and outcome of inter-est (i.e., as a confounder). However, other potential ex-planations for this observed concordance of results include limited longitudinal measurements of the key exposure variables, measurement error of the con-founder and/or incorrect model specification of the dose response relationship with respect to the effects of the confounder on both exposure and outcome. However, this study was not designed to pinpoint the specific fac-tor that caused the concordance of estimates from the various models.
A limitation of this work is that we had limited longi-tudinal follow up. The WHI-OS had two repeated mea-sures, at baseline and at year 3. The WHI-CT had more repeated measures available, but we were only able to utilize three time points (baseline, year 1, year 3) due to high levels of missing data at later time points. In addition, in the WHI-CT, because presence of elevated depressive symptoms was measured on only a small per-centage of participants after year 1, our models could not incorporate this factor as a time varying exposure. Due to limitations of the available data, the analysis did not account for antidepressant dose and adherence. While a bidirectional association between depression and diabetes risk is biologically plausible, our study was not designed to tease out the direction of association. Lastly, due to cost considerations, diabetes status was ascertained through self-reported questionnaires – this could result in modest levels of outcome misclassifica-tion. Statistical models that account for the error-prone self-reported outcomes would be useful in this context.
Conclusions
Our analyses provide further evidence that a significant increase in diabetes risk is observed for those on anti-depressant medications in the WHI. In addition, our re-sults comparing modeling approaches demonstrates that in some settings, results from more complex methods such as MSMs may not differ substantially from trad-itional methods of analysis – however, we recommend that these methods be explored to establish the validity of initial findings.
Appendix
SAS Code to Fit the Marginal Structural Cox Proportional Hazards Model
Here we provide details on how to set up the data, along with SAS code to perform the analyses in Ap-proach 4 using Marginal Structural Models for a time to event outcome. The first part of the analysis uses the proc logistic procedure to calculate the probability of not being on antidepressants (Models 1 and 2). Data in the file‘iptw’contains 1 record per subject for each time point included in the analysis. For example, in the WHI-OS dataset, we have measurements at baseline and year 3. Each subject has two records, one for baseline and one for year 3. Next we use the proc logistic procedure to calculate the probability of not being censored (Models 3 and 4). In the data file ‘iptw2’ the data has been expanded so that a subject has 1 record per month until her time to diabetes or time to censoring. The dataset ‘main’ merges Models 1-4 together to calculate the IPTW weights. This again is an expanded dataset so a subject has 1 record per month until her time to dia-betes or time to censoring. The dataset ‘main_w’ con-tains the inverse probability of treatment weights and is the dataset used to run the marginal structural model analysis. Last, we use the proc genmod procedure to fit the final pooled logistic regression model to obtain the estimates of our association of interest.
Antidep is a dichotomous 0/1 indicator of the partici-pant being on or off antidepressants. Model 1 includes that dichotomous indicator as the outcome, a time-dependent intercept and baseline values of the following covariates as predictors: presence of elevated depressive symptoms (base_depression), BMI (base_bmi),
Age(age),Ethnicity(ethnic),Education(educ4),
Minutes of physical activity per week (tminwk),
Total energy intake (base_energy_cat), Family history of diabetes (diabrel), Hormone therapy
use (hormstat) and smoking status (smoking).
Model 2 mirrors Model 1 with the addition of the most recent time-dependent values of the following covariates: presence of elevated depressive symptoms
(depression),and BMI(bmi).
The outcome variable in Models 3 and 4 is a dichot-omous indicator of whether or not the participant has been censored up to that time point. Model 3 includes as regressors the baseline values for the following co-variates: the dichotomous indicator of antidepressant medication use (antidep), presence of elevated depressive symptoms (base_depression), BMI
(base_bmi), Age (age), Ethnicity (ethnic),
Education(educ4),Minutes of physical activity per week
(tminwk),Total energy intake(base_energy_cat),
Family history of diabetes(diabrel),Hormone therapy
use (hormstat) and smoking status (smoking). All
Table 4Baseline characteristics of study participants, by presence of elevated depressive symptoms Presence of elevated depressive symptoms
No Yes Total No Yes Total
N(%) N(%) N(%) N(%) N(%) N(%)
WHI-OSN= 68,169 WHI-CTN= 52,326
Antidepression medication usea
No 54923 (94.1 %) 8457 (86.2 %) 63380 (93.0 %) 42582 (95.0 %) 6557 (87.4 %) 49139 (93.9 %)
Yes 3440 (5.9 %) 1349 (13.8 %) 4789 (7.0 %) 2238 (5.0 %) 949 (12.6 %) 3187 (6.1 %)
Agea
Mean(SD) 63.7 (7.2) 62.9 (7.5) 63.6 (7.3) 62.9 (6.9) 61.8 (7.1) 62.8 (6.9)
Median(IQR) 64.0 (11.0) 63.0 (12.0) 64.0 (11.0) 63.0 (11.0) 61.0 (11.0) 63.0 (11.0)
Ethnicitya
American Indian/Alaskan Native 172 (0.3 %) 55 (0.6 %) 227 (0.3 %) 151 (0.3 %) 38 (0.5 %) 189 (0.4 %)
Asian or Pacific Islander 1839 (3.2 %) 214 (2.2 %) 2053 (3.0 %) 1124 (2.5 %) 105 (1.4 %) 1229 (2.4 %)
Black/African American 3490 (6.0 %) 705 (7.2 %) 4195 (6.2 %) 3607 (8.1 %) 778 (10.4 %) 4385 (8.4 %)
Hispanic/Latino 1478 (2.5 %) 513 (5.2 %) 1991 (2.9 %) 1313 (2.9 %) 483 (6.4 %) 1796 (3.4 %)
White 50798 (87 %) 8196 (83.6 %) 58994 (86.5 %) 38158 (85.1 %) 6009 (80.1 %) 44167 (84.4 %)
Other 586 (1.0 %) 123 (1.3 %) 709 (1.0 %) 467 (1.0 %) 93 (1.2 %) 560 (1.1 %)
Educationa
<= High school 1957 (3.4 %) 641 (6.6 %) 2598 (3.8 %) 1837 (4.1 %) 609 (8.2 %) 2446 (4.7 %)
High school or GED 8784 (15.2 %) 1733 (17.8 %) 10517 (15.5 %) 8074 (18.1 %) 1504 (20.2 %) 9578 (18.4 %)
> = High school, but less than 4 years of college 20643 (35.6 %) 3709 (38.2 %) 24352 (36.0 %) 17315 (38.9 %) 3031 (40.7 %) 20346 (39.1 %)
4 or more years of college 26557 (45.8 %) 3631 (37.4 %) 30188 (44.6 %) 17330 (38.9 %) 2295 (30.9 %) 19625 (37.7 %)
BMIa
Mean(SD) 26.7 (5.4) 27.6 (6.0) 26.8 (5.5) 28.4 (5.6) 29.3 (6.0) 28.5 (5.7)
Median(IQR) 25.6 (6.3) 26.5 (7.1) 25.7 (6.4) 27.5 (7.1) 28.4 (7.7) 27.6 (7.2)
Minutes of recreational physical activity per weeka
Mean(SD) 210.1 (186.6) 170.8 (175.7) 204.5 (185.6) 165.4 (168.7) 139.7 (165.5) 161.7 (168.5)
Median(IQR) 170.0 (225.0) 127.5 (220.0) 165.0 (225.0) 125.0 (220.0) 85.0 (200.0) 120.0 (215.0)
Total energy intake (kcal/day)a
Mean(SD) 1529.7 (588.9) 1593.2 (679.5) 1538.8 (603.2) 1710.7 (666.7) 1796.8 (762.7) 1723.0 (682.0)
Median(IQR) 1461.9 (719.7) 1493.9 (817.1) 1465.4 (733.4) 1618.0 (815.0) 1671.6 (951.6) 1623.7 (833.7)
HRT use evera
Never 16498 (28.8 %) 2663 (27.7 %) 19161 (28.6 %) 15945 (37.2 %) 2510 (34.9 %) 18455 (36.9 %)
Former 11590 (20.2 %) 2209 (22.9 %) 13799 (20.6 %) 10805 (25.2 %) 2077 (28.9 %) 12882 (25.7 %)
Current 29228 (51.0 %) 4758 (49.4 %) 33986 (50.8 %) 16099 (37.6 %) 2602 (36.2 %) 18701 (37.4 %)
Relative had adult diabetesa
No 38718 (66.6 %) 6052 (62.0 %) 44770 (65.9 %) 28802 (64.5 %) 4502 (60.3 %) 33304 (63.9 %)
Yes 17225 (29.6 %) 3161 (32.4 %) 20386 (30.0 %) 13867 (31.1 %) 2515 (33.7 %) 16382 (31.4 %)
Smoking statusa
Never Smoked 29984 (52.0 %) 4818 (49.7 %) 34802 (51.6 %) 23382 (52.7 %) 3594 (48.4 %) 26976 (52.1 %)
Past Smoker 24751 (42.9 %) 4141 (42.7 %) 28892 (42.9 %) 18012 (40.6 %) 3048 (41.1 %) 21060 (40.6 %)
Current Smoker 2971 (5.1 %) 738 (7.6 %) 3709 (5.5 %) 3004 (6.8 %) 776 (10.5 %) 3780 (7.3 %)
Reported diagnosis of diabetes by end of follow-upa
No 55407 (94.9%) 9138 (93.2%) 64545 (94.7%) 41399 (92.4%) 6756 (90.0%) 48155 (92.0%)
medication use (antidepressant_tv),presence of el-evated depressive symptoms (depression) and BMI
(bmi). Models 3 and 4 also include variables for‘month’
and‘month2’to relax the linearity assumption.
We merge Models 1-4 together and in the following data step use the predicted values from those models to compute our IPTW estimates, denoted by stabw and
nstabw for the stabilized and non-stabilized weights,
respectively.
In our last step, we use the proc genmod procedure to fit the weighted pooled logistic model to obtain es-timates of our association of interest from our Mar-ginal Structural Cox PH Model. The outcome here is diabetes, which is a dichotomous indicator of whether or not the participant developed diabetes during that month. The patient ID variable and the independent working correlation matrix (subject = id/type = ind) must be specified. We weighted the model used the stabilized weights by using the ‘scwgt stabw’statement in the procedure. The ‘estimate’ statement asks the procedure to report the odds ratio for our main asso-ciations of interest, in addition to the coefficients in the model.
/*calculate probability of not being on antidepressants*/
/* Model 1*/
proc sortdata=iptw;
by id month;
run;
proc logisticdata=iptw;
class base_depression ethnic educ4
base_energy_cat hormstat smoking diabrel;
where month=36;
model antidep=base_depression base_bmi age ethnic educ4 tminwk base_energy_cat diabrel hormstat smoking month;
output out=model1 p=pandep_0_temp;
run;
/* Model 2*/
proc logisticdata=iptw;
where month=36;
class base_depression depression ethnic educ4 base_energy_cat energy_cat hormstat smoking diabrel;
model antidep=base_depression depression
base_bmi bmi age ethnic educ4 tminwk
base_energy_cat diabrel hormstat smoking month;
output out=model2 p=pandep_w_temp;
run;
/*calculate probability of not being
censored*/ /* Model 3*/
proc logisticdata=iptw2;
class antidep depression ethnic educ4
base_energy_cat hormstat smoking diabrel; model censor_tv=antidep depression bmi age ethnic educ4 tminwk base_energy_cat diabrel hormstat smoking month month_sq;
output out=model3 p=punc_0;
run;
/* Model 4*/
proc logisticdata=iptw2;
class antidep antidepressant_tv depression depression_tv ethnic educ4 base_energy_cat hormstat smoking diabrel;
model censor_tv=antidep antidepressant_tv
depression bmi age ethnic educ4 tminwk
base_energy_cat diabrel hormstat smoking depression_tv bmi_tv month month_sq;
output out=model4 p=punc_w;
run;
/*merge data*/
datamain;
merge temp1 temp2 model3(in=a)
model4(in=b);
by id month; if a=1and b=1;
if first.id then do;
pandep_0 =1;
pandep_w =1;
end;
if month=36then do;
pandep_0=pandep_0_temp; pandep_w=pandep_w_temp; end;
retain pandep_0 pandep_w;
run;
/* Calculate the weights*/
datamain_w;
set main; by id month;
/*reset variables for a new patient*/ Table 4Baseline characteristics of study participants, by presence of elevated depressive symptoms(Continued)
Years from enrollment to development of diabetesa
Mean(SD) 7.7 (1.5) 7.6 (1.6) 7.7 (1.5) 8.0 (1.7) 7.9 (1.8) 8.0 (1.7)
Median(IQR) 7.9 (2.0) 7.9 (2.0) 7.9 (2.0) 8.0 (1.7) 8.0 (1.9) 8.0 (1.8)
Don’t Know 2212 (3.8 %) 555 (5.7 %) 2767 (4.1 %) 1975 (4.4 %) 452 (6.1 %) 2427 (4.7 %)
a
Table 5Inverse probability of treatment-weighted estimates of the marginal structural model
Parameter Estimate SE 95 % Confidence limits HR (95 % CI) P-Value
WHI-OS
Antidepressant medication use <.0001
Yes 0.30 0.06 0.19 0.41 1.35 (1.21-1.51)
No 0.00 0.00 0.00 0.00 1 .
Presence of elevated depressive symptoms 0.04
Yes 0.09 0.05 0.00 0.18 1.09 (1.00-1.20)
No 0.00 0.00 0.00 0.00 1 .
Ethnicity
American Indian/Alaskan Native 0.72 0.20 0.32 1.12 2.05 (1.38-3.06) 0.0004
Asian or Pacific Islander 0.78 0.09 0.61 0.95 2.18 (1.84-2.59) <.0001
Black/African American 0.56 0.06 0.46 0.67 1.75 (1.58-1.95) <.0001
Hispanic/Latino 0.52 0.09 0.35 0.69 1.68 (1.42-1.99) <.0001
White 0.00 0.00 0.00 0.00 1 .
Other 0.35 0.15 0.05 0.65 1.42 (1.05-1.92) 0.02
Education level
<= high school 0.37 0.08 0.22 0.52 1.45 (1.25-1.68) <.0001
High school or GED 0.29 0.05 0.19 0.39 1.34 (1.21-1.48) <.0001
> = High school, but less than 4 years of college 0.22 0.04 0.14 0.30 1.25 (1.15-1.35) <.0001
4 or more years of college 0.00 0.00 0.00 0.00 1 .
Minutes or recreational physical activity per week -0.0006 0.0001 -0.0008 -0.0004 0.9994 (0.9992-0.9996) <.0001
Family history of diabetes
No -0.78 0.04 -0.85 -0.71 0.46 (0.43-0.49) <.0001
Yes 0.00 0.00 0.00 0.00 1 .
Don’t know -0.41 0.08 -0.57 -0.24 0.66 (0.57-0.79) <.0001
Hormone therapy use
Never 0.00 0.00 0.00 0.00 1 .
Former 0.01 0.05 -0.09 0.10 1.01 (0.91-1.11) 0.89
Current -0.12 0.04 -0.20 -0.04 0.89 (0.82-0.96) 0.004
Smoking status
Never smoked 0.00 0.00 0.00 0.00 1 .
Past smoker 0.05 0.04 -0.03 0.12 1.05 (0.97-1.13) 0.21
Current smoker 0.17 0.07 0.03 0.31 1.19 (1.03-1.36) 0.02
BMI 0.08 0.00 0.08 0.08 1.08 (1.08-1.09) <.0001
Age 0.02 0.00 0.01 0.02 1.02 (1.01-1.02) <.0001
Baseline total energy intake
4.87- 1100.54 -0.21 0.05 -0.30 -0.11 0.81 (0.74-0.90) <.0001
1100.55- 1437.42 -0.24 0.05 -0.33 -0.14 0.79 (0.72-0.87) <.0001
1437.44- 1828.01 -0.18 0.05 -0.27 -0.08 0.84 (0.76-0.92) 0.00
> = 1828.02 0.00 0.00 0.00 0.00 1 .
WHI-CT
Antidepressant medication use <.0001
Yes 0.24 0.06 0.13 0.36 1.27 (1.14-1.43)
Table 5Inverse probability of treatment-weighted estimates of the marginal structural model(Continued)
Presence of elevated depressive symptoms 0.04
Yes 0.09 0.05 0.00 0.18 1.09 (1.00-1.20)
No 0.00 0.00 0.00 0.00 1 .
Ethnicity
American Indian/Alaskan Native 0.09 0.26 -0.41 0.60 1.09 (0.66-1.82) 0.71
Asian or Pacific Islander 0.73 0.10 0.54 0.91 2.08 (1.72-2.48) <.0001
Black/African American 0.41 0.05 0.32 0.51 1.51 (1.38-1.67) <.0001
Hispanic/Latino 0.50 0.08 0.35 0.65 1.65 (1.42-1.92) <.0001
White 0.00 0.00 0.00 0.00 1 .
Other 0.38 0.14 0.10 0.65 1.46 (1.11-1.92) 0.007
Education
<= high school 0.32 0.07 0.18 0.46 1.38 (1.20-1.58) <.0001
High school or GED 0.20 0.05 0.10 0.29 1.22 (1.11-1.34) <.0001
> = High school, but less than 4 years of college 0.22 0.04 0.14 0.30 1.25 (1.15-1.35) <.0001
4 or more years of college 0.00 0.00 0.00 0.00 1 .
Minutes or recreational physical activity per week -0.001 0.000 -0.001 0.000 0.999 (0.999-1.000) <.0001
Family history of diabetes
Yes 0.00 0.00 0.00 0.00 1 .
No -0.68 0.03 -0.75 -0.61 0.51 (0.47-0.54) <.0001
Don’t know -0.32 0.07 -0.47 -0.18 0.73 (0.63-0.84) <.0001
Hormone therapy use
Never 0.00 0.00 0.00 0.00 1 .
Former -0.002 0.04 -0.08 0.08 0.998 (0.92-1.08) 0.97
Current -0.17 0.05 -0.26 -0.09 0.84 (0.77-0.91) 0.0001
Smoking status
Never smoked 0.00 0.00 0.00 0.00 1 .
Past smoker -0.01 0.04 -0.08 0.06 0.99 (0.92-1.06) 0.78
Current smoker 0.19 0.06 0.07 0.32 1.21 (1.07-1.38) 0.002
BMI 0.07 0.00 0.07 0.08 1.07 (1.07-1.08) <.0001
Age 0.02 0.00 0.01 0.02 1.02 (1.01-1.02) <.0001
Baseline total energy intake
4.87- 1100.54 -0.04 0.05 -0.13 0.06 0.96 (0.88-1.06) 0.46
1100.55- 1437.42 -0.04 0.05 -0.13 0.05 0.96 (0.88-1.05) 0.43
1437.44- 1828.01 -0.06 0.04 -0.15 0.03 0.94 (0.86-1.03) 0.17
1828.02- 23020.93 0 0 0 0 1 .
Participated in hormone therapy trial 0.07
Yes 0.09 0.05 -0.01 0.20 1.09 (0.99-1.22)
No 0 0 0 0 1 .
Participated in dietary modification trial 0.07
Yes 0.10 0.05 -0.01 0.20 1.11 (0.99-1.22)
No 0 0 0 0 1 .
Participated in calcium/ vitamin D supplementation 0.44
Yes -0.03 0.03 -0.09 0.04 0.97 (0.91-1.04)
if first.id then do;
k2_0=1; k2_w=1;
end;
retain k2_0 k2_w;
/*inverse probability of censoring
weights*/ else do;
k2_0=k2_0*punc_0; k2_w=k2_w*punc_w; end;
/* Inverse probability of treatment
weights */
if antidepressant_tv=0 and month>=36
then k1_0=pandep_0;
if antidepressant_tv=0 and month>=36
then k1_w=pandep_w;
if antidepressant_tv=1 and month>=36
then k1_0=(1-pandep_0);
if antidepressant_tv=1 and month>=36
then k1_w=(1-pandep_w);
if month<36then k1_0=1;
if month<36then k1_w=1;
/* Stabilized and non stabilized weights */
stabw=(k1_0*k2_0)/(k1_w*k2_w);
nstabw=1/(k1_w*k2_w);
run;
/* Pooled logistic regression model to run the MSM analysis */
proc genmoddata=main_w descending;
class id ethnic educ4 hormstat smoking base_energy_cat diabrel;
model diabetes_tv=antidepressant_tv eth-nic educ4 tminwk diabrel hormstat smoking depression_tv bmi_tv age base_energy_cat month month_sq/ link=logit dist=bin;
scwgt stabw;
repeated subject=id/ type=ind;
estimate "log O.R. antidepressant"
antidepressant_tv1/ exp;
estimate "log O.R. depressive symptoms"
depression_tv1/ exp;
run;
Abbreviations
WHI-CT:Women’s health initiative clinical trials cohort; WHI-OS: Women’s health initiative observational cohort; WHI: Women’s Health Initiative; BMI: Body mass index; IPTW: Inverse probability of treatment weights; CES-D: Center for Epidemiological Studies Depression Scale; PH: Cox
Table 6Estimated probability of having one’s own observed treatment history and censoring history at follow-up
N Mean SD Median Quartile range Minimum Maximum
WHI-OS
36 months
Probability of having observed antidepressant medication history
Given baseline covariates 64048 0.91 0.05 0.91 0.06 0.49 0.99
Given time-varying covariates 64048 0.91 0.06 0.92 0.06 0.36 0.99
Probability of being uncensored
Given baseline covariates 64099 0.99983 0.0000271 0.9998275 0.0000380 0.99963 0.99988
Given time-varying covariates 64099 0.99983 0.0000273 0.9998275 0.0000381 0.99964 0.99988
WHI-CT
12 months
Probability of having observed antidepressant medication history
Given baseline covariates 46084 0.93 0.05 0.94 0.05 0.52 0.995
Given time-varying covariates 46084 0.93 0.05 0.94 0.05 0.30 0.996
Probability of being uncensored
Given baseline covariates 46084 0.9999997 6.7564221E-8 0.9999997 9.1169629E-8 0.9999992 0.9999998
Given time-varying covariates 46084 0.9999997 6.7917506E-8 0.9999997 9.1473164E-8 0.9999992 0.9999998
36 months
Probability of having observed antidepressant medication history
Given baseline covariates 45235 0.86 0.09 0.88 0.10 0.24 0.99
Given time-varying covariates 45235 0.86 0.09 0.88 0.10 0.20 0.99
Probability of being uncensored
Given baseline covariates 45235 0.999971 6.6963806E-6 0.999971 9.041897E-6 0.99992 0.99998
Proportional Hazards; CI: Confidence interval; HR: Hazard ratio; MSMs: Marginal structural models.
Competing interests
The authors declare that they have no competing interests.
Authors’contributions
CF performed the statistical analyses and interpretation of the data. She also drafted the manuscript. XG assisted with data analysis and interpretation of the data. YM assisted with data acquisition and participated in revising the manuscript critically for important intellectual content. BW participated in revising the manuscript critically for important intellectual content. PP participated in revising the manuscript critically for important intellectual content. MZ assisted with data acquisition and data analysis. DS participated in data collection and revised the manuscript critically for important intellectual content. RB conceptualized the analysis plan, assisted with data analysis and interpretation of the data, and revised the manuscript critically for important intellectual content. All authors read and approved the final manuscript.
Authors’information Not applicable.
Availability of data and materials Not applicable.
Acknowledgements
This work was supported by National Institutes of Health grants 1R01HL122241 and 1R21 DK083700-01A1. The Women’s Health Initiative (WHI) program is funded by the National Heart, Lung, and Blood Institute, National Institutes of Health, U.S. Department of Health and Human Services through contracts N01WH22110, 24152, 32100-2, 32105-6, 32108-9, 32111-13, 32115, 32118-32119, 32122, 42107-26, 42129-32, and 44221. A list of WHI investigators is available in Supplementary Data online. The authors thank the principal investigators of all WHI clinical centers and the data coordinating center for their contribution to the study. They are also indebted to the dedicated and committed participants of the WHI.
Author details
1Division of Preventive and Behavioral Medicine, Department of Medicine,
University of Massachusetts Medical School, 55 Lake Avenue North, Worcester, MA 01655, USA.2Division of Biostatistics and Epidemiology,
School of Public Health and Health Sciences, University of Massachusetts, 715 North Pleasant Street, Amherst, MA 01003, USA.
Received: 7 April 2015 Accepted: 18 September 2015
References
1. Kim CK, McGorray SP, Bartholomew BA, Marsh M, Dicken T, Wassertheil-Smoller S, et al. Depressive symptoms and heart rate variability in postmenopausal women. Arch Intern Med. 2005;165(11):1239–44. doi:10.1001/archinte.165.11.1239.
2. Wild S, Roglic G, Green A, Sicree R, King H. Global prevalence of diabetes: estimates for the year 2000 and projections for 2030. Diabetes Care. 2004;27(5):1047–53.
3. Brown LC, Majumdar SR, Johnson JA. Type of antidepressant therapy and risk of type 2 diabetes in people with depression. Diabetes Res Clin Pract. 2008;79(1):61-7. doi: 10.1016/j.diabres.2007.07.009.
4. Rubin RR, Ma Y, Marrero DG, Peyrot M, Barrett-Connor EL, Kahn SE et al. Elevated depression symptoms, antidepressant medicine use, and risk of developing diabetes during the diabetes prevention program. Diabetes Care. 2008;31(3):420-6. doi: 10.2337/dc07-1827.
5. Andersohn F, Schade R, Suissa S, Garbe E. Long-term use of antidepressants for depressive disorders and the risk of diabetes mellitus. Am J Psychiatry. 2009;166(5):591-8. doi: 10.1176/appi.ajp.2008.08071065.
6. Campayo A, de Jonge P, Roy JF, Saz P, de la Camara C, Quintanilla MA et al. Depressive disorder and incident diabetes mellitus: the effect of
characteristics of depression. Am J Psychiatry. 2010;167(5):580-8. doi: 10.1176/appi.ajp.2009.09010038.
7. Olfson M, Marcus SC. National patterns in antidepressant medication treatment. Arch Gen Psychiatry. 2009;66(8):848-56. doi:10.1001/ archgenpsychiatry.2009.81.
8. The Medicated Americans: Antidepressant Prescriptions on the Rise July 15, 2013. http://www.sciam.com/article.cfm?id=the-medicated-americans. 9. Ma Y, Balasubramanian R, Pagoto SL, Schneider KL, Culver AL, Olendzki B
et al. Elevated depressive symptoms, antidepressant use, and diabetes in a large multiethnic national sample of postmenopausal women. Diabetes Care. 2011;34(11):2390-2. doi: 10.2337/dc11-1223.
10. Hernan MA, Brumback B, Robins JM. Marginal structural models to estimate the causal effect of zidovudine on the survival of HIV-positive men. Epidemiology. 2000;11(5):561–70.
11. Robins JM, Hernan MA, Brumback B. Marginal structural models and causal inference in epidemiology. Epidemiology. 2000;11(5):550–60.
12. Robins JM. Causal inference from complex longitudinal data. In: Berkane M, editor. Latent Variable Modeling and Applications to Causality. Lecture Notes in Statistics (120). New York, NY: Springer Verlag; 1997. p. 69–117. 13. Geoffroy MC, Li L, Power C. Depressive symptoms and body mass index:
co-morbidity and direction of association in a British birth cohort followed over 50 years. Psychol Med.44(12):2641-52. doi: 10.1017/S0033291714000142. 14. Chen AB, Li L, Cronin A, Schrag D. Comparative Effectiveness of
Intensity-Modulated Versus 3D Conformal Radiation Therapy Among Medicare Patients with Stage III Lung Cancer. J Thorac Oncol. 2014. doi:10.1097/JTO.0000000000000331.
15. Farber HW, Miller DP, McGoon MD, Frost AE, Benton WW, Benza RL. Predicting outcomes in pulmonary arterial hypertension based on the 6-minute walk distance. J Heart Lung Transplant. 2014. doi: 10.1016/ j.healun.2014.08.020.
16. Design of the Women's Health Initiative clinical trial and observational study. The Women's Health Initiative Study Group. Control Clin Trials. 1998;19(1):61-109.
17. Ritenbaugh C, Patterson RE, Chlebowski RT, Caan B, Fels-Tinker L, Howard B et al. The Women's Health Initiative Dietary Modification trial: overview and baseline characteristics of participants. Ann Epidemiol. 2003;13(9 Suppl):S87–97.
18. Stefanick ML, Cochrane BB, Hsia J, Barad DH, Liu JH, Johnson SR. The Women's Health Initiative postmenopausal hormone trials: overview and baseline characteristics of participants. Ann Epidemiol. 2003;13(9 Suppl):S78–86. 19. Langer RD, White E, Lewis CE, Kotchen JM, Hendrix SL, Trevisan M. The
Women's Health Initiative Observational Study: baseline characteristics of participants and reliability of baseline measures. Ann Epidemiol. 2003;13(9 Suppl):S107–21.
20. Margolis KL, Lihong Q, Brzyski R, Bonds DE, Howard BV, Kempainen S et al. Validity of diabetes self-reports in the Women's Health Initiative: comparison with medication inventories and fasting glucose measurements. Clin Trials. 2008;5(3):240-7. doi: 10.1177/1740774508091749.
21. Andresen EM, Malmgren JA, Carter WB, Patrick DL. Screening for depression in well older adults: evaluation of a short form of the CES-D (Center for Epidemiologic Studies Depression Scale). Am J Prev Med. 1994;10(2):77–84. 22. Rosenbaum PR, Rubin DB. The central role of the propensity score in
observational studies for causal effects. Biometrika. 1983;70(1):41–55. 23. Harlow S, Linet M. Reviews and commentary: Agreement between
questionnaire data and medical records: the evidence for accuracy of recall. American journal of epidemiology. 1989;129(2):233–48. 24. Pearl J. Understanding propensity scores.Causality: Models, Reasoning, and
Inference. 2nd ed. New York: Cambridge University Press; 2009. 25. Pearl J. Causality: Models, Reasoning, and Inference. New York:
Cambridge University Press; 2000.
26. Marcus A, Crane L. Smoking behavior among U.S. Latinos: an emerging challenge for public health. American journal of public health. 1985;75:169–72. 27. Pan A, Sun Q, Okereke OI, Rexrode KM, Rubin RR, Lucas M et al. Use of
antidepressant medication and risk of type 2 diabetes: results from three cohorts of US adults. Diabetologia. 2012;55(1):63-72. doi:10.1007/s00125-011-2268-4. 28. Fruchter R, Boyce J, Hunt M. Missed opportunities for early diagnosis of