EFFECT OF CRACK GEOMETRY ON
DYNAMIC STRESS INTENSITY
FACTOR UNDER IMPACT LOADING IN
THREE POINT BEND
CONFIGURATION FOR A HIGH
DENSITY ALUMINA SPECIMEN
MANOJ KUMAR BARAI
Department of Mechanical Engineering, Future Institute of Engineering & Management, Kolkata-700150, India West Bengal University of Technology, West Bengal, India.
E-mail:[email protected]
JAGABANDHU SHIT
Department of Mechanical Engineering, Jadavpur University, Kolkata-32, West Bengal, India. E-mail:[email protected]
DEBABRATA NAG
Department of Mechanical Engineering, Jadavpur University Kolkata 700 032, India
ABHIJIT CHANDA,
School of Bio-Science and Engineering, Jadavpur University Kolkata 700 032, India
MANOJ KR. MITRA
Department of Metallurgy, Jadavpur University, Kolkata 700 032, India
Abstract:
In the present paper, the effect of two different crack geometries on dynamic stress intensity factor for a three point bend configuration in short alumina ceramic beam has been studied. The first crack geometry has a typical surface edge crack (perpendicular to the surface) and the second one has a notched configuration with a small crack at its tip like a fatigue pre-crack. Real impact-response was captured using a suitable data acquisition system and fed into a standard finite element model. The solution was done using transient dynamic analysis. It was observed that crack with notch has a lower DSIF than that with straight surface crack. The efficacy of the model was validated by checking with the experimental results of DSIF available in literature.
Keywords: Impact, finite element, quarter point element, and dynamic stress intensity factor.
1. Introduction
In good number of such experiments, the specimen used, was similar to that of an impact specimen normally used in Charpy test owing to the simplicity in sample-preparation-methodology and ease of experimentation.
From the literature it has also been observed that impact fatigue tests [10] too, where DSIF plays a vital role, often used three-point bend configuration. In practical experiments for DSIF, a notch is created wherefrom a sharp straight crack generally initiates and propagates during loading as a function of time. The question whether the notch geometry affects DSIF or not is important, as it throws light on the understanding of fracture and impact fatigue behavior. This is particularly important for brittle materials where accurate notch–crack configuration is necessary for correct assessment. Newman et al. [11], Peng et al. [12], Rokatch et al. [13-15], Sinclair et al. [16-17] have already reported the effect of crack orientation and crack shape on the DSIF however the comparative effect of notch and straight crack on DSIF for brittle specimens are yet to reported in a comprehensive way.
The present numerical analysis aims to address this aspect in a quantitative manner using finite element method. The analysis has been supported by impact experiments on a short, cracked alumina beam. Transient dynamic analysis with a finite element model was used. The modeling of the notch and crack beam has been performed using the standard Finite Element package -ANSYS 5.4.
2. Dynamic stress intensity factor for non-propagating crack:
Determination of Stress Intensity factor is a vital task so far design is concerned. In case of components which are subjected to dynamic or time–dependent loading, stress intensity factor under such dynamic loading is required to be found out prior to design. The present work dealt with stress intensity factor of a dynamically loaded three-point bend specimen made of fully dense alumina. The specimen was subjected to impact loading with a swinging pendulum where the force rises to certain peak value and falls down within a short interval of time. The calculated stress intensity factor also varied with time and reached a peak value and then decreased. Here it may be noted that during the time span under consideration the crack was not propagating and hence the dynamic stress intensity factor can be more specifically termed as dynamic stress intensity factor for a non-propagating crack. It may further be noted that in the present analysis, transient dynamic response of the specimen was considered however the effect of reflected stress waves on crack tip stress and strain fields was neglected.
The analysis was solved using transient dynamic analysis where experimentally impact response was simulated, using the governing equation analysis:
M
v
C v
K
v
F t
( )
(1)In the above Equation (1),
is the nodal displacement at a particular time. Using
( )
t
, the dynamic stress intensity factorK t
I( )
for non-propagating crack is found by:2
( )
2
( )
4(1
)
I
t E
K t
r
(2)3. Geometric model.
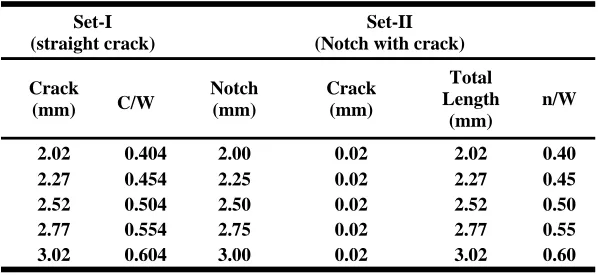
The beam used in the present work was assumed to be a short beam, simply supported at two ends under a point impact load at the center. Following geometrical dimension for the specimen excluding the crack were assumed as: length, L = 60 mm, width, W = 5 mm, thickness, B = 5 mm. Fig 1 shows how the swinging pendulum provided dynamic shock loading to the specimen and also describes the general methodology in the form of a sequential process flow diagram. Analysis with two types of cracks was made: (a) only straight crack and (b) notch-crack combination. For the purpose of comparative analysis, two sets of crack size and notch size was considered as mentioned in Table-1. The notch or crack was considered to be at the surface with tensile stress. The swinging pendulum having mass of 0.25 Kg. was released from three different angles e.g., 15, 20 and 25 degree.
4. Finite element model of the crack
A full two-dimensional modeling for both types of beam specimens (one with straight crack and the other with notch along with a small crack at its tip) was done using six-node triangular element (Fig 2). To handle the stress singularity, Quarter Point element (QP) had been placed at the first row of crack tip. The Quarter Point element had mid-side nodes shifted to one fourth of the length of the sides. The number of QP elements put around the crack tip was fourteen. The minimum number of elements for the mesh was obtained for mesh grid independency by checking the results for coarse mesh and continually meshing the beam element with higher mesh. It was found that after 5546 elements there was no significant change of results. The mesh size and the corresponding values are given in Table 2.
5 Impact load measurement
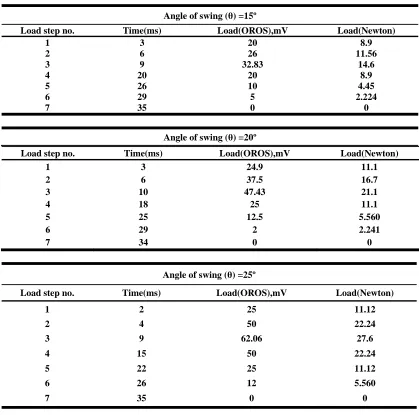
A suitable Data Acquisition System (DAS) was employed for capturing the response of impact loads as a function of time during collision of the pendulum bob (ball) on the specimen. The system consisted of a data acquisition board and a computer with data acquisition software called OROS. A piezoelectric type load cell was used for sensing the impact response of the swinging pendulum ball. For measuring the impact response of the freely swinging pendulum with the specimen, the later was replaced by the load cell and was adjustably fixed so as to ensure the contact of impact occurred at the center of the pendulum bob and the shallow semi-spherical hard surface of the load cell. A signal conditioner filtered the signal before the signal entered the data acquisition board. Experiments were carried out to measure three different impact-load responses for pendulum falling from angles of 15, 20 and 25 degree. Table 3 shows the impact response being captured by the DAS for the experimental data of the pendulum swing. It is observed from the figure that, the impact lasted for a small duration of approximately 35 ms.
6. Results & Discussion
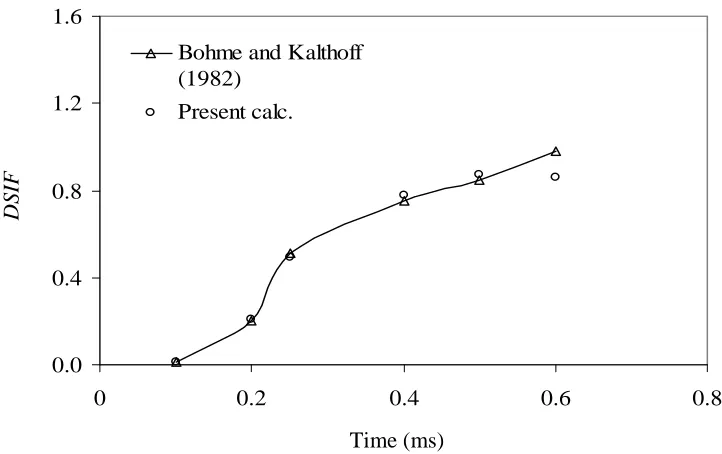
6.1 Validation of the model:
6.2 Results with Straight cracks:
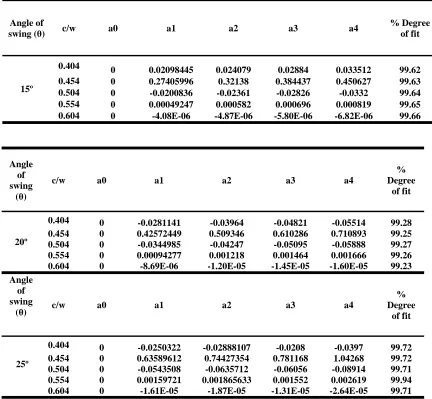
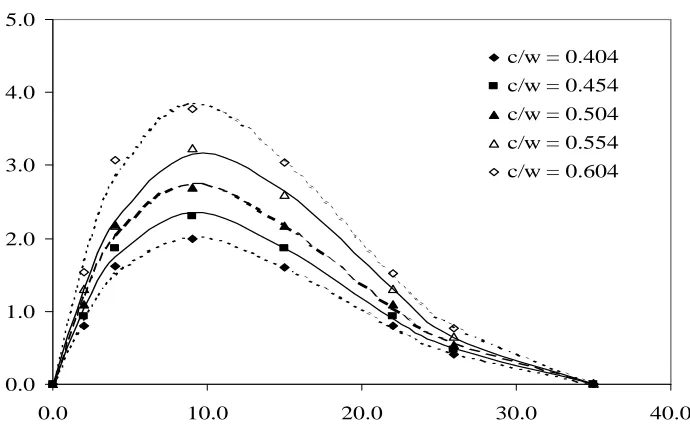
Specimens with straight cracks with dimensions mentioned in Table 1 were subjected to different impact loads (owing to different angles of swing of the same ball) and following transient analysis, DSIF values were obtained as a function of time which are shown in Fig 5(a) through 5(c). Fig 5 (a-c) shows that for straight cracks without notch, DSIF varies in a typical non-linear fashion with time and this variation pattern was more or less same for all three angles of swing. It has been observed that the variation of DSIF with time follows fourth degree polynomial equation [equation (2)] with high percentage fitting (> 99%) in all the cases. The
coefficients ai i0 i 4 are presented in Table 4(a) along with the percentage of degree of fitness.
2 3 40 1 2 3 4
sc
DSIF
a
a t
a t
a t
a t
(3)
With increase in c/w the whole curve is deflected upward and peak DSIF values also increase. For three different angles, with maximum length of straight crack, peak DSIF values were 1.97, 2.68 and 3.86 MPam0.5 respectively. In this context, it may be noted that alumina samples used in the experiment were of value around 3.75 MPa m0.5 and the specimens with maximum c/w suffered fracture with a single impact in most of the cases with 25 degree angle of swing however the other specimens with lower crack length could mostly withstand repeated impacts. It apparently shows that the critical stress intensity factor for dynamic fracture bears some sort of relationship with K1C .
It is evident from the curves that peak values of DSIF for three different angles of swing occur at around 8-10 ms. With maximum c/w, maximum DSIF occurs at 10.98, 9.21 and 8.96 ms for angles of swing 15, 20 and 25 degrees respectively. It shows that with the increase in angle of swing, DSIF attains its maximum value at an earlier time. In this regard it may be noted that the peak load during impact also attained maximum value around 8-10 ms and even after transient analysis DSIF attains peak value in the same time region. However as c/w increases, the time at which maximum DSIF occurs decreases. This is true for all three angles. In the time range 8-10 ms, the difference between corresponding DSIF values for different crack lengths was also found to be maximum.
6.3 Results with Notched cracks:
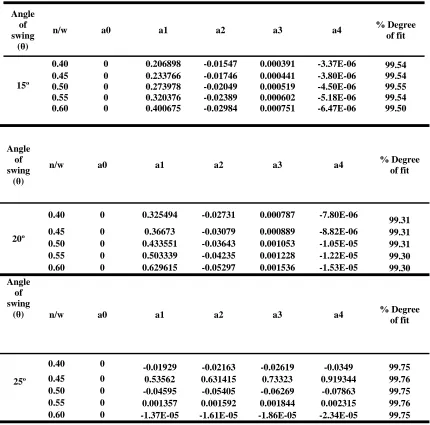
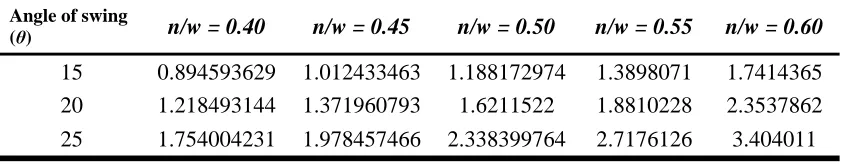
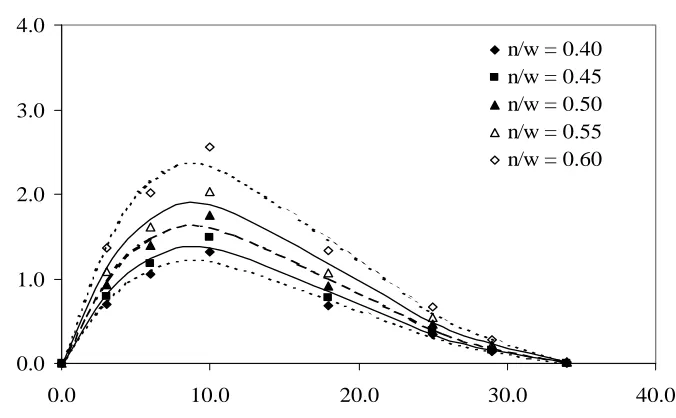
For the specimens with notched crack (i.e., notch with crack), similar analysis was done and data obtained is plotted in Fig. 6 (a) through 6(c). It shows that there was no gross deviation from the cases with straight crack geometry regarding the pattern of variation of DSIF with time. Here also DSIF varied with time following a fourth degree polynomial equation [similar to Equation (3) above] with very high percentage of fit ( > 99%) in all the cases [Table 4(b)]. Maximum DSIF values with highest notched crack length were 1.74, 2.35 and 3.40 MPa.m0.5 for 15, 20 and 25 degree of swing-angles respectively and as expected, none of the specimens suffer fracture with single blow. It further confirms the already mentioned correlation between DSIF and KIC.
It was observed that the peak DSIF values were consistently lower by 10-15 % than the corresponding values with straight-crack-cases. This phenomenon was observed consistently for all three angles of swing and for all comparable non-dimensional crack or notch lengths. With the increase in angle of swing, the time at which peak DSIF occurred decreased in almost an identical pattern with that of straight crack geometry.
Fig 7(a) and (7b) show the variation pattern of peak DSIF values with straight crack and notched crack geometries. It clearly reveals that the variation pattern was similar, followed a nearly similar type of equation in almost all the cases. However there was a substantial difference in the absolute values of peak DSIF particularly with high values of c/w or n/w. Tables 5(a) and 5(b) show how the peak DSIF values differ in two cases. It reveals that with low c/w or low n/w, the difference was not so high however with an intermediate value around 0.55, the difference was maximum. This was noticed for all three angles of swing.
crack-length attained a maxima at certain value of c/w or n/w. If the crack gets further elongated,
K
peak decreases.For all impact loads, this critical value of non-dimensional crack length remains more or less unaltered. From the plot of Kpeak with different crack lengths, the value of this critical non-dimensional crack length is found to be: c/w = 0.554. This may be a useful consideration while designing a dynamic fracture experiment with straight crack or notched crack specimen. However, this computational result requires to be verified with detailed experimental measurement of DSIF.
7.
Conclusions
Stress intensity factor for non-propagating cracks (DSIF) under impact loading considering three point bend configuration has been numerically determined through a finite element based software package. From the study the following conclusions may be made:
i Experimental data obtained from standard literature was found to be in close conformity with the computed data, generated using the present method of analysis.
ii In general the variation of DSIF for specimens having straight crack and those having notch with small pre-cracking at tip followed a non-linear pattern with time. From the study it was evident that in all such cases, this variation followed a fourth-degree polynomial equation with high degree of fitness.
iii Peak value of DSIF occurs earlier with increase in angle of swing. This has been found to be true for both the types of specimens.
iv DSIF values for straight cracks were higher than the corresponding DSIF values with notched specimens with small pre-cracking.
v With longest straight crack and maximum angle of swing, DSIF value exceeds KIC value of alumina and in the supporting experimental set up, alumina samples suffered fracture with a single blow. With notch, no specimen suffered fracture from a single blow, as DSIF values were low.
vi Peak DSIF value for specimen having straight crack increased with crack length. For notched specimens too, it increased with notch depth; however the trend of variation was not identical.
vii At a particular value of c/w or n/w ( = 0.554), the difference in peak DSIF values between the two cases was observed to be maximum.
Table 1: Physical Dimensions of Straight Cracks and Notches with Cracks
Set-I (straight crack)
Set-II (Notch with crack)
Crack
(mm) C/W
Notch (mm)
Crack (mm)
Total Length
(mm)
n/W
2.02 0.404 2.00 0.02 2.02 0.40
2.27 0.454 2.25 0.02 2.27 0.45
2.52 0.504 2.50 0.02 2.52 0.50
2.77 0.554 2.75 0.02 2.77 0.55
Table 3: Different load step for different angle of swing of pendulum in impact load
Angle of swing (θ) =20º
Angle of swing (θ) =25º
Load step no. Time(ms) Load(OROS),mV Load(Newton)
1 2 25 11.12
2 4 50 22.24
3 9 62.06 27.6
4 15 50 22.24
5 22 25 11.12
6 26 12 5.560
7 35 0 0
MESH 1 MESH 2 MESH 3 MESH 4 MESH 5
504 1044 1682 2308 3100
MESH 6 MESH 7 MESH 8 MESH 9 MESH 10
4068 5024 5546 (mesh used) 6144 7300
Mesh 11
9018
Angle of swing (θ) =15º
Load step no. Time(ms) Load(OROS),mV Load(Newton)
1 3 20 8.9
2 6 26 11.56
3 9 32.83 14.6
4 20 20 8.9
5 26 10 4.45
6 29 5 2.224
7 35 0 0
Load step no. Time(ms) Load(OROS),mV Load(Newton)
1 3 24.9 11.1
2 6 37.5 16.7
3 10 47.43 21.1
4 18 25 11.1
5 25 12.5 5.560
6 29 2 2.241
7 34 0 0
Table 4(a): Coefficients of Equation (3) for notches
Angle of swing
(θ)
n/w a0 a1 a2 a3 a4 % Degree
of fit
20º
0.40 0 0.325494 -0.02731 0.000787 -7.80E-06
99.31
0.45 0 0.36673 -0.03079 0.000889 -8.82E-06 99.31
0.50 0 0.433551 -0.03643 0.001053 -1.05E-05 99.31
0.55 0 0.503339 -0.04235 0.001228 -1.22E-05 99.30
0.60 0 0.629615 -0.05297 0.001536 -1.53E-05 99.30
Angle of swing
(θ) n/w a0 a1 a2 a3 a4 % Degree
of fit
25º
0.40 0 -0.01929 -0.02163 -0.02619 -0.0349 99.75 0.45 0 0.53562 0.631415 0.73323 0.919344 99.76 0.50 0 -0.04595 -0.05405 -0.06269 -0.07863 99.75
0.55 0 0.001357 0.001592 0.001844 0.002315 99.76
0.60 0 -1.37E-05 -1.61E-05 -1.86E-05 -2.34E-05 99.75
Angle of swing
(θ)
n/w a0 a1 a2 a3 a4 % Degree
of fit
15º
0.40 0 0.206898 -0.01547 0.000391 -3.37E-06 99.54
0.45 0 0.233766 -0.01746 0.000441 -3.80E-06 99.54
0.50 0 0.273978 -0.02049 0.000519 -4.50E-06 99.55
0.55 0 0.320376 -0.02389 0.000602 -5.18E-06 99.54
Table 4(b): Coefficients of Equation (3) for straight cracks
Angle of
swing (θ) c/w a0 a1 a2 a3 a4
% Degree of fit
15º
0.404 0 0.02098445 0.024079 0.02884 0.033512 99.62
0.454 0 0.27405996 0.32138 0.384437 0.450627 99.63
0.504 0 -0.0200836 -0.02361 -0.02826 -0.0332 99.64
0.554 0 0.00049247 0.000582 0.000696 0.000819 99.65
0.604 0 -4.08E-06 -4.87E-06 -5.80E-06 -6.82E-06 99.66
Angle of swing
(θ)
c/w a0 a1 a2 a3 a4
% Degree
of fit
20º
0.404 0 -0.0281141 -0.03964 -0.04821 -0.05514 99.28
0.454 0 0.42572449 0.509346 0.610286 0.710893 99.25
0.504 0 -0.0344985 -0.04247 -0.05095 -0.05888 99.27
0.554 0 0.00094277 0.001218 0.001464 0.001666 99.26
0.604 0 -8.69E-06 -1.20E-05 -1.45E-05 -1.60E-05 99.23
Angle of swing
(θ) c/w a0 a1 a2 a3 a4
% Degree
of fit
25º
0.404 0 -0.0250322 -0.02888107 -0.0208 -0.0397 99.72
0.454 0 0.63589612 0.74427354 0.781168 1.04268 99.72
0.504 0 -0.0543508 -0.0635712 -0.06056 -0.08914 99.71
0.554 0 0.00159721 0.001865633 0.001552 0.002619 99.94
Table 5(a): Peak DSIF Values for Straight Cracks
Table 5(b): Peak DSIF Values for Notched Cracks
Angle of swing
(θ)
n/w = 0.40
n/w = 0.45
n/w = 0.50
n/w = 0.55
n/w = 0.60
15 0.894593629
1.012433463
1.188172974
1.3898071
1.7414365
20 1.218493144
1.371960793
1.6211522
1.8810228
2.3537862
25 1.754004231
1.978457466
2.338399764
2.7176126
3.404011
Angle of swing
(θ)
c/w = 0.404
n/w = 0.454
n/w = 0.504
n/w = 0.554
n/w = 0.604
15
1.04142684 1.205366563
1.410465898
1.6857623
1.9717445
20
1.41152964 1.640655171
1.914365484
2.2907159
2.6840128
25
2.03367855 2.354486702
2.757420928
3.1590795
3.8605894
Impact on TPB Specimen
DAS thru’ Load-Cell and OROS
Input Load File Generation for ANSYS
Generation of Geometric
Information for TPB specimen Computation through ANSYS
Results Validation
Computation of final results and analysis
(a) (b)
Fig 2: (a) The Quarter Point (QP) element used around the high stress zone near the crack tip, (b) meshing of beam specimen using triangular elements in ANSYS
0.0
0.4
0.8
1.2
1.6
0
0.2
0.4
0.6
0.8
Bohme and Kalthoff
(1982)
Present calc.
DSIF
Time (ms)
Fi
g 4: Comparison of the present numerical prediction with the experimental data of Bohme and Kalthoff [3]0.0 0.5 1.0 1.5 2.0 2.5
0.0 10.0 20.0 30.0 40.0
c/w = 0.404
c/w = 0.454
c/w = 0.504
c/w = 0.554
c/w = 0.604
Fig 5(a): Variation of DSIF with time for a specimen having straight crack for swing angle (θ) = 150
0.0 1.0 2.0 3.0 4.0
0.0 10.0 20.0 30.0 40.0
c/w = 0.404 c/w = 0.454 c/w = 0.504
c/w = 0.554 c/w = 0.604
Fig 5(b): Variation of DSIF with time for a specimen having straight crack for swing angle (θ) = 200
0.0 1.0 2.0 3.0 4.0 5.0
0.0 10.0 20.0 30.0 40.0
c/w = 0.404 c/w = 0.454
c/w = 0.504 c/w = 0.554
c/w = 0.604
Fig 5(c): Variation of DSIF with time for a specimen having straight crack for swing angle (θ) = 250
DSIF
0.0 0.8 1.6 2.4 3.2
0.0 10.0 20.0 30.0 40.0 n/w = 0.40 n/w = 0.45 n/w = 0.50 n/w = 0.55 n/w = 0.60
Fig 6(a): Variation of DSIF with time for a specimen having notch with pre- crack for swing angle (θ) = 150
0.0 1.0 2.0 3.0 4.0
0.0 10.0 20.0 30.0 40.0 n/w = 0.40
n/w = 0.45 n/w = 0.50 n/w = 0.55 n/w = 0.60
Fig 6(b): Variation of DSIF with time for a specimen having notch with pre- crack for swing angle (θ) = 200
DS
IF
D S I F
m a x 0.0 1.0 2.0 3.0 4.00.0 10.0 20.0 30.0 40.0
n/w = 0.40 n/w = 0.45 n/w = 0.50 n/w = 0.55 n/w = 0.60
Fig 6(c): Variation of DSIF with time for a specimen having notch with pre- crack for swing angle (θ) = 250
0.0 1.0 2.0 3.0 4.0 5.0
10.0 15.0 20.0 25.0 30.0
c/w = 0.404 c/w = 0.454 c/w = 0.504 c/w = 0.554 c/w = 0.604
Fig 7(a): Temporal Variation of maximum value of DSIF for a specimen having a straight crack.
D S I F
m a x8. Acknowledgments
We acknowledge sincere help to the staff members of Mechanical Engineering Dept. & SBSE, Jadavpur University, Kolkata. One of the authors (M.K. Barai) sincerely acknowledges constant support from the HOD, Director and Principal of Future Institute of Engineering and Management.
“References”
[1] Anderson, T.L.: Fracture Mechanics: Fundamentals and Application, CRC Boca Raton, 1995.
[2] Barsoum R.S.: Triangular quarter- point elements as elastic and perfectly plastic crack tip elements. International Journal for Numerical methods in Engineering. 11, 85 98 (1977).
[3] Bohme W, Kalthoff JF.: The behavior of notched bend specimens in impact testing. International Journal of Fracture. 20(4), 139 143 (1982).
[4] Chen Y.M.: Numerical computation of dynamic stress intensity factors by a Lagrangian finite-difference method. Engineering Fracture Mechanics. 7(4), 653 660 (1975).
[5] Enderlein, M., Ricoeur, A.,Kuna, M.: Comparison of finite element technique for 2D and 3D crack analysis under impact loading. International Journal of Solids and Structures. 40(13-14), 3425 3437(2004).
[6] Isida M.: Effect of width and length on stress intensity factors of internally cracked plates under various boundary conditions. International Journal of fracture. 7, 301 316 (1971).
[7] John R.: Stress intensity factor and compliance solutions for eccentrically loaded single crack geometry. Engineering Fracture Mechanics. 58, 87 96, (1997).
0.0 1.0 2.0 3.0 4.0
10.0 15.0 20.0 25.0 30.0
n/w = 0.40 n/w = 0.45 n/w = 0.50 n/w = 0.55 n/w = 0.60
[8] John R. and Rigling B.: Effect of height to width ratio on K and CMOD solutions for a single edge cracked geometry with clamped ends. Engineering Fracture Mechanics. 60, 147 156 (1998).
[9] Kishimoto K., Aoki S. Sakata M.: Dynamic stress intensity factors using J-integral and finite element method. Engineering Fracture Mechanics. 13(2), 387 394 (1980).
[10] Maity S. Sarkar B.K: Impact fatigue of porcelain ceramic. International Journal of Fatigue. 17(2), 107 109 (1995).
[11] Newman Jr. J.C., Haines J.M.: Verification of Stress intensity factors for various middle crack tension tests specimens. Engineering Fracture Mechanics. 72, 1113 1118 (2005).
[12] Peng D., Wallbrink C., Jones R.: Stress intensity factor solutions for finite body with quarter elliptical flaws emanating from a notch. Engineering Fracture Mechanics. 72, 1329 1343 (2005).
[13] Rokach I. V.: On the numerical evaluation of the anvil force accurate dynamic stress intensity factor determination. Engineering Fracture Mechanics. 70, 2059 2074 (2005).
[14] Rokach I. V.: Estimation of the three-dimensional effects for the impact fracture specimen. Arch Mech Engg. 43(2-3), 241 252 (1996). [15] Rokach I.V.: Mixed numerical-analytical approach for dynamic one point bend test modeling. International journal of fracture. 130,
193 200 (2004).
[16] Sinclair G. B.,Messner T. W., Meda G.: Stress intensity factors for deep cracks in bending. Engineering Fracture Mechanics. 55 (1), 19 24 (1996).