Department of Electrical & Electronics Engineering, Kakatiya Institute of Technology & Science, Warangal, Telangana State, India.
K. Ashoka Reddy
Department of Electronics & Communication Engineering, Kakatiya Institute of Technology & Science, Warangal, Telangana State, India.
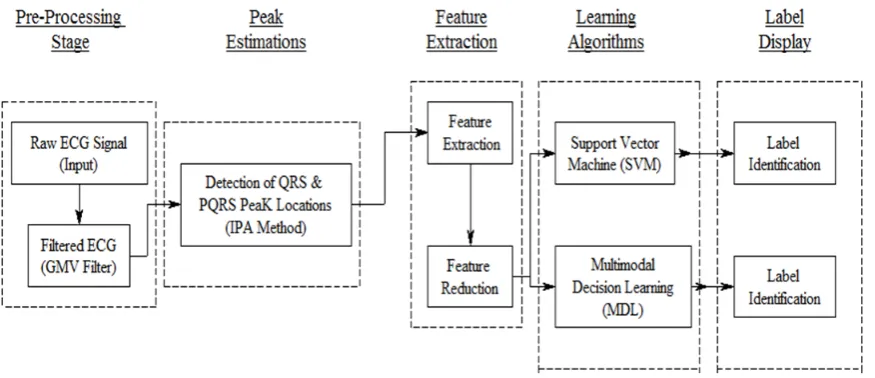
Abstract —Electrocardiogram (ECG) signal is an electrical manifestation of contractile activity of the heart. For analysis of ECGs, it is desirable to classify the obtained signal accordingly for suitable diagnosis. Many challenges have been identified by various researchers in processing, analyzing and classifying ECG signals. This paper proposes a multimodal decision learning (MDL) algorithm for classification and arrhythmia identification. The features are extracted using Integrated Peak Analyzer is used and Intensity Weighted Fire-Fly Optimization is employed for feature reduction process. In post-processing stage, proposed MDL algorithm is employed for ECG classification and label identification. Six classes of ECG functions indicating different functioning conditions like Normal Sinus Rhythm (NSR), Ventricular Tachycardia (VT), First Degree AV Block (FDB), Supraventricular Tachycardia (SVTA), Atrial Fibrillation (AF), Ventricular Flutter (VF). The efficacy of the method is established by comparing it with the SVM based classifier. The metrics used for comparison include confusion matrix (CM), false rejection ratio (FRR), false acceptance ratio (FAR), global acceptance ratio (GAR), Kappa coefficient (KC), sensitivity, specificity and accuracy.
Keywords — ECG, Classification, Artificial Neural Networks, Adaptive Neuro-Fuzzy Algorithm, Multimodal Decision Learning Algorithm, Soft-Computing Techniques, Arrythmia.
I. INTRODUCTION
The abnormalities of heart result in its malfunctioning and are reflected as changes in the electrocardiogram (ECG) signal morphology [1]-[4]. The artifacts such as power line interference, electrode contact noise, baseline drift and motion artifacts will affect the signal quality leading to increased complexity in determining the critical condition of any patient. To eliminate these noises various algorithms were proposed as discussed in [5]-[7]. In this work Gaussian mean variant filtering technique [8] is used to obtain a clean ECG signal. For processing any signal using machine learning algorithms it is essential to select and extract features which increases capability of the training algorithm to classify the given signal accurately. In this work, feature selection and extraction is done by using Integrated Peak Analyzer method [9]. Feature extraction process is carried based on the estimation of peaks of QRS and PQRS locations. A feature set of 33 attributes were selected using peak analyzer method.
Fig.1 Fire-Fly particles II. METHODOLOGY
The major objective of this work is to propose a new method for classification of electrocardiogram signal called Multimodal Decision Learning (MDL) algorithm for detecting conditions of the heart like Normal Sinus Rhythm[11], Ventricular Tachycardia[12], Supraventricular Tachycardia[13], Atrial Fibrillation[11], First Degree AV Block [14] and Ventricular Flutter[15]. Tovalidate the results of the proposed method, the obtained results are compared with the existing methods in terms of confusion matrix, accuracy, precision and the other parameters as indicated. The working flow graph for the proposed work is shown in fig.2.
Fig 2. Flow Graph of the proposed work
A. Multimodal Decision Learning
After selection of the best features from the set of all extracted features, here we propose a learning mechanism with the help of a novel kernel model for classifying the category as NORMAL or ABNORMAL. This is done by using Multimodal Decision Learning Classification method.
Let ‘Lt’ be the size of the feature dataset where t=1,2,3,………..and let the training data be Tr.
After initializing row size and column size of the feature dataset, let the first feature be
1
1 r t( , )
L =T L x y− +O
(8) where O is defined as offset parameter.
Now let us define a kernel function
φ
(
x
)
for linear to non-linear mapping. For the total dataset size, define))
(
rRC
Lb
PT
Rt
=
(11)where R is the classified result.
III. RESULTS AND DISCUSSIONS
Experimental results are carried out by simulating soft-computing techniques as mentioned earlier. The training for both the methods is done for 35 ECG records collected from MIT-BIH database. The sampling frequency is 360Hz consisting of 2000 beat annotations with a recorded sample of about 30 mins. In this work, 35 records were used, each record consisting of 500 samples. A set of six classes derived for 35 records from MIT-BIH database like 100,101,102,103,104,105,……234 respectively from the arrhythmia database to indicate the selected class labels. After the pre-processing stage, the basic classification is indicated by a dialogue box as shown in fig.3 as normal or abnormal. If the given signal is normal then the label prediction box will display it as Normal else it indicates the appropriate disease among the selected classes.
Fig 3. Dialogue box indicating signal as normal
The obtained results of the proposed method are compared with the well known SVM based classifier [16]-[17]. Figure 4(a) through 4(h) depict the comparative analysis of the proposed multimodal decision learning algorithm and SVM based classifier in terms of the selected parameters like FRR, FAR, GAR, ROC, Sensitivity, Selectivity, Accuracy, TP, TN, FP AND FN.
Fig 4(b): Filtered ECG Signal
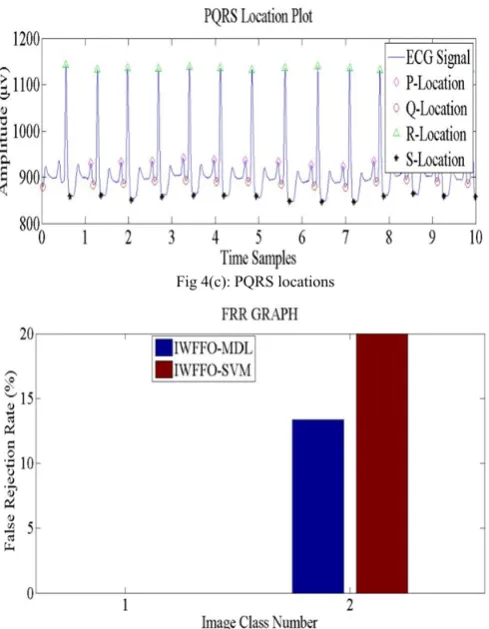
Fig 4(c): PQRS locations
Fig 4(d): False Rejection Ratio (FRR)
Fig 4(f): Global Acceptance Ratio (GAR)
Fig 4(g): ROC for Classification
Fig 4(h): Fitness Plot
Fig.4 Results of MDL on comparison with SVM. a)Input ECG signal, b)Filtered ECG, c) PQRS Location plot, d)FRR Graph, e)FAR Graph, f)GAR Graph, g) Receiver Operator Characteristics, (h) Fitness Plot.
Result Analysis
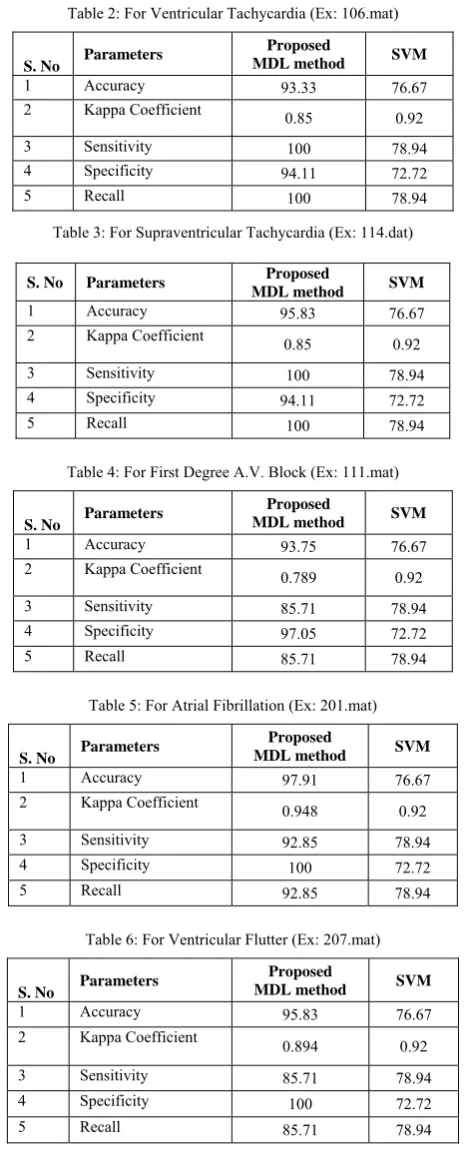
The comparative analysis for all the three soft-computing techniques by considering six class labels are tabulated for various ECG records with reference to the parameters like Sensitivity, Specificity, Recall, Kappa Coefficient and Accuracy as shown in the tables 1 through 6. Preliminary results confirm the validity of the
proposed method. Work is on to further enhance the algorithm.
Table 1: For Normal Sinus Rhythm (Ex: 105.mat)
S. No Parameters Proposed
MDL method SVM
1 Accuracy 93.33 76.67
2 Kappa Coefficient 0.85 0.92
3 Sensitivity 100 78.94
4 Specificity 94.11 72.72
Table 2: For Ventricular Tachycardia (Ex: 106.mat)
S. No Parameters
Proposed
MDL method SVM
1 Accuracy 93.33 76.67
2 Kappa Coefficient 0.85 0.92
3 Sensitivity 100 78.94
4 Specificity 94.11 72.72
5 Recall 100 78.94
Table 3: For Supraventricular Tachycardia (Ex: 114.dat)
S. No Parameters Proposed
MDL method SVM
1 Accuracy 95.83 76.67
2 Kappa Coefficient 0.85 0.92
3 Sensitivity 100 78.94
4 Specificity 94.11 72.72
5 Recall 100 78.94
Table 4: For First Degree A.V. Block (Ex: 111.mat)
S. No Parameters
Proposed
MDL method SVM
1 Accuracy 93.75 76.67
2 Kappa Coefficient 0.789 0.92
3 Sensitivity 85.71 78.94
4 Specificity 97.05 72.72
5 Recall 85.71 78.94
Table 5: For Atrial Fibrillation (Ex: 201.mat)
S. No Parameters
Proposed
MDL method SVM
1 Accuracy 97.91 76.67
2 Kappa Coefficient 0.948 0.92
3 Sensitivity 92.85 78.94
4 Specificity 100 72.72
5 Recall 92.85 78.94
Table 6: For Ventricular Flutter (Ex: 207.mat)
S. No Parameters
Proposed
MDL method SVM
1 Accuracy 95.83 76.67
2 Kappa Coefficient 0.894 0.92
3 Sensitivity 85.71 78.94
4 Specificity 100 72.72
5 Recall 85.71 78.94
IV. CONCLUSIONS
[4] Shubhada Ardhapurkar, Ramchandra Manthalkar, Suhas Gajre, “Interpretation of normal and pathological beats using multi-resolution wavelet analysis”, Computing in Cardiology (CinC), IEEE, 9-12 Sept. 2012.
[5] Mostafa Guda, Safa Gasser, “MATLAB Simulation Comparison for Different Adaptive Noise Cancelation Algorithms”, the SDIWC in
2014.
[6] Sarita Mishra, Debasmit Das, Roshan Kumar and Parasuraman Sumathi, “A power-line intereference canceler based on sliding DFT Phase
locking scheme for ECG signals”, IEEE Transactions on Instrumentation & Measurement, Vol.64, No.1, Jan 2015.
[7] Prakruti J.joshi, Vivek P.Patkar, “ECG denoising using MATLAB” Int. Journal of Scientific & Engineering Research, May-2013.
[8] Venkata Rami Reddy.D, Abdul Rahim.B, Fahimuddin.Shaik, “ Gaussian Noise Filtering From ECG Signal Using Improved Kalman
Filter”, International Journal of Engineering Research and Reviews, Vol. 3, Issue 2, pp: (118-126), Month: April - June 2015.
[9] Ajay Bharadwaj and Umanath Kamath, “Techniques for accurate ECG signal processing”, EE Times, Feb. 2011.
[10] Michael Alb, Piergiorgio Alotto1, Christian Magele, Werner Renhart, Kurt Preis and Bernhard Trapp, “Firefly Algorithm for Finding
Optimal Shapes of Electromagnetic Devices”, IEEE Transactions On Magnetics, Vol. 52, No.3, March 2016.
[11] U Maji, M Mitra, S Pal, “Differentiating normal sinus rhythm and atrial fibrillation in ECG signal: A phase rectified signal averaging
based approach”, International Conference on Control, Instrumentation, Energy and Communication (CIEC), IEEE, 31 Jan.-2 Feb. 2014.
[12] Atiye Riasi, Maryam Mohebbi, “Prediction of ventricular tachycardia using morphological features of ECG signal”, International
Symposium on Artificial Intelligence and Signal Processing (AISP), IEEE, 3-5 March 2015, 2015.
[13] Amos Katz, Guy Amit, Yaniv Zigel, “Supraventricular Tachycardia Classification in the 12-Lead ECG using Atrial Waves Detection and
a Clinically Based Tree Scheme”, IEEE Journal of Biomedical and Health Informatics ( Issue: 99 ), 2015.
[14] Deshpande Nivedita; Thakur Kavita; A. S. Zadgaonkar, “ First degree heart block determination from speech analysis”, International Conference on Signal Processing , Image Processing & Pattern Recognition, IEEE, 2013
[15] Gustavo Lenis; Tobias Oesterlein; Dan-Timon Rudolph; Olaf Dössel, “ Orthogonal component analysis to remove ventricular far field in
non periodic sustained atrial flutter”, IEEE Computing in Cardiology Conference (CinC), Pages: 669 – 672, 2015.
[16] Narendra Kohli* and Nishchal K. Verma, “Arrhythmia classification using SVM with selected features”, International Journal of
Engineering, Science and Technology, Vol. 3, No. 8, 2011, pp. 122-131.
[17] F Alonso-Atienza, E Morgado, L Fern´andez-Mart´ınez, A Garc´ıa-Alberola, JL Rojo-A´ lvarez, “Combination of ECG Parameters with
Support Vector Machines for the Detection of Life-Threatening Arrhythmias”, Computing in Cardiology, 2012; vol.39, pages 385-388..