STUDY OF DRAPE PARAMETER
USING IMAGE ANALYSIS
THOURAYA HAMDI
University of Monastir, National Engineering School, Thermal and Energetic Systems Studies Laboratory Ibn Aljazzar Street, Monastir 5019, Tunisia
ADEL GHITH
University of Monastir, National Engineering School, Textile departement Ibn Aljazzar Street, Monastir 5019, Tunisia
FATEN FAYALA
University of Monastir, National Engineering School, Thermal and Energetic Systems Studies Laboratory Ibn Aljazzar Street, Monastir 5019, Tunisia
Abstract :
The measurement of drape is currently carried out by manual methods based on a calculation of a surface after projection of a certain number of rays or on the cutting of a shade of a draped fabric shadow and to weigh. These techniques are long and fastidious. The technological developments can improve these procedures to make them especially faster and easier. In this paper, we present the measurement of drape coefficient by an image analysis method which is based on numerical calculation. A comparative study is made between results obtained by classical methods and the new method developed. The results show that the new method is accurate, strong correlated with classical methods, very faster and more easy.
Keywords: Fabric drape; image analysis; drape coefficient.
1. Introduction
Fabric drape is an important parameter for the aesthetic appearance of fabrics. It has an exceptional effect on the formal beauty of fabric. It shows a characteristic often taken into account in the choice of a fabric for its use. A choice, which can generate defects, leads sometimes to no feasibility of the model, due to nonconformity between the style and the real drape. In fact, the study of the drapability of fabrics makes it possible to lay down its capacity to be deformed and thus its aptitude to be harmonized with the body with which it is in contact.
2. Bibliographical study
The evaluation of drape was at the beginning subjective, structured objective investigation of fabric drape behavior can be traced back to a classic paper authored by Peirce [ Peirce., 1930]. Peirce developed the cantilever bending tester wich was used indirectly in the determination of drape and primarily for the evaluation of bending length. It is noted that the fabric at the time of drape was subjected to a bending test. Therefore he concluded that drape can be appreciated indirectly starting from the evaluation of flexibility. The cantilever method is considered simple and reproductible, it is able only to describe the two-dimensional behavior of the fabrics whereas drape is a three-dimensional phenomenon. Therefore other methods of measurement were introduced to determine the three-dimensional drape.
A significant contribution to the practical evaluation of a three-dimensional fabric drape was the development of a F.R.L drapemeter by Chu et al [Chu et al., 1950]. They quantified the drapability of a fabric into a dimensionless value called “drape coefficient”, which is defined as the percentage of the area from an angular ring of the fabric covered by a vertical projection of the draped fabric.
This instrument was improved thereafter by Cusick [ Cusick., 1968], which investigated the experimental method by using a parallel light source that reflects the drape shadow of a circular specimen from hanging disc into a piece of ring paper to calculate drape coefficient.
characterize objectively the static and dynamic drape behaviour. Those parametrs are: the average of the maximum fold’s lengths, ρmax, the average of the minimum fold’s depths, ρmin, and the parameter S indicating the distribution of the folds.
All these methods have several disadvantages, they are long and tracing of the pattern by hand is highly dependent on the skill of the operator, the mass variation in the paper or presence of wrinkles to wet treatment may cause error in the calculation of drape coefficient. Therefore, more reliable and meaningful methods to measure the drape coefficient are necessary.
The method of image processing is a useful method; which makes it preferable to the traditional measuring method, whereas the results obtained when using the cut- and -weigh method are subjective because the drawing and cutting are influenced by the laboratory assistant. It avoids the disadvantages of reliability during the visual evaluation of fabric surface. Inter alia, we can find some disadvantages for example the quality of the images and its effect on the found values. An instrument based on image processing technique has been developed to calculate the drape coefficient of fabrics samples.
3. Materials and methods
In this section, we introduce the materials and methods used in this investigation.
3.1. Materials
Fifty-five samples of different fabrics are examined having two different weaves, plain weave and twill weave. We note that with each fabric, we worked with three different diameters 24cm, 30cm and 36cm.
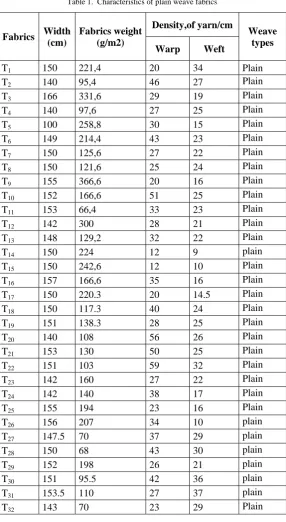
Table 1. Characteristics of plain weave fabrics
Fabrics Width (cm)
Fabrics weight (g/m2)
Density,of yarn/cm
Weave types Warp Weft
T1 150 221,4 20 34 Plain
T2 140 95,4 46 27 Plain
T3 166 331,6 29 19 Plain
T4 140 97,6 27 25 Plain
T5 100 258,8 30 15 Plain
T6 149 214,4 43 23 Plain
T7 150 125,6 27 22 Plain
T8 150 121,6 25 24 Plain
T9 155 366,6 20 16 Plain
T10 152 166,6 51 25 Plain
T11 153 66,4 33 23 Plain
T12 142 300 28 21 Plain
T13 148 129,2 32 22 Plain
T14 150 224 12 9 plain
T15 150 242,6 12 10 Plain
T16 157 166,6 35 16 Plain
T17 150 220.3 20 14.5 Plain
T18 150 117.3 40 24 Plain
T19 151 138.3 28 25 Plain
T20 140 108 56 26 Plain
T21 153 130 50 25 Plain
T22 151 103 59 32 Plain
T23 142 160 27 22 Plain
T24 142 140 38 17 Plain
T25 155 194 23 16 Plain
T26 156 207 34 10 plain
T27 147.5 70 37 29 plain
T28 150 68 43 30 plain
T29 152 198 26 21 plain
T30 151 95.5 42 36 plain
T31 153.5 110 27 37 plain
Table 2. Characteristics of twill weave fabrics
Fabrics Width (cm)
Fabrics weight (g/m2)
Density of yarn/cm Weave types Warp Weft
Se1 140 105 57 27 Twill
Se2 150 187,3 41 19 Twill
Se3 149 231,2 70 40 Twill
Se4 149 175,6 20 21 Twill
Se5 147 238,4 49 34 Twill
Se6 160 263,2 18 21 Twill
Se7 160 151,2 67 25 Twill
Se8 154 330 38 21 Twill
Se9 165 218 42 36 Twill
Se10 157 137,6 30 41 Twill
Se11 148 340 24 43 Twill
Se12 151.5 184 22 23 Twill
Se13 150 110.6 29 12 Twill
Se14 150 175.5 29 24 Twill
Se15 149 184.5 31 24 Twill
Se16 150 65 36 31 Twill
Se17 154 78 77 26 Twill
Se18 155 280 22 17 Twill
Se19 150 162 35 30 Twill
Se20 150 85 57 30 Twill
Se21 152 266 29 22 Twill
Se22 158 130 47 32 Twill
Se23 162 167 52 36 Twill
3.2. Methods
In this paper, we started with the calculation of the coefficient of drape by the two conventional methods, the method of "cut and weigh" and the method of "drapemeter ". We obtained very good values of correlation (0.97, 0.96 and 0.98) respectively for the three diameters used, 24cm, 30cm and 36 cm. We concluded that the use of one or the other method is possible to have almost the same results.
These traditional methods used with Cusick drapemeter or drape-O-meter are long. Errors are frequent in drawing the layout of projected contours and consequently the drape coefficient calculated can be subjected to significant error.
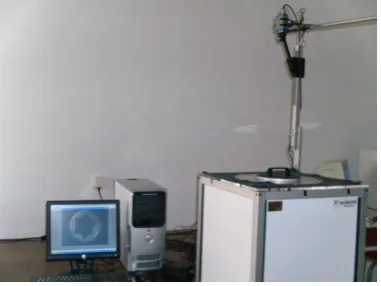
The installation of an automatic procedure based on the image processing can improve this measurement technique and give it more precision and more achievement quickness.
The apparatus allows the frame grabbing of the fabric test-tube of diameter 24, 30 or 36 cm supported on a disc of diameter 18cm.
A lamp is enlightened, it throws the light on the concave mirror placed at the lower part. The considered light of the mirror would be rays and this gives an exact shade of fabric drape.
To collect the image without bottom, a thin paper of uniform density was placed on the lid. The camera, is placed in top to entirely collect the paper crown. After few minutes, the contour of the fabric is projected on the paper and the obtained image is recorded in the computer to be treated by a software.
(The study related to test-tubes of 33 fabrics diameter 24cm, 30cm and 36 cm diameter.) The collected image is transformed into a level of gray with an interesting affinity of adjustment of the value threshold to the interface of the system so that the quality of the image is not influenced by the color of fabric.
We begin the software treatment by capturing an original image (Fig.2) by the camera.
Fig. 2. The original Image
The original image is made up of three basic colors red, green and blue as shown in the figure 3(Fig.3).
Fig. 3. The distribution of the colors
In the color images each point requires several bits to be stored. For example, the images occupy at least 24 bits per point, they are real vectors, for an image color RGB three values indicate for each pixel the intensity of the colors red, green, and blue [Gilles, 2001].
After, the original image is transformed to a Gray level image (fig.4) in order to make easier the calculation of the parameters.
Fig. 4. The gray Level image
Image originale
0 100 200 300 400 500 600 700
60 80 100 120 140 160 180 200 220
Distance along profile
Fig. 5. The distribution of the gray Level
The images carried out in gray level use the gray colors energy of the white to the black, the number of gray levels depends on the number of bits used to describe the color of each pixel of the image, more this number is significant, better is quality, but more the size of the image increases [Gilles, 2001]. According to the type of material and the used application, the representation of the gray levels to the screen or the printer is carried out using true gray levels, which correspond to the various colors of a black and white photograph, are appeared as a whole of tiny points of variable size, but regularly laid out, so that the eye tends to melt them in a continuous gray [Gilles, 2001].
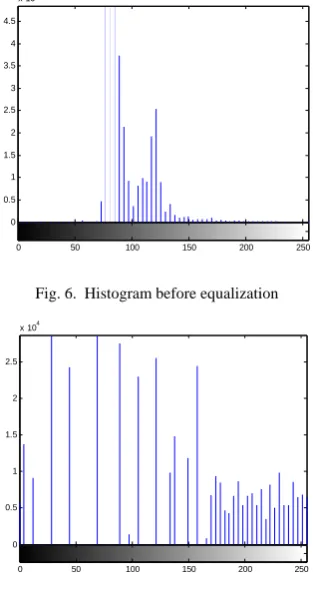
In Fig.6, each pixel is coded by the component included in the broad sense between 0 and 255, representing the luminosity of the pixel.
It consists in preparing an image for the treatments of higher level. It mainly consists in improving visual quality of an image which can be disturbed by the sensors of acquisition.
Fig. 6. Histogram before equalization
Fig. 7. Histogram after equalization
The equalization of the histogram allows the distribution of the number of pixel in the same way. The research of the threshold value is very important because it make the operation of calculation more easy.
In this stage, we use the method of OTS' U which is considered as the best methods to determine the value of thresh in a gray level image to obtain finally a binary image.
But, we obtain a binary image which contains some noise.
0 100 200 300 400 500 600 700
60 80 100 120 140 160 180 200 220
Distance along profile
0 50 100 150 200 250
0 0.5 1 1.5 2 2.5 3 3.5 4 4.5
x 104
0 50 100 150 200 250
0 0.5 1 1.5 2 2.5
The operation chosen in this case is the image filtering (fig.8) using both low-pass filter and high-pass filter. Filtering makes it possible to eliminate the aberrant points and any defect recorded in the image. The essential objective is to obtain a clear image (fig.9).
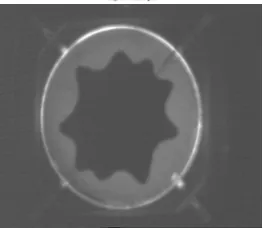
After the stage of filtering, we select the final form of the drape as shown in fig.10.
Fig. 10. The final form of drape
Then we obtain the final structure of drape, we begin in the stage of calculating the drape coefficient. The program makes the correlation between pixel and centimetre.
The drape coefficient is computed using the following formula:
DC = * 100
Where,
DC : the drape coefficient
c : the correlation between the centimetre and the pixel. Disc surface = pi* (supported disc ray *c)2
4. Results and discussion
We present in the continuation an analysis detailed on the various results found by the analysis method as well as the correlation of the values with the conventional methods.
To validate our program, we choose to compare the results given by two methods (image analysis and “cut and weigh method”.
In this work, three different diameters are studied: The diameter 24cm (fig.11.)
Image binaire sans filtre Filitre Image binaire avec Filitre
(Total ray (cm)כ ܿ) 2 * ߨ – (supported disc ray (cm)כ ܿ) 2 * ߨ Drape surface (pixel) – (supported disc ray (cm)כ ܿ) 2 *
ߨ
Fig. 11. The correlation between DC24.num and F24 The diameter 30 cm (fig.12.)
Fig. 12. The correlation between DC30.num andF30 The diameter 36cm (fig.13.)
Fig. 13. The correlation between DC36.num andF36
The values of correlation obtained for the two diameters 30cm and 36cm are respectively 0.92 and 0.91. In our case, we can say that the values found are considered excellent. On the other hand, for the diameter 24cm, the correlation coefficient is a little low since we generates in this case of the a little fuzzy images.
This is with the fact that by choosing 24 cm like diameter of the test-tube for 18 cm diameter of the support disc, we do not leave with fabric enough surfaces so that the falling effect is clear.
y = 1.3702x ‐0.3357 R² = 0.7436
0.4 0.5 0.6 0.7 0.8 0.9 1 1.1
0.4 0.5 0.6 0.7 0.8 0.9 1
DC
24num
F24
y = 1.2435x ‐0.1311 R² = 0.9241
0.2 0.3 0.4 0.5 0.6 0.7 0.8 0.9 1
0.2 0.3 0.4 0.5 0.6 0.7 0.8 0.9 1
DC
30num
F30
y = 0.9356x + 0.0249 R² = 0.9165
0.1 0.2 0.3 0.4 0.5 0.6 0.7 0.8
0.1 0.2 0.3 0.4 0.5 0.6 0.7 0.8
DC
36num
It is a step which has, not only allowed curing the encountered problems when we work with the conventional technique but especially open some new horizons of research in the field of the experimental evaluation of fabric drape. The principle is to build a data base of the fabrics drape images from which we can extract not only the value from the drape coefficient, parameter which can considered to be like insufficient characterizing a fabric drape but also of other interesting information such as the number of nodes constituting the projection of the fabric surface, which is more significant. We can also add the variations in the course of the time of the two parameters and we can in formations about stability in time of fabric drape.
4. Conclusion
We made modifications on the system of Cusick drapemeter by the addition of an achievable application under MATLAB allowing calculating the drape coefficient.
In this paper, we used Image analysis to calculate the real surface of the drape in order to determine the numerical drape coefficient. This method is based on the passage by the original color image, to gray level image and finally to the binary one. The method of image processing for measurement fabric drape is characterized by the precision, faster makes multiple measurements.
The system of image processing was developed in order to cure the problems encountered with the conventional technique. The images analysis techniques can make it possible to determine other parameters of drape such as the number of nodes, the folds depth index. Because this model envisaged a very good correlation, studying the effect of some parameters on the drape will also form the subject of following research.
References
[1] Pierce, F.T. (1930).The Handle Cloth as a Measurable Quantity. Journal Textile Institute, vol 21, 377-417.
[2] Chu, C. C., Cummings, C. L., & Teixeira, N. A. (1950). Mechanics of Elastic Performance of Textile Materials: Part V: A Study of the Factors Affecting the Drape of Fabrics—The Development of a Drape Meter. Textile Research Journal, 20 (8), 539-548.
[3] Cusick, G.E, The measurement of fabric drape, Journal Textile Institute, 59(1968) T253.
[4] Hu J. (1997).A review on the study of fabric drape, PartI: Evaluation methods and empirical study, JHKITA , 126-136.
[5] Chu, C., Platt, M.M., and Hamburger, W.J. (1960). Investigation of the Factors affecting the drapeability of Fabrics. Textile Research Journal 30, 66-75.
[6] G. k. Stylios and R. Zhu. (1997). The characterisation of the static and dynamic drape of fabrics, Journal Textile Institute 88, 465-475. [7] Gilles Burel (2001), Introduction au traitement d’images, simulation sous Matlab, Hermes-Science, ISBN 2-7462-0323-5.
[8] Akio Sakaguchi., Hyungsup Kim.,Yo-Ichi Matsumoto and Koichiro Toriumi. (2000). Woven Fabric Quality Evaluation Using Image Analysis, Textile Research Journal 70 (11), 950-956.
[9] Y. J. Yeong. (1998).A Study of Fabric-Drape behavior with Image Analysis, Part I: Measurement, Characterization, and Instability, Journal Textile Institute 89, 59-69
[10] Narahari Kenkari and Tracy May-Plumlee. (2005). Fabric drape measurement: a modified method using digital image processing, J text and Appareal, technology and measurement 4, 1-8
[11] B. k. Behera and Ajit Kumar Pattanayak.. (2008).Measurement and Modeling of Drape Using Digital Image Processing, Indian J of Fibre and Text Res 33, 230-238