Lincoln
University
Digital
Thesis
Copyright
Statement
The
digital
copy
of
this
thesis
is
protected
by
the
Copyright
Act
1994
(New
Zealand).
This
thesis
may
be
consulted
by
you,
provided
you
comply
with
the
provisions
of
the
Act
and
the
following
conditions
of
use:
you
will
use
the
copy
only
for
the
purposes
of
research
or
private
study
you
will
recognise
the
author's
right
to
be
identified
as
the
author
of
the
thesis
and
due
acknowledgement
will
be
made
to
the
author
where
appropriate
you
will
obtain
the
author's
permission
before
publishing
any
material
from
the
thesis.
Evaluating Cane Pruning Decision Criteria and the Identification of
Grapevine Pruning Styles
A thesis
submitted in partial fulfilment
of the requirements for the Degree of
Master of Science (Horticulture)
at
Lincoln University
by
Andrew Kirk
Abstract of a thesis submitted in partial fulfilment of the
requirements for the Degree of Master of Science (Horticulture).
Abstract
Evaluating Cane Pruning Decision Criteria and the Identification of Grapevine
Pruning Styles
by
Andrew Kirk
Winter pruning is the highest yearly expenditure in the typical New Zealand vineyard budget, yet few attempts have been made to bring quantitative measurement tools into its management. The research presented here constitutes first steps towards this end, in tandem with University of Canterbury researchers working towards an artificially intelligent pruning robot. In pursuit of
information regarding cane pruning preferences and decision-making criteria, a two-part survey was conducted in the regions of Marlborough, Hawke’s Bay, Waipara and Central Otago. Part One of this survey asked participants to rate a set of already-made cane pruning decisions for one (cv.)
Sauvignon Blanc vine. Participants rated these decisions on 24 individual pruning criteria and also provided two overall assessments. One of these overall assessments was recorded before
participants rated the decisions on the 24 individual criteria, and a second overall assessment was recorded after such time. All ratings were collected via Qualtrics software, either online or via the Qualtrics offline survey application. Part Two of the survey asked participants to indicate, with highlighter pens on paper, their own preferred pruning decisions for the same vine.
decision-making criteria calls for further investigation into how pruning is conceptualised as a task. Results from this study suggest that there exists a somewhat broad, non-specific, view of whether or not a particular set of spur and cane selections are acceptable. This finding, while perhaps not immediately impactful for practitioners, has considerable implication for the design of future pruning research, as well as for the evaluation of artificially intelligent pruning.
This research also reports the detection of pruning preference (Part One and Part Two) groups, based on region and organisational role. Correspondence Analysis and Multiple Correspondence Analysis (Part Two) have revealed that participants from Hawke’s Bay and, particularly, Central Otago tended towards a decision to restructure the subject vine by not leaving a spur from its existing right half. This was in contrast to those participants from Marlborough and Waipara who tended towards a maintaining of the current vine configuration. Aside from these differing propensities to restructure the vine, several regions were associated with unique spur and cane selections. It is unclear at present whether regional differences are due to social influences, regional viticulture conditions, cultivar familiarity, or some unknown factor. Participants also differed in their preferences when grouped based upon their organisational role. Those participants identifying exclusively as labourers were considerably less likely to restructure the vine, compared to those participants identifying as supervisors, managers, or proprietors. Managerial implications of this finding are discussed, with several potential remedies explored.
Acknowledgements
Many people, from all corners of the New Zealand grape and wine industry, contributed to this project. I would like to acknowledge these tremendous contributions, both collectively and individually, where possible. Lincoln University, the University of Canterbury Automated Cane Pruning Robot Project, and the Romeo Bragato Trust made this project possible with their
directional, financial, and administrative support. Neither I, nor this project, ever lacked in support, thanks to the contributions of my supervisors, Dr. Valerie Saxton, Dr. Glen Creasy, Dr. Gary Steel, and Dr. Richard Green. Their words of wisdom and sense of proportion made the task of trying to
establish a new type of viticulture research never seem out of reach.
In all, 218 participants took the time to complete the pruning survey. This time commitment ranged anywhere from 5 to 35 minutes per person, which adds up to a staggering amount time collectively spent helping this study. I cannot thank these individuals enough, both for their participation and for their friendliness towards me as a visiting researcher. It goes without saying I will never forget the time spent on the road visiting more than 90 vineyards throughout New Zealand. A special “thank you” goes to those participants (and I’m sure there were a few!) who were not quite convinced about our study, but were polite and friendly all the same. I very sincerely hope the outcome will be of some gratification, given your considerable time investment.
Arranging visits to over 90 vineyards was no minor task, and it could not have been successful without the noteworthy assistance of some industry members. Particular thanks in this regard are owing to Andrew Naylor, Martin Tillard, Glenn Kirkwood, Joanne Brady, Tim Creagh, Dr. Rengasamy Balasubramaniam, Graham Bartleet, and Associate Professor Roland Harrison. I would also like to acknowledge the assistance of Andrew Naylor in working out a template for data collection visits. Likewise, Julian Smith of the Camshorn Vineyard in Waipara was a major influence in the formulation of pruning criteria for the Qualtrics decision ratings part of the survey.
For a few personal notes, I would like to take the opportunity to thank my parents, Jane Kirk and Joseph Kirk for their support of my education over the years. I am often reminded by my Mother that this Master’s thesis actually began at age four when I would walk out to the mailbox every morning for the newspaper, needing to keep up with the latest baseball statistics. In any case, I feel fortunate to have had such supportive family and friends over the years. I would like to conclude with a special thank you to Ashley Cooper, who kept me full of joy and laughter after many long days.
Andrew Kirk
Table of Contents
Acknowledgements ... iv
Table of Contents ... v
List of Tables ... viii
List of Figures ... ix
Chapter 1 Introduction ... 1
Chapter 2 Literature Review... 3
2.1 Part One: A review of relevant statistics and methodologies ...3
2.1.1 Introduction ... 3
2.1.2 Linear Model Building ... 3
Assumptions and Violations ... 3
2.1.3 Group Identification and Differentiation ... 5
2.1.4 Outcome prediction with Logistic Regression ... 7
2.1.5 Scale Construction... 8
2.2 Exploring the Physiological Setting of Cane Pruning ... 10
2.2.1 Introduction ...10
2.2.2 Vine Capacity and Vigour ...10
2.2.3 Climate and Site Selection ...10
2.2.4 Cultural Practices and Vine Vigour ...11
2.2.5 Frost Avoidance ...12
2.2.6 Mitigation of Disease Risk ...13
2.2.7 Differential Bud Fruitfulness ...13
Chapter 3 Materials & Method ... 16
3.1 Pruning Survey Overview ... 16
3.2 Participant Invitation ... 17
3.3 Vine Selection, Pruning, and Photography ... 19
3.4 Participant Identification System ... 20
3.5 Demographic and Background Questions ... 21
3.6 Use of Supplementary Photos ... 21
3.7 Survey Part One: Assessment of Already-Made Pruning Decisions ... 22
3.7.1 Visual format of ratings prompts ...22
3.7.2 Instructions and Assumptions ...23
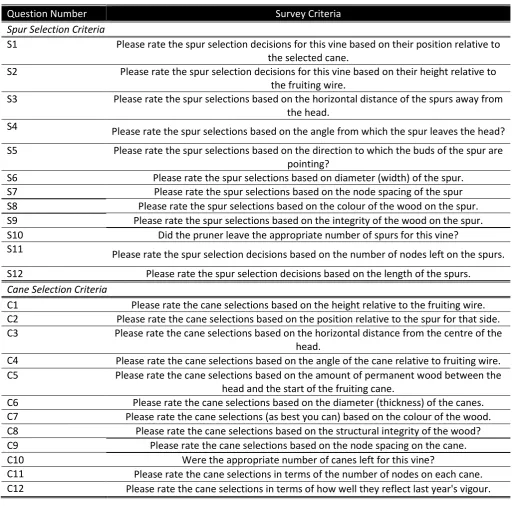
3.7.3 Generation of pruning criteria ...24
3.8 Survey Part Two: Indication of Preferred Decisions ... 25
3.9 Summary of typical vineyard visit protocol ... 26
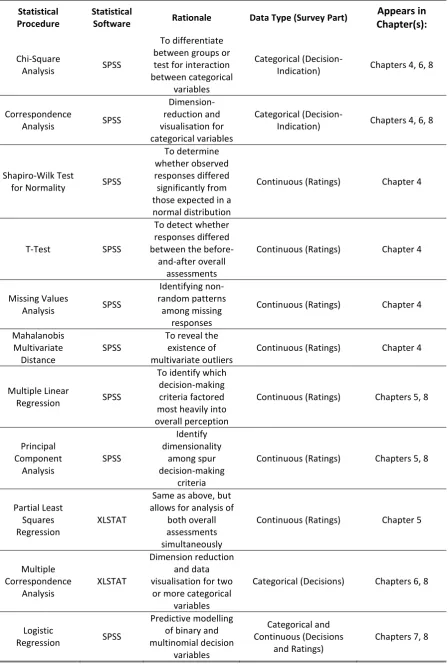
3.10 Data Entry and Statistics ... 27
A Note on Statistical Terminology ... 29
Chapter 4 Results: General Response Profile ... 30
4.1 Pools of Responses ... 30
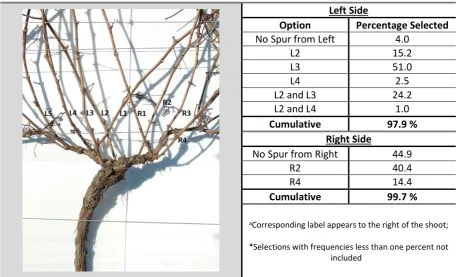
4.2 Decision Preferences... 31
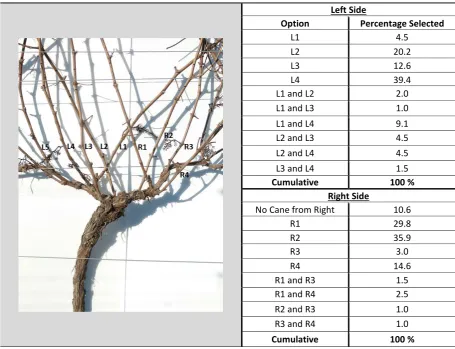
4.2.2 Cane Selection ...32
4.3 Interaction between Spur and Cane Selection ... 33
4.4 Distribution Trends in Qualtrics Ratings ... 34
4.5 Missing Values and Outliers-Redefining Pool C ... 37
4.6 Identification of Outlier Cases ... 38
Chapter 5 Results: Assessment of Pruning Criteria ... 39
5.1 Introduction ... 39
5.2 Linear Models of Pruning Quality ... 40
5.2.1 Background and Procedural Notes ...40
5.2.2 Criteria Selection for the Linear Model ...40
5.3 Model Results ... 41
5.4 Partial Least Squares Regression Model ... 43
5.5 Principle Components Analysis of Pruning Criteria ... 45
5.5.1 Background and Procedural Notes ...45
5.5.2 Results ...46
5.5.3 Implications for Scale Validation ...47
Chapter 6 Results: Group Differentiation ... 50
6.1 Introduction ... 50
6.2 Regional Pruning Preference ... 51
6.3 Organisational Role ... 54
6.4 Experience Level and Pruning Preference ... 56
6.5 Non-significant Predictors of Pruning preference ... 59
6.6 Results of Unmediated Cluster Analysis ... 59
6.6.1 Background Notes ...59
6.6.2 Four Cluster Solution ...59
Chapter 7 Results: Logistic Regression Models of Pruning Decision Probability ... 62
7.1 Introduction ... 62
7.2 Background and Procedural Notes ... 63
7.3 Binary Logistic Model for Right Side Spur Choices... 63
7.4 Multinomial Logistic Model for Right Side Cane Selections ... 65
Chapter 8 Discussion ... 68
8.1 Vine restructuring: a major decision point ... 68
8.2 Options L3, R2, and the attributes of an ideal spur ... 69
8.2.1 Spur Height, Relative to the Fruiting Wire ...69
8.2.2 Spur Angle ...69
8.2.3 Spur Horizontal Position ...70
8.2.4 Bud Direction ...71
8.3 High levels of disagreement foretold criteria significance ... 72
8.4 General Impressions were dominant, and related to position ... 73
8.5 Region as a driver of pruning preference ... 75
8.5.1 Yield and Bud Count ...76
8.5.2 Varietal Familiarity ...78
8.6 Attributes of Organisations and Individuals ... 81
8.6.1 Individual Role within an Organisation ...81
8.6.2 Commercial and Organisational Attributes ...83
8.7 Summary of Discussion Points ... 84
Chapter 9 Discussion of Methodology ... 85
9.1 Introduction ... 85
9.2 Vine Selection: How Many? ... 85
9.3 Survey vine Selection: Which One? ... 86
9.4 Suitability of Presented Pruning Decisions ... 87
9.5 Background Assumptions... 88
9.6 Visual Presentation Format ... 89
9.7 Generation of Ratings Criteria ... 91
9.8 Missing Values in the Qualtrics Survey ... 91
9.9 Methodological Discussion Summary ... 93
Chapter 10 Conclusions ... 94
10.1 Statistical Models for the Importance of Individual Pruning Criteria ... 94
10.2 Assessing the Set of Pruning Criteria and Survey Structure ... 95
10.3 Group Identification and Characterisation ... 95
10.4 Prediction of Pruning Decision Preferences ... 96
10.5 Concluding Remarks... 97
Appendix I Contingency Tables for Background Variables and Pruning Decisions ... 98
List of Tables
Table 1-1: Supplementary Reading Guide for Thesis Document ... x
Table 3-1: Background variables and choices ...21
Table 3-2: Qualtrics written instructions: these instructions appeared as frames in the Qualtrics portion of the survey. ...24
Table 3-3: Pruning evaluation criteria used for part one of survey ...25
Table 3-4: Overview for statistical procedures appearing in this study...28
Table 4-1: Response pool composition and function ...30
Table 4-2: Spur selection responses by sidea*(Pool B) ...31
Table 4-3: Cane selection responses by sidea* (Pool B) ...33
Table 4-4: Distribution types among responses to part one assessments of the already-pruned vine (Pool C) ...36
Table 4-5: Missing values for part one assessments of the already-pruned vine (Pool C) ...37
Table 4-6: Summary of excluded cases and variables (Pool C) ...38
Table 5-1: Statistical procedures included in this chapter with description ...39
Table 5-2: Criteria selected for linear models of overall quality assessments (Pool C) ...41
Table 5-3: Linear models and significant predictors of overall quality assessmentsa* (Pool C) ...42
Table 5-4: Two component PCA solutions for cane and spur criteria ratingsa (Pool Cb) ...46
Table 5-5: Unrotated component loading scores for the first component of spur and cane criteria subscales ...47
Table 6-1: Statistical procedures appearing in this chapter, with description ...50
Table 6-2: Pool B and C, response composition by region ...51
Table 6-3: Pool B and C, composition by organisational role ...55
Table 6-4: Pool B and C, composition by experience level ...57
Table 6-5: Experience level interacts with pruning criteria ratings* (Pool C) ...58
Table 6-6: Pruning criteria ratings based on cluster group (Pool C) ...60
Table 7-1: Statistical procedures in this chapter with description...62
Table 7-2: Logistic Regression model for predicting whether a spur will be selected from right sidea (Pool A) ...65
Table 7-3: Multinomial Logistic model for right side cane selectionsab (Pool A) ...66
Table 8-1: Comparison of the four surveyed wine regions ...77
List of Figures
Figure 3-1: Overview of two-part survey structure ...16
Figure 3-2: Flow of events for typical vineyard visit ...18
Figure 3-3: Vine photos before and after pruning and photoshop alteration ...20
Figure 3-4: Qualtrics visual formata ...22
Figure 3-5: Coding system for pruning decisionsa ...27
Figure 4-1: Correspondence analysis of interaction between right side spur and cane selections (Pool B)...34
Figure 4-2: Mean rating of pruning criteria, with confidence interval (Pool C) ...35
Figure 5-1: Normal probability plot of standardised residuals (Pool C) ...43
Figure 5-2: Bi-plot of overall and criteria ratings, as they correlated to components t1 and t2 (Pool C) ...44
Figure 5-3: Variable Importance in Projection (VIP) score for individual pruning criteria (Pool C) ..45
Figure 5-4: PCA bi-plot of spur evaluation criteria (Pool C) ...48
Figure 5-5: PCA bi-plot of cane evaluation criteria (Pool C) ...49
Figure 6-1: Correspondence Analysis of region and right spur decisions (Pool B) ...52
Figure 6-2: Correspondence Analysis of region and right cane decisions (Pool B) ...53
Figure 6-3: MCA bi-plot of region, right side spur selections, and right side cane selections (Pool B) ...54
Figure 6-4: MCA bi-plot of the Interaction between organisational role and right side preferences (Pool B)...56
Figure 6-5: Correspondence analysis of experience and right side spur selection (Pool B) ...58
Figure 6-6: MCA bi-plot of cluster membership and right side preferences (Pool B) ...61
Table 1-1: Supplementary Reading Guide for Thesis Document
Chapter Title Purpose Key Notes
1. Introduction Initiates reader to context of winter pruning
2. Literature Review Review literature in two domains
Two-part literature review A. Review of relevant
methodologies and statistics B. Explores physiological setting of
winter pruning
3. Materials & Methods
A detailed account of a new methodology for the evaluation of winter pruning
decisions.
Two Part Survey
A. Evaluation of a previously-made set of pruning decisions, overall and on 24 individual criteria B. Participants indicate their own
preferred pruning decisions
4. Results: General
Response Profile Provides general picture of survey responses
5. Results: Assessment of Pruning Criteria
Reports results of statistical procedures aimed at exploring the importance of
pruning criteria
Analyses Reported A. Multiple Linear Regression B. Partial Least Squares Regression
6. Results: Group Differentiation
Reports results of statistical procedures aimed at
identifying pruning preference groups
Analyses Reported A. Chi-Square Tests
B. Correspondence Analysis C. Multiple Correspondence
Analysis
D. Hierarchal Cluster Analysis
7. Results: Prediction of Pruning Preferences
Reports results of statistical procedure aimed at predicting participant decisions, based on other
parameters
Analyses Reported A. Binary Logistic Regression B. Multinomial Logistic Regression
8. Discussion
Builds on Chapters 4-7 to formulate arguments regarding pruning
decision-making criteria and the existence of pruning
preference groups.
See section 8.6 for a summary of presented arguments.
9. Post-Examination of Methodology
A reflection on those methodological decisions outlined in Chapter 3, with
suggestions for future research.
A number of adjustments are recommended, many of which would decrease the necessary time investment
from participants. 10. Conclusions Summary of key points from
Chapter 1
Introduction
Winter pruning, in its most basic definition, is the removal of excess shoot growth prior to the beginning of a new growing season (Jackson 2008). Conversely, and perhaps more appropriately, winter pruning may be defined as the deliberate selection of buds for retention, based upon their perceived fruitfulness and suitability for purpose (Zabadal et al. 2002). In cool climate growing conditions, such as those observed in most viticulture regions of New Zealand, winter pruning is seen as an essential means of regulating yield and managing the structure of the vine (Howell 2001). Structure, and to some extent crop load, dictate the light, temperature, and humidity of the canopy environment (Smart and Robinson 1991). As such, conscientious and skilful pruning, in conjunction with appropriate vine training systems, can increase bud fruitfulness (Smart et al. 1982), mitigate disease risk (Reynolds and Vanden Heuvel 2009), promote vine balance (Howell 2001), and optimise fruit quality parameters (Howell et al. 1987). Likewise, the manipulation of carbohydrate dynamics through pruning may have positive secondary effects such as frost avoidance (Trought et al. 1999), reduction of apical dominance (Jackson 2008), and the control of canopy vigour through inter-shoot competition (Reynolds et al. 2005).These and other benefits, with the associated risks of poor pruning, illustrate the central importance of pruning decisions.
Its considerable physiological impacts aside, winter pruning is a significant cause of financial strain for the typical New Zealand vineyard. The 2013 and 2014 Viticulture Monitoring Reports, published by the Ministry for Primary Industries (MPI), placed winter pruning as the single largest expense in the typical yearly budget (New Zealand Winegrowers 2013, New Zealand Winegrowers 2014). Even more concerning, the additional and lingering cost of poor pruning has thus far eluded assessment. Unlike some vineyard tasks, satisfactory cane pruning has proven difficult to mechanise, due to the inherent complexity of the task (Morris and Cawthon 1981, Zabadal et al. 2002). Meanwhile, those embarking on manual pruning can expect to spend 60 to 100 man-hours pruning a single hectare of Vitis vinifera (Andersen et al. 1996), and subject workers to numerous occupational health hazards (Roquelaure et al. 2002, Wakula and Landau 2000).
for Vitis labrusca (L.) juice grape production, of mechanical pruning regiments. (Keller et al. 2004, Morris and Cawthon 1981, Reynolds 1988, Zabadal et al. 2002) These studies, while relevant and timely in their hour, deal with an indiscriminate pruning technique and therefore utilise yield and fruit quality parameters that are influenced by factors other than pruning decision quality.
The present research is part of a larger project that aims to bring robotic pruning to the viticulture industry. As part of this project, and to aid the development of a cane pruning algorithm, an attempt at pruning evaluation was previously undertaken by a supervisor of the present study (Corbett-Davies et al. 2012). Although the evaluation exercise served its purpose adequately, several areas for improvement were identified by the researcher. Most crucially, the evaluations were subject to the ratings of one person, and as such cannot be said to reflect the opinions of the industry as a whole, or any segment. Secondly, the ratings were given a general one to five rating, without published information as to why the decisions scored well or poorly.
Building upon this work, with a continued emphasis on supporting the development of artificially intelligent cane pruning, an industry-wide survey was conducted to gather information regarding pruning preference and relevant decision criteria. The survey asked participants to rate the pruning of a vine via colour photos, both overall and on 24 individual criteria, and also to indicate how they would have ideally pruned the vine. A key point of emphasis is that the study looked at a single vine throughout, in an effort to approximate a model system and to facilitate clear analysis. As a further limitation on scope, it must also be noted that the present study deals only with Two-Cane Pruning, also known as Double Guyot, which may induce decision priorities that differ from those found in other systems.
With the lack of research precedent in this area, hypotheses were forgone in favour of objectives, which may be described as follows:
− Modelling the relationship between individual pruning criteria and overall pruning quality
− Analysing fit-for-purpose of the criteria set currently in use for pruning evaluation
− Identifying and characterising pruning style groups, based on background variables
Chapter 2
Literature Review
2.1
Part One: A review of relevant statistics and methodologies
2.1.1
Introduction
The first segment of this chapter will focus on that literature which directly influenced the design of this study. Without an established framework, many concepts were borrowed from other disciplines and adapted for purpose. In other cases, parallel lines of enquiry existed in other areas of grape and wine science. Where possible, the relevant literature will be organised according to a corresponding research objective. As such, literature presented within part one of this review will fall loosely into one of four categories: linear modelling, group identification and differentiation, outcome prediction with logistic regression, and scale construction. As techniques employed in this study have not been applied previously to the area of pruning preference, a particular effort will be made to provide supporting evidence for procedural decisions, which are outlined in Chapter 3. It is also hoped that the detailed explanations contained within will serve as an interpretative aid to those who are less than familiar with some multivariate statistical techniques commonly referenced throughout Chapters 4-8.
2.1.2
Linear Model Building
Linear Regression
Linear Regression is a tool for the assessment of relationship between a set of independent variables and a dependent variable. (Tabachnick and Fidell 2001) In viticulture, this technique has modelled a variety of relationships including that between seed size and overall berry size (Friend et al. 2009), the carbohydrate status of various plant organs at budburst (Bennett et al. 2005), and the influence of leaf removal on carbohydrate status (Petrie et al. 2000). These models may include a single predictor and dependent variable, as in the case of simple regression, or may incorporate more than one predictor, as in Multiple Linear Regression (Tabachnick and Fidell 2001).
Assumptions and Violations
As with any statistical technique, the myriad assumptions built into Linear Regression are part of what enable meaningful interpretation. While a violation of these assumptions does not necessary disqualify any subsequent analysis, it seems at least appropriate to acknowledge the implications. Perhaps foremost of these assumptions is that pertaining to sample size. While there are a number of guidelines in this area, this study will adhere to the commonly cited recommendations of Green
analysis, where m is equal to the number of independent variables in the model. (Green 1991) Hair et Al. (2006) offers another sample size guideline for Multiple Regression Analysis, holding that a ratio of 5:1 should be observed between cases and independent variables. Tabachnick and Fidell (2001) note that the required cases to independent variable ratio is subject to some fluctuation, depending on the effect size. If a ratio of questionable magnitude is present, both Tabachnick and Fidell (2001) and Hair et Al. (2006) recommend power analysis.
Another assumption of primary concern to this study is that the data are normally distributed (Tabachnick and Fidell 2001). Most sources contend that only the residuals of the model, or deviations from predicted values, must approximate normality (Hair et al. 2006, Kleinbaum et al. 2013, Tabachnick and Fidell 2001). In recent years, work has been done to explore the implications of a violation of residual normality (Lumley et al. 2002, Maas and Hox 2004). Lumley et Al. (2002) demonstrated, with sample simulation of extremely non-normal data sets, that estimates of model fit are robust for data with heteroscedastic residuals. These authors note, however, that with sample sizes less than 130, there may be a reduction in power for the estimation of regression coefficients (Lumley et al. 2002). Maas and Hox (2004) confirmed that model fit is relatively insensitive to non-normality, but identified a potential bias in standard error outputs for very small sample sizes.
Methods for Distributing Variance
Once it has been established that Linear Regression can be carried out with confidence, a means of configuring the model must be established. In uncomplicated terms, it must be decided which predictor variables have the most in common with the dependent variable. To do this, a decision is made as to what should be done in instances where two or more predictor variables overlap in how much of the dependent variable they explain (Tabachnick and Fidell 2001). Several types of these regression procedures exist, each of which may be most appropriate in a particular scenario.
Standard Multiple Regression builds a linear prediction model based solely on the amount of unique, and significant, explanatory power each predictor variable can provide. In Sequential Regression, often referred to as Hierarchal Regression, the researcher makes decisions about the order in which predictor variables should enter the regression equation. Stepwise Regression, a somewhat
an attractive option(Kleinbaum et al. 2013). Controversial nuances aside, it is widely accepted that Linear Regression is a useful and powerful tool for creating explanatory models.
Partial Least Squares Regression
As an alternative Multiple Linear Regression, Partial Least Squares Regression (PLS) can provide many of the same insights with a less demanding set of assumptions. This technique has proven especially valuable in the sensory science segment of wine research, where often the number of measured variables is greater than the number of cases (Frøst and Noble 2002, Lattey et al. 2010, Robinson et al. 2011). Beyond the relaxed constraint for case number, PLS is also appropriate for data in which there is collinearity between predictor variables. In recent decades, PLS has further cemented its appeal in the sensory and social sciences due to its ability to handle large and complex models, often with seemingly opaque relationships (Tobias 1995). On that note, its particular appeal to this project lies in its ability to readily incorporate more than one dependent variable into its modelling
procedure.
2.1.3
Group Identification and Differentiation
Cluster Analysis
A central goal of this research is to identify and profile pruning style groups. There are a number of tools available to achieve such a goal, with each offering a unique set of advantages and
perspectives. One such available tool is Cluster Analysis. Cluster Analysis has been used extensively in the wine industry for various applications including the grouping of wines based on sensory and compositional attributes (Robinson et al. 2011), profiling winemaker and consumer peer groups (Lattey et al. 2010), and examining the progress of anthocyanin development in Cabernet Sauvignon and Tempranillo (Ryan and Revilla 2003). A Cluster Analysis solution, defined in quantitative terms, involves the formation of case groupings based on one or more variables, such that in-group variance is minimised, and between-group variance is maximised (Ketchen and Shook 1996). In simple terms, cluster analysis results in a number of groups that contain like cases. One particularly valuable attribute of Cluster Analysis is that it can establish natural groupings within a sampled population, rather than groupings based on a background variable of hypothesised importance (Hair et al. 2006).
(Aldenderfer and Blashfield 1984, Ketchen and Shook 1996). Ketchen and Shook (1996) recommend cluster analysis with and without standardisation be carried out to illuminate any discrepancies in the results.
Upon establishing which variables should inform the cluster analysis, next one must to decide upon an algorithm for assigning cases to their new groupings. Hierarchal algorithms for cluster analysis form groups by either adding “elements”, often cases, to a cluster one at a time starting from zero, or subtracting them one at a time from one big cluster (Ketchen and Shook 1996). Within this broad definition of Hierarchal Clustering, different techniques exist for calculating the similarity within clusters, and for choosing which clusters to combine at each step of the procedure. Ward’s Method for clustering, which holds the minimisation of the sum of squares error as its guiding principle, is commonly found throughout the wine science literature (Lattey et al. 2010, Robinson et al. 2011, Ryan and Revilla 2003).
An alternative to Hierarchal Clustering is an iterative method, known as K-Means clustering. In contrast to Hierarchal methods, which outline each possible number of cluster configurations, the K-Means method allows for a pre-specified number of clusters. A series of centroids, or cluster centre-points, are established based on the required cluster number, and the natural grouping within the data. After these centroids are initially determined, each case will be categorised into the cluster with the closest centroid. The centroid is then recalculated, and the process repeats until no cases change to a different cluster, thus indicating a solution (Aldenderfer and Blashfield 1984, Ketchen and Shook 1996). It might be noted here that there are indeed a number of ways to verify the results of cluster analysis, including targeted Analysis of Variance, Factor Analysis, and Partial Least Squares Regression. This can be observed in the sensory science literature (Lattey et al. 2010, Robinson et al. 2011), where a cluster analysis solution has the unique property of being valuable in its own right, while also having the potential to serve as a categorical input in other statistical analysis.
Correspondence Analysis
While the ability of cluster analysis to create groups without an existing framework is valuable, there are many instances when it may be desirable to link groups to particular levels of a categorical variable. In these situations, Correspondence Analysis is likely a more suitable choice.
Correspondence Analysis can be regarded as similar to Principle Components Analysis, but for categorical data (Clausen 1998, Greenacre 2010). Indeed, the matrix algebra for both of these dimension reduction techniques are based on very similar mathematical principles (Greenacre 1984). While relatively uncommon in wine literature due to the predominance of ratio-level data,
based on associated descriptive characteristics of the respective wines (Schlich and Moio 1994, Tomasino et al. 2015).
The process typically begins when prospective categorical variables are vetted with Chi Square Analysis to look for interactions between the variables in question (Greenacre 2010). Critically, it is possible to profile the relationship between more than two variables, in what is known as Multiple Correspondence Analysis. While the results of these two procedures are arrived to similarly, there are some subtle differences. In particular, the matrix algebra in simple, one-way correspondence analysis is performed on the contingency table containing frequency distributions. When more than two variables are involved, a binary matrix is created to indicate either yes or no to every category of each variable in the analysis. This matrix, appropriately known as the indicator matrix, is then the subject of the singular value decomposition(Greenacre 1984, Greenacre 2010). Computational nuances aside, both simple and multiple correspondence analysis are useful tools for the characterisation of groups, based on categorical variable membership.
2.1.4
Outcome prediction with Logistic Regression
Given the impetus for this research, considerable amounts of energy were expended considering what types of information would be helpful to the development of an artificially intelligent pruning robot. When the notion was entertained that there might be background-based differences in pruning preference, it followed that it might be possible to predict these preferences based on said background variables. Logistic Regression is one tool for achieving such an outcome (Hair et al. 2006, Tabachnick and Fidell 2001). The technique has been used elsewhere in viticulture and oenology to predict, among other things, consumer attitudes towards screwcap enclosures (Marin and Durham 2007) and threshold identification for Multi-Coloured Asian Lady Beetle-related taint (Galvan et al. 2007). In most fields of study, logistic regression was relatively unknown until recent decades. It is gaining wider popularity due to its range of applications and relative freedom from parametric restrictions (Tabachnick and Fidell 2001).
Interpreting a Logistic Regression Model
Test statistics are available to assess whether the predictive power is significantly increased (Tabachnick and Fidell 2001). Goodness-of-fit is relatively difficult to assess in logistic regression models, but with large sample sizes, Hosmer and Lemeshow’s test is a recommended addendum. Several descriptive measures of goodness-of-fit are available, which attempt to approximate the r2
value of linear regression, are available. These measures, particularly Cox and Snell R2 and Nagelkerke
R2 are commonly reported, but some authorities on the subject urge that they should be of
supplementary use only (Peng et al. 2002). That the Cox and Snell R2 is not on a scale from zero to
one is a source of particular confusion (Hair et al. 2006).
Another bi-product of logistic regression analysis is the ability to forecast the odds of an outcome occurring, within the constraints of a given model. This figure, known as the odds ratio, is given as Exp(B) in SPSS. A value above one indicates that, with a one unit increase in the predictor variable, there is an odds increase for the outcome in question. For example, and conversely, an Exp (B) value of 0.5 would indicate that the outcome odds have been decreased by half, when the given predictor variable increases by one unit. While this ratio is commonly reported in the literature, several authors emphasise that changes in odds are meaningful only in the context of the other constraints of the model, and cannot necessarily be generalised to a different context (Hair et al. 2006,
Tabachnick and Fidell 2001).
2.1.5
Scale Construction
Item Analysis
In the case of multi-dimensional scales, groups of related questions ideally function as
uni-dimensional subscales (Spector 1992). With that being the case, it is necessary to ensure that items in a subscale are each contributing to the measurement of their respective dimension. One tool in this type of analysis is Cronbach’s Alpha (Spector 1992). It follows that this is a measure of inter-correlation between groups of variables. Interestingly, Cronbach’s alpha has also been used to measure concordance between panellists themselves (Bland and Altman 1997, Tavakol and Dennick 2011). In both the creation of SERVQUAL and the red wine quality scale, an item that reduces the Cronbach’s alpha for a subscale was seen as fit for deletion (Parasuraman et al. 1988, Verdú Jover et al. 2004). However, Spector (1992) points out that there may be external reasons for the inclusion of a scale item, such as simply representing a variable of interest. It must also be noted here that the above analyses are predicated on establishing dimensionality within the set of survey items (Spector 1992).
Scale Validation through Factor Analysis
Factor Analysis and Principal Components Analysis (PCA) are the primary tools for establishing dimensionality in a scale. In non-statistical terms, dimensionality refers to content sub-groupings that underpin a particular set of indicators (Babbie 2013). In the creation of Servqual, Exploratory Factor Analysis (EFA) was undertaken several times as item analysis and iterative deletion progressed, in order to re-establish groupings among scale items (Parasuraman et al. 1988). The ability of Principal Components Analysis to achieve similar outcomes has been established elsewhere in the literature (Dunteman 1989) . The findings of factor analysis in the Servqual example prompted the regrouping of some indicators, as well as a reduction in the total number of dimensions. This regrouping lead to a streamlined, but still effective version of the scale (Parasuraman et al. 1988).
2.2
Exploring the Physiological Setting of Cane Pruning
2.2.1
Introduction
While the present research proposes to address cane pruning with behavioural science tools, pruning inevitably finds itself at the centre of vine physiology as well. At the heart of grapevine pruning is the pursuit of vine balance, which can be described as an equilibrium between vegetative growth, crop load, and optimal fruit quality (Gladstones 1992, Howell 2001). In this three-part equation, a number of factors exert some measure of influence. An undulating flow of natural forces and human
decisions ultimately determines the initial state of a particular vine at pruning. What follows is a description of some of these forces as they relate to pruning, a topic that could fill many volumes.
2.2.2
Vine Capacity and Vigour
Winkler et Al (1974) define vine capacity as the “total growth and total crop of which the vine or a part of it is capable [of producing]”. Vine vigour, on the other hand, has seen conflicting definitions, many of which overlap with vine capacity to some extent. In its most common usage, vine vigour refers, rather circularly, to the average vigour of the shoots on a particular vine (Dry and Loveys 1998). As documented by a number of authoritative works (Howell 2001, Kliewer and Dokoozlian 2005, Winkler 1962), vine capacity, vigour, and balance are inextricably linked to vine pruning decisions. They are, however, not entirely endogenous to the internal workings of the plant system, but rather are influenced by many factors of both human and environmental origin. These factors, it follows, have the potential to affect the pruning decision-making paradigm.
2.2.3
Climate and Site Selection
Regional macroclimate is undoubtedly one of the main determinants of vine capacity. Within the domain of macroclimate, the primary contributors to vine capacity are growing season length, heat accumulation, and sunlight intensity (Howell 2001). Increasing amounts of heat accumulation, within the range of 5 to 30 degrees Celsius, are connected to increases in photosynthesis and cellular respiration (Winkler 1962). Sunlight, on the other hand, provides the substrate for the conversion of carbon dioxide gas to plant sugars. It has the additional role in photosynthesis of signalling for the opening and closing of stomata, and thus regulating the intake of carbon dioxide (Smart and
Robinson 1991, Winkler 1962). Light intensities in various grape growing regions are known to differ quite dramatically, which impacts the productive capacity of vines within these regions (Howell 2001). Smart (1985) notes that, while sunlight radiation intensity is tied to increases in
photosynthesis, there is a sunlight saturation point, beyond which photosynthesis ceases.
pressure, with its associated impact on nutrient flow, cell elongation, and rate of photosynthesis (Hardie and Considine 1976, Thomas et al. 2006). Guard cells of the stomata play a key role in the response of the vine to water stress. Upon desiccation of the interior cells of the stomata, including the guard cells, there is a corresponding loss of turgidity. A loss of turgidity in the guard cells
effectively closes the stomata to the exchange of gases, which include water vapour. As noted above, the closing of the stomata results in a cessation of carbon dioxide intake which has a slowing effect on photosynthesis (Creasy and Creasy 2009).
As such, growth will be stunted, and pruning choices limited, in drought-prone regions that fail to compensate with irrigation. Conversely, in an area of high rainfall and deep, well-structured soil, a vine is likely to produce vigorous growth (Smart and Robinson 1991). If the vine has a relatively low crop load in these conditions, it is likely to push shoots from the centre area of the head (Winkler 1962). While this has the potential to create more options for cane pruning, it may also create shading which will lower the fruitfulness of buds and create conditions which are conducive to fungal diseases (Smart 1985). It is plausible that such divergent conditions could form the basis of regional differences in pruning strategy.
At a site-specific level, both the elevation and aspect of vineyard plantings affect the rate of vine photosynthesis (Gladstones 2011, Winkler 1962). These effects are due to air movement dynamics, differences in sunlight angles, and changes in atmosphere composition with increasing altitude (Gladstones 1992, Gladstones 2011). Furthermore, exposure to wind alters rate of water loss through the stomata, as well as the temperature of both leaves and berries, and therefore the rate of
photosynthesis (Creasy and Creasy 2009). Also at the site level, soil field capacity (ability to hold water) is both highly variable and fundamentally significant to grapevine water relations and
therefore productive capacity (Gladstones 2011, Winkler 1962). Likewise, soil composition is a major determinant of vine access to mineral nutrition, which is critical to a number of cell functions
relevant to shoot and fruit development (Creasy and Creasy 2009, Smart and Robinson 1991).
2.2.4
Cultural Practices and Vine Vigour
(Howell et al. 1987). The varying ability of training systems to efficiently capture sunlight has also been linked to fluctuations in vine capacity (Smart 1985), through previously outlined mechanisms.
Some of the most important practical decisions, with respect to vine capacity, play out below ground. In particular, choice of rootstock is known to exhibit a noticeable effect on vine vigour. In a New Zealand context, significant differentiation in pruning weights has been observed among six
rootstocks of varying parentage (Creasy and Wells 2010). Relative to the literature surrounding other horticultural crops, there is currently a surprising lack of exploration into the vigour imparting qualities of grapevine rootstocks (Dry and Loveys 1998). What is known is that rootstock choice affects soil penetration, regulation of plant growth hormones, and mineral uptake (Nikolaou et al. 2000, Pouget 1986). On the subject of mineral uptake, it would be remiss not to mention that fertiliser applications drastically alter the supply of available nutrients, which have a key, promotive role in many cell functions (Creasy and Creasy 2009). If one can support its substantial cost, root pruning may be a suitable option for those interested in limiting vine vigour, as root volume has been linked to shoot vigour (Dry and Loveys 1998). In reality, the practical decisions described above are just a few of the myriad ways in which managerial decisions affect vine capacity and vigour, and therefore pruning conditions.
2.2.5
Frost Avoidance
In many areas of cool climate viticulture, pruning technique is leveraged as a means of protection against spring frost damage. The damage, itself, in grape tissue is caused by one of either the piercing of the cell wall through the expansion of ice crystals, or the loss of cell structure due to osmotic cell dehydration (Levitt 2012). Much of the manoeuvrability introduced during pruning stems from the observation that buds in a less advanced stage of phenological development are less vulnerable to cold damage (Howell and Wolpert 1978). In simpler terms, this amounts to the notion that holding back buds as long as possible will maintain their ability to withstand cold temperatures.
these investigations have provided some much-needed support, much of the knowledge around manipulating pruning to avoid frost exists at a practitioner level, and has not yet been formalised.
2.2.6
Mitigation of Disease Risk
Consideration of disease enters into the pruning thought process in a number of ways. The presence of powdery mildew (Uncinula necator), for example, reduces whole vine photosynthesis, carrying with it the numerous downstream effects of a less productive vine (Lakso et al. 1982). Beyond reduced efficiency, the most damaging effects of powdery mildew include loss of serviceable crop due to infection on the berries of the grape, and the production of dysfunctional flag shoots (Cortesi et al. 1997, Creasy and Creasy 2009, Pearson and Gadoury 1987). The disease survives in dormant wood, either primarily in its mycelium form, or in the form of cleistothecia, in areas of low winter temperature such as New York and Continental Europe (Cortesi et al. 1997, Pearson and Gadoury 1987). Bearing in mind that powdery mildew is but one disease, from one kingdom of pathogens, the short term effects of selecting diseased pruning wood should be readily apparent.
The presence of powdery mildew, however, is a relatively short-lived problem compared to some of wood diseases that regularly plague vineyards. Worth particular mention among this list of
pathogens is Eutypa lata, the causal agent of Eutypa Dieback. Symptoms of the disease include variably stunted shoot growth and compromise of vascular tissue, which gradually leads towards mortality for the infected vine (Creasy and Creasy 2009). Fungal spores are released shortly after rainfall from perithecia structures and proceed to infect vulnerable tissue exposed by recent pruning cuts. A common means of combatting this disease is to apply paint, containing either a fungicide or Bio-Control Agent, to the pruning wound (Weber et al. 2007). Delaying of pruning, in California, has also been established as an effective means of reducing the risk of Eutypa infection (Petzoldt et al. 1981). A unique pruning philosophy has also emerged, from the Loire Valley of France, aiming to achieve improved vine sap flow and reduced potential for dieback proliferation, by way of cuts in a very particular style and position (Dal 2008). While this is yet another dimension of pruning needing further investigation, it is clear that practitioners are seeking remedies, through pruning, to a serious problem.
2.2.7
Differential Bud Fruitfulness
and separately how many berries, will emerge out of every node retained during pruning. Without dwelling excessively on the effects of temperature and light intensity, any tactic that delays the time of flowering until more conducive photosynthetic conditions are present will increase the probability of robust fruit in a cool climate (Friend and Trought 2007). Beyond these effects, the vine exhibits a number of intrinsic tendencies, with respect to bud fruitfulness.
First and foremost, apical dominance is a primary driver carbohydrate distribution in Vitis vinifera. In most cases of cane pruned Vitis vinifera vines, distal node positions produce riper fruit and are higher yielding than basal positions (Naylor 2001, Vasconcelos et al. 2009). Within the shoot itself, primary bunch positions in (cv.) Sauvignon Blanc yield significantly riper fruit, and exhibit a higher percent of flowering than secondary bunches (Naylor 2001). It is widely known anecdotally, with some empirical support (López-Miranda et al. 2002, Rives 2000), that the fertility of basal buds varies naturally between vitis Vinifera cultivars. Considering the implications, more work is needed to explain this phenomenon.
While establishing intrinsic varietal differences in positional fruitfulness is a work in progress, there is ample evidence to assess the relationship between fruitfulness and the physical characteristics of a particular shoot. Several studies have identified a positive relationship between shoot internode diameter and bud fruitfulness (Bennett et al. 2005, Eltom et al. 2014, Sánchez and Dokoozlian 2005). Such differences are thought to be a reflection of the increased capacity for carbohydrate storage observed in thicker canes (Bennett et al. 2005, Howell 2001). The effect of cane length, with respect to positional fruitfulness, has also been investigated. Somewhat predictably, the effects of apical dominance supersede any inhibitory signalling effect on basal node positions, as distal positions on short canes are more fruitful than the same position on a longer cane (McLoughlin et al. 2011).
As grapevine pruning is subject to social influences, and also predates viticulture science by millennia, a number of untested beliefs are held with respect to cane pruning practice. While it would be well out of the scope of this research to identify all such tenets, several are of particular relevance. One such belief is that canes emerging from one year-old spurs are more fruitful, as pruning wood, than canes emerging from older wood. This belief is thought to emerge from the supported observation (Howell et al. 1987) that non-count shoots, including those directly from the head of the vine, are less fruitful in the year of their emergence. It is unclear, at this time, whether canes from one year old spurs are, in fact, significantly more fruitful as pruning wood than those shoots from non-count positions.
Chapter 3
Materials & Method
3.1
Pruning Survey Overview
Upon the completion of several preliminary investigations in 2014, a survey was prepared to collect information regarding the nature of cane pruning preferences in New Zealand. The survey consisted of two parts (Figure 3-1). First was a digital survey that asked participants to rate a set of already-made pruning decisions, both overall and on 24 individual criteria. These decisions were presented as colour photos, which were presented with Qualtrics survey software. As Part Two of the survey, participants were asked to indicate their own pruning preferences for the same vine, by marking their decisions with highlighter pens on a printed colour photo of the unpruned vine.
A key point of emphasis in this study, one that defines both its utility and limitation, is that only one vine was used throughout. Preliminary investigation in 2014 offered a number of indications, some practical and some theoretical, that justified the use of only one vine in the present study. Foremost of these reasons, was the impracticality of collecting enough survey responses to perform statistical analysis on a large number of vines. Additional comments on the issue of vine number may be found in Section 9.2.
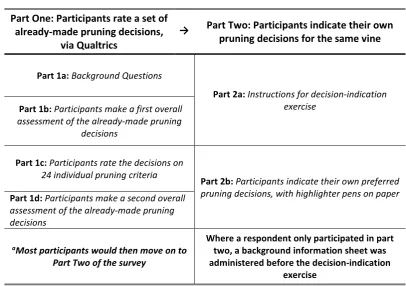
Figure 3-1: Overview of two-part survey structure
Part One: Participants rate a set of already-made pruning decisions,
via Qualtrics
→ Part Two: Participants indicate their own pruning decisions for the same vine
Part 1a:Background Questions
Part 2a: Instructions for decision-indication exercise
Part 1b:Participants make a first overall assessment of the already-made pruning
decisions
Part 1c:Participants rate the decisions on
24 individual pruning criteria Part 2b: Participants indicate their own preferred pruning decisions, with highlighter pens on paper
Part 1d:Participants make a second overall assessment of the already-made pruning decisions
aMost participants would then move on to
Part Two of the survey
Where a respondent only participated in part two, a background information sheet was administered before the decision-indication
exercise
On the subject of response number, there were three methods of data collection utilised for this study. Most responses, the extent to which is detailed in the next chapter, were collected in person, by way of vineyard visitation. A small number of responses to the ratings portion of the survey were obtained online with Qualtrics, as a result of requests placed in industry body newsletters. Another fraction of the sample, this time consisting of pruning decisions only, was gathered at the 2015 Marlborough Silver Secateurs competition.
On the subject of complex procedural decisions, it must be emphasised that, as the first study of its kind, this methodology was viewed as somewhat exploratory. The design of this survey required many decisions to be made without the foothold of direct precedent. Compounding the lack of precedent in this research area is the innate complexity of conducting behavioural experiments in an agricultural field setting. Where a difficult decision has been made, and supporting literature is unavailable, efforts have been made to provide elaboration.
By chronicling the methodology here in detail, it is hoped that others will be able to build and improve upon this foundation. To that end, one of the four stated objectives of this study relates to providing guidance for future methodological frameworks. Having addressed the many challenges encountered, an account of the methodology will thus be presented, with optimism that the value of the information collected will supersede its interpretative limitations.
3.2
Participant Invitation
Although the ambition of this research was to survey the New Zealand wine industry as a whole, for practical reasons, responses are primarily from four regions: Marlborough, Hawke’s Bay, Waipara, and Central Otago. This was, in part, a recognition of the constraints of budget, time, and
multivariate statistics, with particular attention to the challenge of achieving a large enough sample to validate comparisons between regions. These particular regions were chosen for a variety of practical and theoretical reasons that include contribution to the national grape hectarage, prevalence of cane pruning, ease of access, and perceived likelihood of exhibiting unique pruning tendencies. According to the 2015 New Zealand Winegrowers Annual Report, these regions represent roughly 87.5 per cent (Marlborough: 64.7 %, Hawke’s Bay: 13.3 %, Canterbury (including Waipara): 4.0 %, and Central Otago: 5.4 %) of the producing vineyard area in New Zealand (New Zealand Winegrowers 2015). A more thorough investigation of the pruning tendencies found in New Zealand’s other wine regions will hopefully be the subject of future work.
contacted without result. Wine Marlborough further assisted by permitting data collection at the 2015 Marlborough Silver Secateurs competition. At this competition, a table was set up near the activity, where interested parties were invited to offer their own preferred pruning decisions for the vine in question.
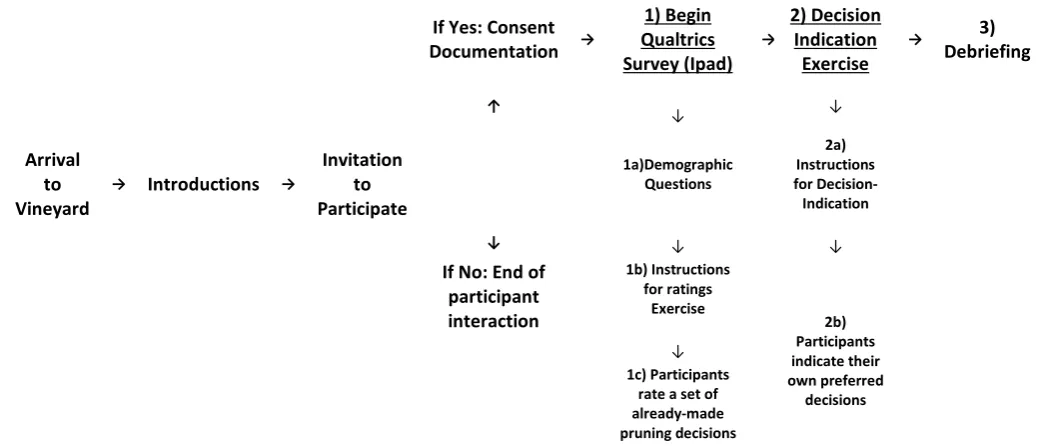
All remaining data were collected through vineyard visitation. Figure 3-2 displays the typical flow of events for visits to participating vineyards. In general, contact with participating vineyards was initiated in one of three ways. Scenario one occurred when someone at the organisation was known to the researcher or supervisors, and therefore served as a point of contact. Often this was a
vineyard supervisor or manager. After such contact, visitation would typically be arranged, at which point the researcher was often allowed to speak to other members of the organisation and invite them to participate. In many of these cases, however, the initial contact was the only person surveyed. A second scenario developed, in which a contacted person would suggest a colleague or industry acquaintance who might be willing to participate.
If Yes: Consent
Documentation →
1) Begin Qualtrics Survey (Ipad) → 2) Decision Indication Exercise → 3) Debriefing ↑ ↓ ↓ Arrival to Vineyard
→ Introductions →
Invitation to Participate 1a)Demographic Questions 2a) Instructions for Decision-Indication ↓ ↓ ↓
If No: End of participant interaction 1b) Instructions for ratings Exercise 2b) Participants indicate their own preferred decisions ↓ 1c) Participants rate a set of already-made pruning decisions
Figure 3-2: Flow of events for typical vineyard visit
3.3
Vine Selection, Pruning, and Photography
As part of the preliminary study conducted in 2014, before-and-after pruning photos were collected for tens of vines to create a pool of potential vine subjects for future usage. Cuts were made and photos taken using garden secateurs, a Lumix DMC-FZ18 camera, and a white plastic board backdrop, respectively. The vine chosen for this study was pruned and photographed during early August 2014 (late-winter), in the early evening sun. These particular conditions, particularly the low angle of the sun, provided a high resolution view of the wood in question, at the cost of a shadowing effect on the backdrop.
The vine itself was chosen based upon several criteria. A primary attribute of the vine was that it presented a number of seemingly viable pruning options, which may be examined in Figure 3-3a. This was a key point of emphasis during the selection process, as it was thought that little information could be gained from a vine with only one plausible option. Likewise, the vine was not, by all accounts, in such dire condition that the coming year’s decisions were irrelevant or impossible to reconcile satisfactorily. While these considerations were purely subjective, they represent something akin to a hypothesis, that the vine’s attributes would reflect meaningful information about New Zealand pruning tendencies. Section 9.3 will explore implications of this particular selection, and offer direction for future vine selection.
Pruning of this vine was carried out during the 2014 pilot study (unpublished data), by the
researcher, in accordance with principles gleaned from several sessions of preliminary, immersive field work at three Waipara vineyards. Principles for spur selection were that, wherever possible, renewal spurs should be located roughly three quarters of secateurs-length below the wire, to the inside of fruiting canes, and in a position that will not create undue crowding with cane selections. For the particular vine in question, a decision was made to forgo a lower spur, in favour of one that would potentially induce less shoot crowding. Canes, on the other hand, were to ideally come out of a previous year’s spur, to be located to the outside of spurs, and sit low enough to enable tying down. Section 9.3 explores some of the implications of the selected pruning decisions, and explores potential considerations in future research.
Figure 3-3: Vine photos before and after pruning and photoshop alteration
Image A: Vine before pruning and photoshop alteration; Image B: Vine after pruning; Image C: Unpruned vine after Photoshop alteration
3.4
Participant Identification System
A simple system of numeric identification provided several benefits to this study. Primarily it served as a linkage between Qualtrics responses and paper-based decision data. As the first prompt of the Qualtrics interface, prior to giving the device to the participant, the researcher would enter the ID
A B
number assigned to that particular participant. Directly after, this number was recorded on a
decision indication form, which was also provided to the participant at this time. For data collected at the Silver Secateurs competition, an ID number was written on the paper decision form and,
separately, to all attached forms. The second function of the ID number was to provide a simple and anonymous method for participant withdrawal at some later date, although this right was not exercised by any participant.
3.5
Demographic and Background Questions
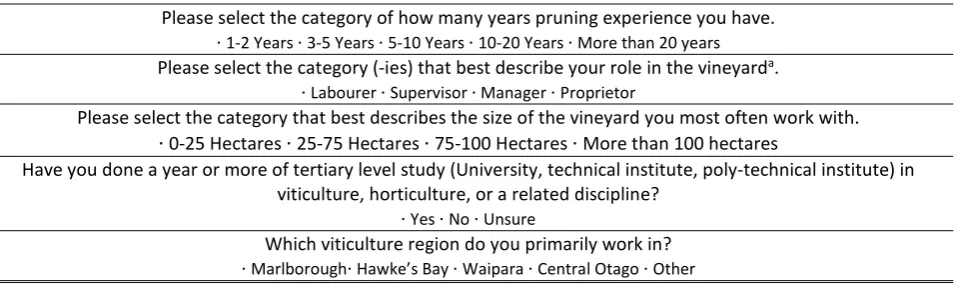
After recording consent to participate in the study, participants provided several answers regarding their background, both personal and professional. Participants in both the qualtrics and silver secateurs portion of the sample pool were asked for this information. These survey items may be viewed in Table 3-1. Background questions were presented in a multiple choice format. All questions allowed the participant to proceed without answering. No items allowed more than one response, with the exception to the item relating to role in the vineyard. The items relating to tertiary viticulture education and region had an additional option of “unsure” and “other”, respectively. In several instances, a participant opted to engage in only the decision making part of the survey during an in-person visit. These participants were given a paper-based version of the background questions, as was also provided to those at the Silver Secateurs competition.
Table 3-1: Background variables and choices
These questions appeared as frames in the Qualtrics portion of the survey. aFor this question, participants
were allowed to select more than one response. Participants were permitted to skip questions.
3.6
Use of Supplementary Photos
As suggested in the section on photography, supplementary photos were made available to participants completing either or both parts of the study in person. These were photos enlarged to fill A4 sized sheets of paper. Photos included a close-up angle and one that was zoomed out to capture roughly the entire vine. The relatively small number of participants who completed the study
Please select the category of how many years pruning experience you have. · 1-2 Years · 3-5 Years · 5-10 Years · 10-20 Years · More than 20 years Please select the category (-ies) that best describe your role in the vineyarda.
· Labourer · Supervisor · Manager · Proprietor
Please select the category that best describes the size of the vineyard you most often work with. · 0-25 Hectares · 25-75 Hectares · 75-100 Hectares · More than 100 hectares
Have you done a year or more of tertiary level study (University, technical institute, poly-technical institute) in viticulture, horticulture, or a related discipline?
· Yes · No · Unsure
online did not have the benefit of these supplementary photos. In Section 9.6, the possible influence of this distinction will be explored.
3.7
Survey Part One: Assessmen
t
of Already-Made Pruning Decisions
3.7.1
Visual format of ratings prompts
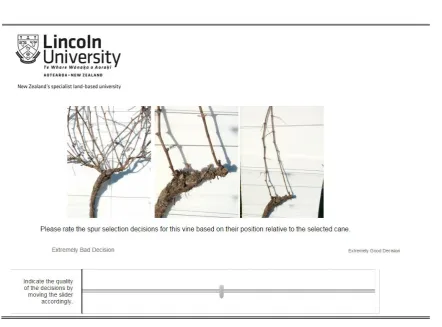
An example of the visual format for Qualtrics ratings can be viewed in Figure 3-4. Notably, this format has adopted a Visual Analogue Scale for the purpose of recording ratings on a continuous scale. In addition to its frequent appearance in other disciplines, the VAS has successfully been used in sensory-based trials seeking to characterise regional wines (Parr et al. 2007, Parr et al. 2010, Tomasino et al. 2015). Starting from a fixed middle position, participants would slide the touch dial in the direction that corresponds to their opinion of the pruning decisions. On this scale (Figure 3-4), all the way left corresponded to a rating of “extremely bad decision”, and all the way to the right indicated a rating of “extremely good decision”
Figure 3-4: Qualtrics visual formata
aThe image presented is a condensed screen capture of the first overall rating, found in the Qualtrics portion
of the survey
Aspects of this decision process, particularly those which pertain to limitations and idiosyncrasies of Qualtrics software, will be discussed in Section 9.5 and, to a lesser extent, Section 9.7. The VAS was anchored by two text boxes, on either extreme of the dial. To the far left, the text read “Extremely Bad Decision”, while to the far right was “Extremely Good Decision”. While the choice of anchor phrasing is somewhat discretionary, the selected wordings are thought to be consistent with available guidelines and perspective on the topic (McCormack et al. 1988).
3.7.2
Instructions and Assumptions
The Qualtrics format allowed for instruction frames to be included in the survey presentation. These pages came directly after the sequence of demographic questions, but before participants were presented with the vine. Three frames of instructions were included in the survey, the wording of which can be viewed below in Table 3-2. The first of these frames was a reminder as to what is generally understood by Two-Cane, Double Guyot pruning. Frame two addresses the issue, as alluded to above, that vines can be found at radically different levels of difficulty over the span of a vineyard. Participants were asked to place a particular emphasis on rating decisions based on what options were available, rather than indicating their level of the satisfaction with the outcome, in general.
Frame three asked participants to assume that the vine in question was (cv.) Sauvignon Blanc. The preliminary investigation, conducted in 2014, suggested that some practitioners might prune a vine in several ways, depending on the variety. To control for this ambiguity, the variety that represents 68 per cent of New Zealand’s grape production was chosen (New Zealand Winegrowers 2015). Although it was strongly considered, alternating grape variety between respondents would have potentially doubled the amount of responses needed for some analyses, and was opted against. This particular point will be addressed further at various points in Chapter 8 and Chapter 9.