IRIS:
E
ffi
cient
Visualization,
Data
Analysis
and
Experiment
Management
for
Wireless
Sensor
Networks
Richard Figura
1,∗, Matteo Ceriotti
1, Chia-Yen Shih
1, Margarita Mulero-Pázmány
3, Songwei Fu
1,
Roberta Daidone
2, Sascha Jungen
1, Juanjo José Negro
3, Pedro José Marrón
11Networked Embedded Systems, University of Duisburg-Essen, Germany 2Department of Ingegneria dell’Informazione, University of Pisa, Italy
3Department of Evolutionary Ecology, Doñana Biological Station, CSIC, Seville, Spain
Abstract
The design of ubiquitous computing environments is challenging, mainly due to the unforeseeable impact of real-world environments on the system performance. A crucial step to validate the behavior of these systems is to perform in-field experiments under various conditions. We introduce IRIS, an experiment management and data processing tool allowing the definition of arbitrary complex data analysis applications. While focusing on Wireless Sensor Networks, IRIS supports the seamless integration of heterogeneous data gathering technologies. The resulting flexibility and extensibility enable the definition of various services, from experiment management and performance evaluation to user-specific applications and visualization. IRIS demonstrated its effectiveness in three real-life use cases, offering a valuable support for in-field experimentation and development of customized applications for interfacing the end user with the system.
Keywords: Wireless Sensor Networks;Data Processing;Experiment Management;Data Analysis; Data Visualization; End-UserApplicationDevelopment
1. Introduction
Wireless Sensor Networks(WSNs) offer a pragmatic
solu-tion for acquiring physical parameter measurements, serving as a stepping stone towards the realization of ubiquitous computing environments. Many applica-tions, e.g., habitant monitoring, surveillance and indus-trial automation, have employed WSNs as data sources to observe, control, and optimize a variety of physical processes. However, setting up a suitable WSN involves a tedious iterative process of developing the necessary WSN application, deciding on the deployment config-uration, evaluating the application performance, and delivering processed information to the final user. The developer often conducts numerous empirical experi-ments or testing cases with various application param-eter settings and network configurations. Once the experiment data is available, the developer needs to define how to process and analyze the data in order to evaluate the application performance. Finally, a con-venient interface must enable the user of the final system to fully exploit the information gathered from the deployed system.
∗
Corresponding author. Email:[email protected]
The tasks of handling experiment settings, and evaluating the application performance in order to determine the best-fit WSN deployment are time consuming and error-prone. In addition, the processing required to export the aggregated information to the end user is typically based on various compositions of common processing and visualization functions, depending on the specific application use case. It is then easy to see that a practical support for experiment configuration, performance evaluation, and data analysis is the key to the success of WSN application development, especially when a complex ubiquitous computing system requires several WSN deployments. For this purpose, we offer an integrated solution that enables effective experiment management and data analysis for performance evaluation. By supporting these tasks, we also conveniently support the development of the interface between the system and the final user, where usability and extensibility are of high importance.
Our work was motivated when preparing experi-ments in an EU project, PLANET [1], for both a pol-lution monitoring as well as a horse tracking applica-tion in the Doñana Biological Reserve(DBR) [2], Spain.
EAI Endorsed Transactions
on Ubiquitous Environments
Research Article
Received on 31 May 2014, accepted on 10 October 2014, published on 17 November 2014.
Copyright © 2014 S. C. Khorakhun, S. N. Bhatti, licensed to ICST. This is an open access article distributed under the terms of the Creative Commons Attribution licence (http://creativecommons.org/licenses/by/3.0/), which permits unlimited use, distribution and reproduction in any medium so long as the original work is properly cited.
These applications require a long-term WSN deploy-ment in order to acquire physical measuredeploy-ments from the target environment under observation. The mea-surement data is either delivered by the connected WSN or collected by unmanned aerial or ground vehicles (UAVs or UGVs). With the time and hardware limitation in DBR, we needed to efficiently perform concurrent experiments with various network configurations and parameter settings. Therefore, we developed a tool, for-merly known as IMAC [3], which provides a primitive mechanism for experiment management and on-site data analysis. The use of IMAC greatly helped us in accomplishing the experiment objectives.
We present in this paper the final release of IRIS1, the successor of IMAC, with many augmented features. Our goal is to provide an integrated and flexible solution for experiment configuration management and performance data analysis in order to facilitate the development of WSN applications for ubiquitous computing environments. We particularly address IRIS’ main features in several aspects. First, IRIS provides a mechanism for managing WSN experiments. The developer can use IRIS to automate the application installation procedure, to iterate the experiment with different configuration and parameter settings, to create customized logs for different experiment purposes, etc. Second, for data collection and result analysis, IRIS emphasizes its extensibility by allowing the user to specify required data message formats and to flexibly define necessitated functions for data processing. The user can also develop the user interface to ubiquitous computing environments supported by WSN systems by integrating IRIS and implementing the program logic using functions. Third, during the experiment, the developer can use IRIS to interact with the deployed WSN in order to fine tune the parameter settings for higher performance or for debugging purpose. Finally, IRIS also includes a graphical interface for visualizing the status of data collection as well as analyzed results. IRIS integrates JFreeChart [4] and the Worldwind Java SDK [5] to generate figures with line and bar charts as well as representations of spatial data on maps. With these features, IRIS not only supports the different phases of experimentation including pre-experiment configuration, experiment runtime and post-experiment data analysis, but it is also able to assist in the development of theend user interfaceto the gathered data.
While a preliminary version of IRIS was already described in [6], this work further extends the core architecture by (a) supporting the integration with external middleware solutions for data input, (b)
1After the Greek goddess IRIS for the meaning for messaging and communication
exposing data in map views, and (c) providing the different data views in separate containers to simplify the composition of end user interfaces. Moreover, (d) we discuss the usage of IRIS in a full fledged application scenario for horse monitoring in DBR. By covering the very last step of application development to reach the final user, we demonstrate the flexibility of IRIS as well as its ability to meet the user requirements. Finally, (e) we make IRIS publicly available [7] so that the whole community can benefit from our work.
The remainder of the paper is structured as follows. Section 2 describes the related work of experiment tools for WSNs; Section 3 gives an overview of the IRIS tool and elaborates on its main features; Section 4 demonstrates the possible different usages
of the aforementioned features; in Section5, we show two case studies, in which IRIS helped the developer in the process of the WSN experimentation, while Section 6 discusses a real-world application in which IRIS supported the end user in accessing the data collected from a deployed system; finally, we conclude our work in Section7.
2. Related Work
Much work has been devoted to enable WSN appli-cation experiments. WSN testbeds, for example, offer hardware and software for WSN experiment setup, WSN application installation, node reprogramming and experiment execution for performance analysis. The TWIST [8] testbed deployed by TKN (Telecommuni-cation Networks group at Technical University Berlin) enables indoor experiments with heterogeneous node platforms and network reconfiguration; the CONET testbed [9] includes a graphical software that allows an intuitive experiment configuration. Similar to IRIS, these testbeds allow managing the WSN experiments. However, such testbed infrastructure is setup in a spe-cific environment, and they are built neither for per-forming on-site experiments with the real environment nor for processing the application data.
IRIS: Efficient Visualization, Data Analysis and Experiment Management for Wireless Sensor Networks
fixed set of performance metrics, e.g., packet delivery, temporal and spatial correlations and link asymmetries. IRIS does not limit the processing data type and allows the user to define application-specific processing func-tions. We note that IRIS can share similar functionality if the same metrics are defined as IRIS functions.
For analyzing application data, MATLAB [13], Octave [14], R [15] and SPSS [16] are notable tech-nical languages for performance analysis, algorithm development and model design. They also provide a rich set of built-in mathematical functions for a wide range of applications such as communication, signal processing, computational biology, etc. Other tools such as SciDavis [17] and LabPlot [18] are free software for scientific data analysis and visualization. Spatial analysis can be supported by programs like QGIS [19], GRASS [20] and ArcGIS [21]. While these tools are powerful for data processing, they cannot be used for run-time WSN data analysis.
SenseMap [22] and NetViewer [23] are popular WSN tools for data collection and visualization. In particular, SenseMap provides different perspectives for displaying outdoor and indoor deployments, as well as a topology perspective showing the communication links within a network. The data is provided through a RESTful API and can be accessed via HTTP. NetViewer is, instead, a tool for collecting data with arbitrary message formats. Both are powerful tools for data collection and visualization. Similar solutions are MOTE-VIEW [24], SpyGlass [25], Nviz [26] and Vizzly [27]. However, these tools do not allow the injection of arbitrary messages into the network. DISON [28] and Octopus [29], instead, provide graphical user interfaces to enable the reconfiguration and management of deployed applications and networks. This is especially important for deployments in dynamic environments or with changing application requirements. Like IRIS, they allow the injection of reconfiguration messages into deployed systems. However, they lack the ability to define customizable functions for data processing.
Although the aforementioned tools are specialized in either system management or data processing, they do not support both on-site WSN interaction and real-time application data processing. To the best of our knowledge, IRIS is the first tool that provides an integrated solution for the above issues and offers a flexible mechanism for the user to define application-specific processing functions to meet the application-specific requirements of various applications and deployments.
3. IRIS
IRIS aims at providing an integrated solution for experiment management and on-site data analysis. The predecessor, IMAC, provides an environment for basic experiment journaling, data logging and visualization.
IRIS enhances these features and especially puts emphasis on offering flexible data processing with customized functions. More importantly, IRIS provides an innovative method that allows to manipulate the collected data during the system operation as well as a posteriori.
3.1. Architecture Overview
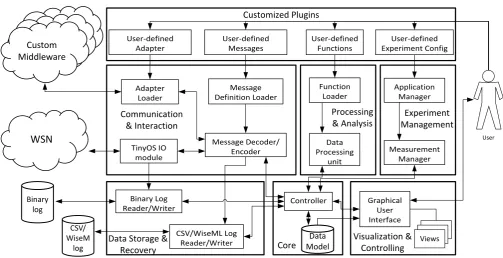
We developed the IRIS tool in Java as a modular system, which is flexible and extensible. Each IRIS module carries out one or more main features of IRIS. Figure1
shows an overview of the IRIS’ design architecture.
The User Configuration customizes the behavior of
IRIS to the specific scenario at hand by supporting user-specific configurations, data processing and message formats required to interact with the data gathering system. To enable automated application installation and experiment measurement management, we intro-duced anExperiment Managementmodule. The
Process-ing and Analysis module carries out IRIS’ capability
of processing gathered data supporting user-defined functions, while the Communication Interaction mod-ule enables the interaction between the user and the deployed WSNs running either standard TinyOS [30] applications or specialized middleware solutions, e.g., the one employed in the PLANET [1] project. Other modules such as theData Storage and Recoveryand the
Visualization and Controlling modules are responsible
for storing the log data and for visualizing the data analysis output, respectively.
The core of IRIS is centered at the Controller and its associatedData Model, which stores all the message structures and log data imported into IRIS. The Controller defines the logic for managing these data as well as the interaction with all other components. Together all the modules carry out the main features of IRIS as described below.
3.2. Features
We highlight the main features of IRIS regarding exper-iment management, data collection, WSN interaction, data processing and data visualization.
Experiment Management. The first feature of IRIS is that it provides a set of useful utilities that allow to perform experiments efficiently.
Message Definition Loader User-defined
Adapter
User-defined Messages
CSV/WiseML Log Reader/Writer
Function Loader
Controller Graphical User Interface Data
Processing unit TinyOS IO
module
Message Decoder/
Encoder Measurement
Manager User-defined Experiment Config User-defined
Functions
Application Manager
Binary Log Reader/Writer
WSN
CSV/ WiseM
log Binary
log
Processing & Analysis
Data Storage & Recovery Communication
& Interaction
Visualization & Controlling
User Customized Plugins
Experiment Management
Data Model
Core
Adapter Loader
View View Views
Custom MiddlewareCustom MiddlewareCustom Middleware
Figure 1. IRIS modular architecture
hardware for installation. This feature is extremely useful and have greatly shortened the preparation time of our experiments in DBR. Despite the current implementation of IRIS restricts this feature to TinyOS binary images, it can easily be extended to support other types of operating systems.
Measurement Management When running a series of experiments, another issue is to match the recorded data to different experiment settings. In IRIS, an experiment can consist of several experiment runs, or “measurements”, and for each measurement IRIS organizes a set of log files for incoming and outgoing messages in binary, CSV and WiseML formats. For each experiment, IRIS generates a metadata file that specifies the general information and experiment statistics including an experiment ID, the start time, the hardware list, the list of involved TinyOS applications (if any), the number of measurements and their corresponding settings, etc. Moreover, for those applications that utilize the flash memory for logging, IRIS provides a utility for automatically offloading the flash content of a node. The resulting offloaded data is directly associated to the current active measurement.
Customized Logging IRIS provides a flexible and convenient mechanism allowing the user to customize the logging format. The user can define an application-specific format for every incoming or outgoing message. Together with the Data Processing Unit, it is possible to define functions to directly manipulate collected raw
data and to store the end result to a log file freely. This bypasses the step of raw data storing and therefore greatly increases the efficiency.
Data Collection and Interaction with Deployed Systems. The second feature of IRIS allows user interactions with the deployed data sources in both directions, i.e., collecting data from the running system and sending command messages to the network in order to control the data flow. Such interaction requires the knowledge of the message structures. IRIS allows the user to extend the message set by defining new message structures with the templates generated by the TinyOSMessage Interface Generator(MIG) tool.
link, through which IRIS parses and logs the data. IRIS requires a specific log format for this task, which can be replaced if necessary with a format specific to the involved application.
Furthermore, IRIS allows the interaction with customized middleware solutions for data collection. To convert incoming messages from a specific format into the format internally used by IRIS, a user has to implement a customized middleware adapter. This adapter is automatically loaded by IRIS during runtime using the Adapter Loader. Messages arriving at loaded adapters can then be added to the Data Model. With this feature, IRIS is effectively capable of merging heterogeneous information gathered from any input source. Once messages are translated from the appropriate adapter, they can be merged in single data models and processed independently from the specific data source. For example, we could conceive using IRIS to calibrate environmental readings collected from a deployed sensor networks with measurements taken from satellites or other remote sensing technologies. In this manner, we were able to effectively integrate IRIS with the PLANET Framework as discussed in more details in Section6.
System Interaction IRIS allows the user to control the experiment flow and to interact with the deployed WSN by dispatching the arbitrary user-defined AM messages. Such feature is advantageous for adjusting experiment parameters and for program debugging. To send a message to the WSN, the user needs to connect IRIS with one or more base stations, and to specify three parameters: the message template (type), the attribute values and the base station responsible for sending the message. When configured with the message template, IRIS creates its message instances and serializes them in binary form for sending. IRIS is then only responsible to transfer the generated messages to the base station. Once transferred, the messages can be handled on the base station by custom data dissemination or over-the-air firmware updates protocols, e.g., Deluge [31], depending on the services running in the specific WSN deployed. A similar approach allows the interaction with custom middleware platforms by providing an appropriate interaction adapter. Moreover, if more than one adapter is provided, the user can define the active outgoing adapter for each message individually. This feature enables the integration of networks based on alternative operating systems or different hardware platforms. Also considering the independence from the protocols used inside the network for data gathering or dissemination, IRIS is effectively decoupled from the specifics of the deployed systems with which it interacts.
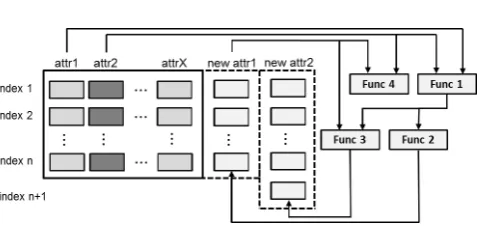
Figure 2. Different types of composition functions in IRIS
Processing and Analysis. IRIS provides an innovative way for extending its processing capabilities by flexibly defining application-specific functions for processing data at the packet level. These functions can be applied to collected data during runtime or a posteriori. Such feature is especially useful for runtime data analysis, application debugging and customized logging. In IRIS, a function is created via the definition of a function template, which specifies the number of input attributes (ports) and the number of static configuration values. The user can initiate a function instance by wiring
the target attributes to the input ports and deciding on the constant values during/after the experiment. Currently, IRIS provides a rich set of function templates for data processing. However, the user can easily extend it with user-defined templates written in Java. With such feature, the user can use IRIS not only merely as a data processing tool but also as a building block for complex WSN application development.
It is worth noting that IRIS’ function template has a unique feature that distinguishes IRIS from other data processing tools. That is, it iscomposable, meaning that the function template can take inputs as attributes that are either converted from the message template or created by other function templates. Figure 2 depicts the flexible composability of the function templates. For instance, a function instance can take message attributes as inputs (Func 1); one can have a function output as input and create a new attribute (Func 2); an instance as Func 3 can take as input a function output and a newly created attribute, outputting a new attribute of a size different from the input, e.g., used for prediction. Func 4 shows a function template that takes two attributes as input but does not generate any new output. Usually this kind of functions can be used for monitoring or controlling purposes (e.g. for sending conditional messages into the network by using th Communication and Interaction module). With composable function templates, the user can implement a variety of data processing algorithms that directly access the data without redundant storing and retrieving for further processing, and thus can obtain processed results with less storage resources and significantly reduced time.
IRIS: Eÿcient Visualization, Data Analysis and Experiment Management for Wireless Sensor Networks
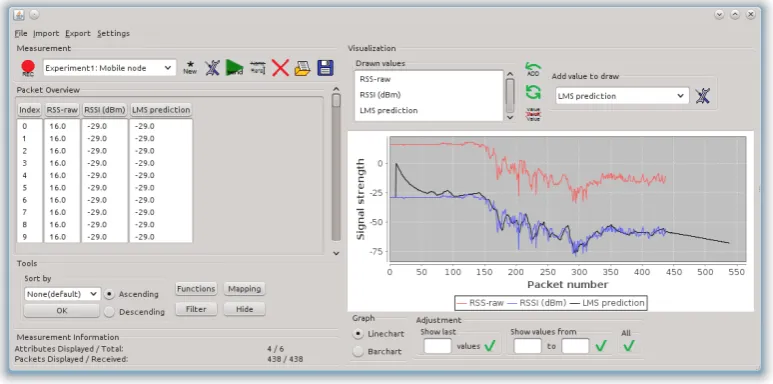
Figure 3. The graphical user interface of IRIS with packet- and chart view, showing the result of a conversion and a prediction function
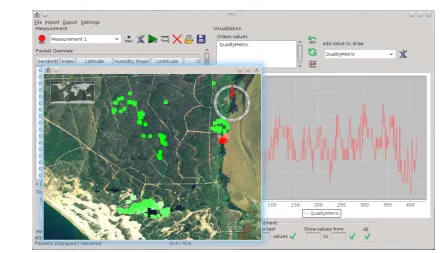
Visualization and User Control Interface. The visualization and user control interfaces are basic and yet important features for a tool like IRIS. The provided base user interface of IRIS consists of several parts for the user input and for visualizing the experiment data. Figures3and4show snapshots of the main graphical user interface (GUI) of IRIS. Through the IRIS’ GUI, the user can perform experiment management, including creating an experiment profile, initiating data collection, sending control messages, store/load the experiment data, defining the function instances for data processing, etc. For each measurement, IRIS first displays general information about the measurement. When the data is available, the Packet View displays the content of the messages based on their attributes and can be customized to only show required attributes. Additionally, IRIS is integrated with JFreeChart, a library for generating line charts or bar charts in a graph view. It allows the user to zoom into the chart, to save pictures of generated charts and to change the scale of the view for a better visualization of any attribute. Moreover, IRIS provides a map view based on the Worldwind Java SDK for the visualization of spatial data, as shown in Figure 4. Like the graph view, the map view allows zooming and saving pictures of the displayed area.
Finally, the modularity of the IRIS architecture allows the developer to use the different components, e.g., for processing, logging, or visualization, as building blocks for a customized user interface. Given that IRIS already provides the majority of the common features in properly encapsulated modules, the developer exclusively needs to focus on the code necessary to interconnect the different functionalities together depending on the specific application requirements.
This features becomes even more relevant considering that user requirements for these systems typically evolve over time; the design of IRIS supports the developer through the reusability and extensibility of its components.
4. Usage
With the above features, IRIS supports the user to perform tasks in the different experiment phases: pre-experiment,runtimeandpost-experiment. In addition, the basic functions employed in these different phases can be combined to produce a predefineduser interface.
4.1. Pre-Experiment Phase
In this phase, the user can use IRIS to perform the following four tasks.
Automatically Installing Applications To automate application installation, the user needs to provide two configuration files, which specify a list of application node IDs with the TinyOS applications to be installed, and a list of the IDs with their hardware addresses, respectively. IRIS also provides utilities to generate these lists easily. Once both lists are available, the user can attach any number of nodes to the USB ports and start an automated application installation.
Figure 4. The graphical user interface of IRIS with map view
Listing 1. A user-defined CC2420 RSSI conversion function template
public f l o a t[ ] computeData (f l o a t[ ] [ ] val ,
f l o a t[ ] s e t ) {
f l o a t[ ] r e s u l t = new f l o a t[ v a l [ 0 ] . l e n g t h ] ;
f o r(i n t i = 0 ; i < v a l [ 0 ] . l e n g t h ; i + + ) {
f l o a t rawReading = v a l [ 0 ] [ i ] ;
f l o a t r s s i = rawReading − 4 5 ; r e s u l t [ i ] = r s s i ;
}
return r e s u l t ; }
form, without parsing the message fields. In contrast, the outgoing message structure must be defined, oth-erwise the message values cannot be serialized and therefore cannot be sent. With the message template, each message field is converted to an attribute, which stores the name of a message field together with all of its values. The definition or the type of an attribute is opaque to IRIS. However, such definition can be important for data processing, e.g., indexing the packets by their source ID. Thus, IRIS allowsattribute mapping
to assign attributes with the information type for an experiment. These typed attributes can then be used in functions, e.g., a filtering function based on the node ID as a type. IRIS has already a predefined set of mappings, e.g., the sequence numbers and the source node ID, and this set can be easily extended by the user.
Implementing Customized Function Templates IRIS allows the user to process the experiment data by defining customized function templates, which can be categorized into three types. The first type is the
monitoring function, which produces no output value
but only examines the attribute values of incoming messages. They can be used, e.g., for implementing an alarm function, which displays a warning message when an attribute value reaches a certain threshold. The second type is the scalar function, which only outputs a scalar value. This function is normally used to generate an aggregated result such as Packet Reception Rate (PRR). The last type of functions outputs a new attribute. Most data processing functions fall into this category. Such functions are normally defined to process the original message values in order to generate a new value, e.g., filtering functions and transformation functions. Please note that the size of the output attribute (the number of messages it includes) can outnumber the size of the input attributes. Through this its possible defining functions can be used for prediction and future value estimation as it it necessary for some algorithms related to model driven data acquisition [32]. The newly defined function template must be implemented in Java and the compiled class must be placed in a specific folder so that it is available to IRIS. The user defines the function logic by overriding the method computeData(), which is invoked every time a new packet is received. Listing1
shows an example of a snipped definition of a CC2420 RSSI conversion function template. Independent from the set of customized function templates, IRIS already IRIS: Efficient Visualization, Data Analysis and Experiment Management for Wireless Sensor Networks
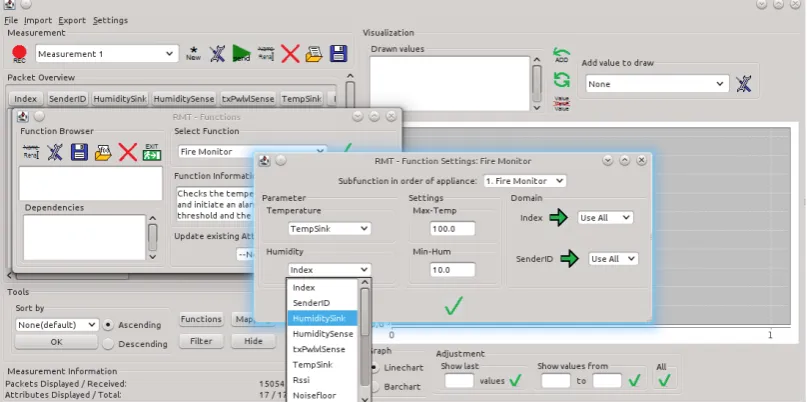
Figure 5. Creating a fire monitoring function instance using attribute mapping
provides a large number of mathematical and WSN specific function templates that can be customized for WSN monitoring and controlling. The predefined set of templates include simple arithmetic functions like addition and subtraction, as well as more complex function templates like a customizable least mean square algorithm for value prediction.
Creating Experiment Profile To initiate an experi-ment in IRIS, the user can create an experiexperi-ment profile, which records logistic information specified by the user regarding a performed experiment. For each experi-ment, IRIS creates a directory holding all generated related files including the application files, log files, etc. If no custom log file is specified, IRIS automati-cally stores the binary and CSV representation of every incoming and outgoing message.
4.2. Experiment Runtime
Once IRIS is configured with the required templates for messages and functions, and with the required experi-ment information, during the experiexperi-ment runtime, the user mainly uses the IRIS GUI to collect, process and visualize the sensory data and to interact with the WSN. After the user starts the data collection process, the incoming messages are first logged in binary, CSV or WiseML format. In addition, the message attributes are automatically displayed in the Packet View (see Figure
3) if the messages can be parsed.
For interacting with the WSN, IRIS allows the user to flexibly send messages in three different ways. First, the user can create a message using the GUI and send it to the network if the message template has been defined. The second option is to use the API
provided by IRIS within a function template. This is the suggested way for defining conditional message, e.g., for WSN monitoring and controlling. The last method is useful when the user intends to introduce a series of messages. IRIS provides a scripting language for specifying sending commands. To perform runtime analysis, the user can create a function instance by selecting the required function template from the GUI. The selected function can then be configured by mapping the input ports to the desired attributes and by defining the constant settings of the function. Figure 5 illustrates an example of creating a fire monitoring function with the specified minimum and maximum temperature thresholds for triggering the alarm.
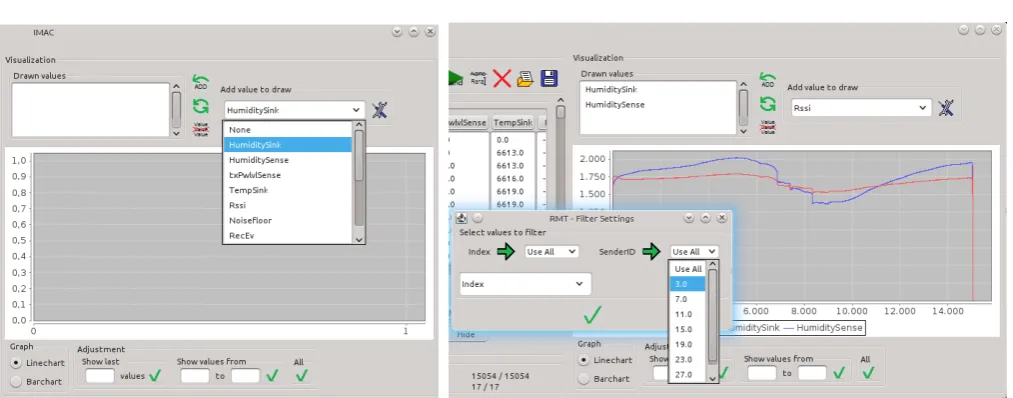
For visualizing the runtime data, IRIS displays attribute values with a line graph or a bar chart. The user can choose the attribute from a pull-down menu as showed in Figure6a to view the change of the attribute values in real time. Furthermore, it is possible to filter the values by the attribute types. Figure 6b shows an example to only display the RSSI values from the node with the ID 3. Alternatively, the user can display location-aware data on a map. To achieve this, the user is required to select the reference longitude and latitude fields.
Figure 6. (a) Adding the attribute “HumiditySink” to the line chart, (b) Applying a filter on the RSSI values for node with ID 3
flash content as a single volume and sends it via the serial port to IRIS. The offloaded data and any logged data can be visualized and processed within the Java GUI. Data can be loaded into different measurements using the following formats: binary, CSV or WiseML. Moreover, it is possible to load the data of two different measurements for comparing the measurements outcomes.
4.4. User Interface
Aside from supporting experimentation with WSNs in real-world environments, IRIS allows the composition of convenient interfaces for the end user to explore data collected by different monitoring systems. Building a coherent application requires the appropriate selection of the building blocks already discussed previously. The flexibility of IRIS allows the developer to reuse, extend, and combine different sets of components to conveniently meet the specific user requirements. When data is collected from a custom middleware, IRIS expects an appropriate user-defined adapter to convert messages from custom formats to one compliant with the structures generated by the TinyOS MIG tool. Messages can then be processed similarly to how described in Section 4.1. Application-specific data processing can be implemented through defined analysis functions, composed accordingly to the user needs. Finally, different views over the data can be selected and combined together to offer the user the possibility to explore the collected data, defining the resulting graphical front-end. Through a complete customization of the views and the appropriate selection of the data to visualize, the resulting interface simplifies the interactions with the system that are possible to the user. At the same time, IRIS can
Listing 2. A user-defined function template for computing the PRR
public f l o a t[ ] computeData (f l o a t[ ] [ ] val ,
f l o a t[ ] s e t ) {
i n t windowSize = (i n t) s e t [ 0 ] ;
f l o a t[ ] r e s u l t = new f l o a t[ v a l [ 0 ] . l e n g t h ] ;
f o r (i n t i = v a l [ 0 ] . length−1; i >= 0 ; i− −) {
i n t c u r r e n t _ s n = v a l [ 0 ] [ i ] ;
i n t count getNumberOfPacketsWithinWindow ( windowSize , c u r r e n t _ s n , v a l [ 0 ] ) ; r e s u l t [ i ] = count / windowSize ;
} }
easily support the developer in satisfying changing analysis requirements that emerge from the study of the gathered data.
5. Experimenting with WSN Protocols: Failure
Detection and Secure Communication
In this section, we address the usability and extensibil-ity of IRIS with two study cases. We now focus on the WSN developer, who can directly benefit from the IRIS’ features supporting experiment management and data processing.
5.1. WSN Failure Detection and Diagnosis System
Wireless sensor networks are especially susceptible to unexpected environmental factors, radio interference, battery depletion and hardware vulnerability. To improve the robustness and reliability of WSNs, we have developed aFailure Detection and Diagnosis System
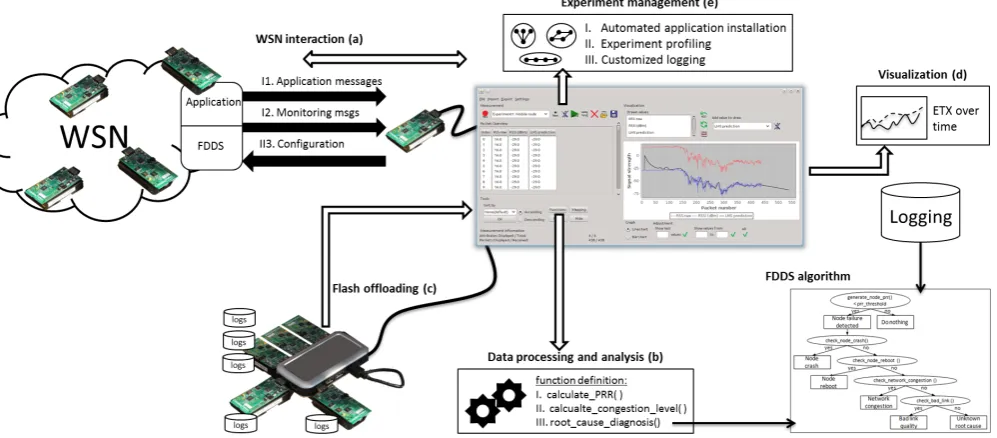
regarding the presence of failures with their possible root causes. The implementation of FDDS integrates IRIS to carry out required operations. Additionally, to evaluate FDDS’ performance, we conduct a set of experiments using IRIS to interact with the network with various parameter settings. Figure 7 illustrates the IRIS-integrated FDDS and IRIS’ support for the experiments.
IRIS-Integrated FDDS. FDDS consists of two parts: (1) a set of 20 TelosB, programmed with TinyOS. Each of those nodes is running an FDDS agent which periodically sends monitoring information; (2) a central control server (running on the PC), which analyzes the data for hardware/network failures and their root causes. FDDS requires collecting application and network monitoring data from the WSN. Thus, FDDS integrates the IRIS’ data collection routine to gather these messages (see Figure 7a,I). Once the data is available, the FDDS control server performs real-time data processing for failure detection, and monitors parameters such as PRR, ETX [33] and the congestion level (cl) [34], which is defined as cl= n(bp)/n(gp), where n(bp) and n(gp) are numbers of packets with and without CRC errors respectively. Each FDDS agent records the values of ETX,n(bp) andn(gp) in its flash and includes these values in monitoring messages regularly sent to the control server. The server is implemented with three IRIS processing functions (see Figure 7b). The first function is called
calculate_PRR(), it computes the PRR for each packet
according to a user defined window size. Listing 2
shows thecomputeData() method of the corresponding function template. The user can set the window size during runtime. The set value is accessible through the first element of the set[] array of the computeData() method. Additionally to the window size, it requires a single attribute as input (the sequence number), which is accessible through the val[][] array. The two other functions are implemented in a similar way. The function calculate_congestion_level() takes two attributes,n(bp) andn(gp), to calculate the value ofcl. The third function,root_cause_diagnosis(), implements the failure detection and the root cause diagnosis algorithms. It takes three attributes, PRR, ETX andcl, as input, and outputs the root cause of the failure as a new attribute if a failure has occurred.
Discussion The integration with IRIS makes the development process of FDDS very efficient. FDDS draws support from IRIS in several aspects. First, with IRIS’ data collection utility, we only need to define the required message types without additional code, and the gathered data is recorded in a customized format for later processing. Since IRIS has covered the typical and yet tedious data collection task, we could focus
our efforts on optimizing the FDDS algorithm. Second, flexible IRIS function definition especially allows us to easily design the above functions to carry out the operations of FDDS. Third, to retrieve data stored in each agent’s local flash, we use the IRIS’ flash offloading utility to automatically download the flash data from all the nodes connected to the USB ports (see Figure 7c). Moreover, the flash data is stored in the customized log in the same format for the runtime messages. Without such feature of IRIS, we would have to manually download the flash data and to write a program for parsing the data and storing it in the correct format. Last but not least, FDDS uses IRIS’ GUI for the user to view the network condition during runtime (see Figure 7d). This feature not only frees us from the GUI implementation but also helps us in debugging and verifying FDDS’ operations in different failure scenarios.
FDDS Experiments. The aim of the experiments is to evaluate the FDDS’ performance on failure detection and root cause analysis. We first would like to know the accuracy of FDDS in identifying these failure causes. Therefore, we simulate 4 root causes of the failures at the nodes: battery depletion, bad link, node crash and node reboot. Moreover, we also study the impact of two different message sending rates (for both application and monitoring messages) on the responsiveness and the performance of FDDS. The experiment runs on the above IRIS integrated FDDS and uses IRIS’ utility for introducing messages to the WSN in order to reconfigure different parameter values for both sending rates (see Figure 7a,II). IRIS manages the experiment profile and stores the collected experiment data in a particularly customized format, sorting with the timestamp and the parameter setting (see Figure 7e). For each experiment run, the result of the response time and the root cause is logged along with the corresponding parameter setting and the measurement profile.
Figure 7. Case 1: The FDDS network integrated with IRIS
same FDDS function filtered by the sensor ID in order to calculate the cl. Furthermore, using the IRIS visualization tool, we can compare different experiment results using a combination of functions and filters and view the results in the graphical charts.
5.2. Secure Communication
In many realistic WSN applications it is fundamental to guarantee confidentiality and/or authenticity of messages exchanged within the network. The issue is that the developer needs to assure confidentiality, integrity or both, while preserving performance of a network of resource constrained sensor devices. In addition, it is a prudent cryptographic engineering practice to periodically refresh cryptographic keys in order to avoid cryptanalysis attacks. Thus, it is important to distribute and refresh cryptographic keys in an efficient manner and to lower the overhead for network performance [35, 36]. To tackle the above issues, we implemented a security architecture to be used in the PLANET project. The PLANET
Security Architecture (PLASA) is composed of three
modules: secure communication, key management and a keyDB for storing cryptographic keys. With these modules, PLASA is used as a transparent layer between the application and the remaining communication layers to secure communications and manage cryptographic keys. PLASA transparency relies on the secure communication module transparency. This module secures communications according to a
security policy, which can dynamically change over time. Further details about this module can be found in [37]. In this study case, we use IRIS as an experiment tool
Listing 3. A user-defined function template for computing the ratio of successfully secured packets
public f l o a t[ ] computeData (f l o a t[ ] [ ] val ,
f l o a t[ ] s e t ) {
f l o a t[ ] r e s u l t = new f l o a t[ v a l [ 0 ] . l e n g t h ] ;
f o r (i n t i = 0 ; i < v a l [ 0 ] . l e n g t h ; i ++) { numberOfPacketCorrectlyReceived = i + 1 ; sequenceNumber = v a l [ 0 ] [ i ] ;
r e s u l t [ i ] = numberOfPacketCorrectlyReceived / sequenceNumber ; }
return r e s u l t ; }
to evaluate the performance of PLASA with different security policies and to study the impact of the rekeying frequency on the number of packets which are discarded because of authentication mismatches.
Figure 8. Case 2: Secure communication experiments using IRIS
measurement (see Figure8a). Different security policies
influence performance with: (1) processing overhead due to security computations, and (2) communication overhead due to extra bytes added to the packet to allow the adversary to recognize the security policy, or because of theMessage Authentication Codeappended to the payload. To know the impact of different policies on WSNs with different number of nodes, we define a processing function calledcalculate_delivery_ratio() to calculate the delivery ratio, which is defined as the ratio between the amount of secured packet transmitted by a sender and the amount of packets correctly received by the base station. By knowing the changes of this ratio, we can derive the overhead introduced by the security policy. Listing 3 shows the computeData() method of this function template. The cumulative delivery ratio at the time of reception of each packet is stored within a single new attribute. In a similar way, we defined another function template called
monitor_discarded_packets() to evaluate the impact of
rekeying (see Figure8b). During the experiment, we use IRIS to send different rekeying messages (Figure8c,II) and to evaluate PLASA’s performance with different policies and to monitor the number of discarded messages using the functions defined previously. The collected messages as well as the changes of the metric values, e.g., the delivery ratio, can be viewed on the IRIS’ GUI (Figure 8d). Finally, the messages are stored in the customized logs for post-experiment data analysis (Figure8e).
Discussion The PLASA experiment demonstrates IRIS’ capability of effective managing a large set of experiment data, runtime WSN interaction, real-time data processing and visualization for result analysis. The experiment requires the sensor nodes to be reconfigured with various security policies. With the
IRIS’ installation tool, we only need to define a script program with a few lines of code and connect the nodes to the USB hubs. Similar to the FDDS experiment, we spend little efforts on collecting experiment data and managing data logs, and only need to define the required message types. The requirement of the PLASA experiment strongly highlights the usefulness of IRIS in runtime data processing. IRIS can calculate the delivery ratio of each node at runtime and provide plots of network performance over time. Note that the impact of the processing overhead on the delivery ratio cannot be evaluated with simulations. Collecting and analyzing a huge amount of experimental data without a tool like IRIS might be very complex. It is worth mentioning that the implementation of the two processing functions only counts for less than 100 lines of code in total. When performing rekeying, IRIS is extremely useful because it allows to periodically inject a rekeying message in the network without re-installing the sensor node programs or forcing sensors to change their behaviour to send rekeying messages. Thus, we force the refresh of the cryptographic key and observe the number of packets that cannot be correctly unsecured during the network transient state, in which nodes do not share the same key. Finally, IRIS allows storing the experimental results to compare them over time, or to collect statistics offline. This is very important because the feature makes it possible to have a deep evaluation of the impact of different security policies.
6. Interfacing with WSN Applications: Horse
Tracking in Doñana
provided by the architecture. This section describes IRIS ability to serve as a data collection client and processing engine for a horse tracking scenario. In contrast to the previous two study cases, we focus on the usage of IRIS for the development of the end user application. In this context, flexibility and usability are of paramount importance: the resulting interface targets users without technical knowledge of the underlying technology, whose requirements may change over time. Moreover, the integration in a real-life application expands the time horizon of the data processing from few controlled experiments to months.
6.1. Horse Tracking in Doñana Biological Reserve
The Doñana protected area, the largest nature reserve in Western Europe, covers 1080 km2 and hosts a unique biodiversity, including many endangered species such as the Spanish imperial eagle (Aquila adalberti) and the Iberian lynx (Lynx pardinus). It is one of the most important wetlands in Europe, as confirmed by its inclusion in the List of Wetlands of International Importance [38] and, in 1994 (extended in 2005), in the World Heritage List [39]. Doñana Biological Reserve (DBR) forms the core of Doñana National Park. The Spanish Ministry of Education and Science recognized DBR as a Singular Scientific and Technological Infrastructure (ICTS) in 2006 [40]. In the reserve, specialized communication infrastructures and scientific equipment, including automated monitoring, allow the observation and study of natural processes and endangered species in the whole Doñana area.
The distribution of animal species among environ-ments and the forces that cause those patterns have been historically subjects of human interest [41]. A bet-ter understanding of the causes, patbet-terns, mechanisms, and consequences of animal movement is relevant to manage protected areas or degraded landscapes [42]. For this reason, high-resolution spatial data on the location and activity of animals is very useful in ecology and conservation biology. In our endeavor, we focus on the Retuerta’s horse, an autochthonous breed managed by the Doñana Biological Station (CSIC). This breed is genetically very distant from other breeds studied so far [43], which makes it particularly interesting. Moreover, researchers and park managers need information about their use of resources because the presence and the foraging impact of this species in the protected area is a controversial issue.
The specific questions we aim at answering relate to spatial ecology, which studies the interaction of individuals of a given species with other conspecifics, other species and with the environment. The main focus is on the identification of spatial patterns and their relationships to ecological phenomena. This type of enquiry requires high-quality information regarding
Figure 9. Data collection process for the horse tracking scenario in Doñana
animal locations and their activities. For this reason, we are mainly interested in temporal data regarding horses’ location and estimated activities. For the latter, accelerometers located at the neck of the horse can offer an indication of the individual’s activity, e.g., lying, grazing, or moving. Finally, an index of the data quality, e.g., GPS “time to fix” or the number of satellites available for a reading, is required to estimate the observation error. Ideally, biologists prefer to take observations with high frequency, as desirable in any study of this type. However, there exist clear tradeoffs between the number of tagged animals and available budget, as well as the number of observations and the system lifetime.
6.2. The PLANET Framework
In the context of the PLANET project, which started in October 2010, we developed a system that auto-matically tracks the position of horses as well as their context. In September 2013 the system was deployed in Doñana Biological Reserve for the Retuerta’s horses with an expected runtime of one year. To achieve these goals, 34 Retuerta’s horses were equipped with special collars during routine veterinary inspections with the animals restrained in a cattle chute. 9 males and 25 females were chosen, belonging to at least three dif-ferent social groups in order to have a representative sample of the DBR Retuerta’s horse population. Each collar encapsulates a sensor node that reads GPS and accelerometer samples every 20 minutes.
manner is made available through the PLANET Platform for online analysis. In addition, each sink maintains a backup of the data as a CSV on an SD-Card; the biologists can then recover this information by physically accessing the devices in the field.
The challenges involved in the monitoring of wildlife in DBR are increased by large areas within Doñana that are flooded during the rainfall season. Relying exclusively on fixed equipment, i.e., static sinks, in these areas is difficult due to the unpredictable amount of rain during the rainfall season. Any permanent installment for communication or data collection could get flooded and damaged. In the project, therefore, UAVs are exploited for data collection and monitoring of environmental phenomena. They can cover large areas and provide real time information during a flight, reaching otherwise inaccessible areas.
As a result, as depicted in Figure 9, data collected from the devices attached to the horses can be provided in two ways to the user:
1. Through the usage of either mobile or static sinks, which receive readings from devices in their proximity and provide it directly to the PLANET Platform;
2. Through the access to the log files stored as CSV on the static sinks and collected directly in the field; Since some static sinks do not have a permanent network connection to the PLANET Platform, this is the only way in which all the data can be retrieved for later visualization and processing.
The result is a complex framework in which highly heterogeneous data sources and collection methods provide various information of the same physical phe-nomena under observation. Accessing and analyzing such data through a uniform and simple interface is the key to make the system usable to the biologists.
6.3. Requirements for Visualization and Processing
Biologists require data represented on a map, possibly a satellite image of the area. For the analysis, the interface should allow the user to select an individual horse and visualize its positions along different dates to see the temporal sequence of observations (from oldest to more recent samples) and to show the movements of different horses in specifics dates. In addition, customized processing function should evaluate the data to identify animals that have not moved for more than a couple of days. This processing can provide information about illness or death of a horse, as well as a missing or lost collar. As a result of this function evaluation, an alarm, e.g., a blinking icon, should visualize in the map the location of the last observed location.In addition, biologists would like to automatically identify outliers with reduced quality. This type of analysis can be based on the “time to fix” value provided by the GPS for each reading. Finally, samples could be aggregated to export information about the areas most visited by a specific set of individuals.
Since several programs are already established for environmental research and tracking scenarios, it is crucial that the data is available in a format common to other programs. In this way, the biologists can also utilize other tools with which they are more familiar. Examples of these tools typically employed by biologists are Microsoft Excel for general purpose analysis, SPSS or R for statistical analysis, and QGIS or ArcGIS as geographic information systems. This requires data to be exported at least as CSV files, which are commonly supported input types for all the aforementioned programs.
6.4. IRIS support
As discussed, the development of the visualization tool employed in the PLANET project for the horse tracking application aims at providing a user-friendly interface for the biologist to visualize, process, and analyze the gathered data from the monitored horses. In order to optimally serve the biologists as a simple to use visualization tool, the interface is customized for the specific user needs and expertise. A simplified GUI provides a more intuitive way of downloading the data from the PLANET system, applying temporal filters and simplifying data accessing and storing. Furthermore the map view is embedded into the customized user interface. This customization process, simplified by the modular architecture of IRIS, results in a reduced subset of the overall basic functionalities in order to simplify the interaction with the data and minimize the tool misuse.
The new user interface of IRIS consists of two parts: the status/filtering panel on the left side and the data panel on the right. The status/filtering panel shows general information about the collection process, e.g., the number of collected packets per each horse collar. Furthermore it allows filtering the data to be displayed on the data panel based either on the observation time or on the corresponding node identifier.
Figure 10. Graph view showing location information of two horses
horses in a map. The positions of a horse can be either depicted as independent circles, or drawn as rectangles where consecutive positions are connected with a line. A decreasing alpha value is just for indicating more current readings. In this way, the path followed by each horse through time can be identified easily. Additionally, IRIS allows exporting and importing filtered or non-filtered data as a CSV file; this allows some part of the analysis to be carried out in external programs, with which the biologists may have more experience. It is however worth noticing that, once the biologists have clearly identified the type of processing to perform on the data, any type of analysis can afterwards be easily integrated in IRIS with the definition of appropriate processing functions.
As depicted in Figure 11c, incoming data can be processed in different ways. First it is converted into corrected GPS readings by using the convert_to_gps() function. This step is necessary since the sensor network does not provide floating point values for GPS readings. The compute_distance() function generates a new attribute, whose value represents the distance each horse traveled between two consecutive sensor readings, using the corrected GPS readings, the timestamps and the node identifiers. This distance attribute is then used as input for thealarm() function, which triggers an alarm if the horse did not move for a certain period of time. The corresponding time and distance thresholds can be defined by the user during runtime. Furthermore the outlier_detection() function takes the computed distance and a quality metric, e.g., the “time to fix” value, as input to evaluate the reliability of each observation. Listing 4 shows
the computeData() method for theoutlier_detection()
function. This function compares a quality metric with a given threshold, whose value can be defined by the user during runtime. The result is then stored in a newly created attribute. Interestingly, IRIS allows
Figure 12. Positions of horse with id 5 in Doñana in October 2013
Listing 4. A user-defined function template for detecting inaccurate GPS readings
public f l o a t[ ] computeData (f l o a t[ ] [ ] val ,
f l o a t[ ] s e t ) {
f l o a t[ ] r e s u l t = new f l o a t[ v a l [ 0 ] . l e n g t h ] ;
f l o a t t h r e s h o l d = s e t [ 0 ] ;
f o r (i n t a = 0 ; a < v a l [ 0 ] . l e n g t h ; a ++) {
i n t o u t l i e r = 0 ;
i n t m e t r i c = v a l [ 0 ] [ a ] ;
i f ( m e t r i c > t h r e s h o l d ) o u t l i e r = 1 ;
r e s u l t [ a ] = o u t l i e r ; }
return r e s u l t ; }
the definition of several function instances, each instantiated with a different quality metric and a specific threshold.
6.5. Discussion
Figure 11. Horse tracking scenario integrated with an adapted graphical user interface of IRIS
collected with different means. This data could then easily be stored locally on the user’s computer using the Data Storage and Recovery module (see Figure
11b). Additionally, this module allowed us to read the CSV-based log files generated by the sinks (see Figure
11c). The Processing and Analysis module enabled us to convert the raw data from the sinks into correct GPS readings (see Figure11d) and to apply an outlier detection function as well as an alarm function. For this reason, it was necessary to write just four user-defined functions, one for each type of processing, which were plugged into IRIS. For visualization, the graph view generated a simple overview of the time series of the collected data, while the map view allowed a deeper analysis. The position of horses could easily be drawn on the map, filtered by date and by node identifier (see Figure11e).
Although IRIS can successfully be used within the PLANET project as the only interface to the frame-work, the biologists still rely on other programs, e.g., Microsoft Excel, SPSS and R for additional investiga-tions on the gathered data. This is required because the developer can hardly foresee all the possible types of analysis of interest to the user. Similarly, allowing the arbitrary definition of processing functions is not necessarily preferable, as it would make the interface more complex and hardly usable. However, as described in Section3.2, IRIS processing capabilities can be eas-ily extended or modified with pluggable user-defined functions. The user would then rely on more complex tools to investigate the type of the analysis to perform on the data, but ultimately use IRIS to implement such analysis and apply it to the collected data.
Compared to the validation scenarios described in Section 5, the horse tracking application involves a larger number of nodes (altogether more than 40
nodes), has a longer time horizon and, consequently, experiences a higher number of information to be processed. This requires a scalable architecture. In fact, depending on the host processing power, the number and the type of applied functions, as well as the logging and visualization tasks active, up to several dozens of thousands packets can be evaluated with constant processing time. Once this limit is reached, the current implementation of IRIS becomes less responsive. We have identified the currently employed data structures as the root cause of this performance issue; more advanced data structures may offer observable performance improvements. However, to counteract this effect, IRIS supports message caching: If the data needs not to be processed at the arrival of every packet, IRIS can be configured to evaluate the function after a specified number of received packets. Interestingly enough, however, we did not meet such performance bottleneck in the application scenarios in which we employed IRIS.
7. Conclusion
the collected data, and ultimately visualizing the raw and processed data. The core contribution of IRIS is its ability to support the definition of user-specific functions for data processing, which can be composed to build complex services based on real-time observations gathered from the real world.
In all our experimental setups and in a real-life complex application IRIS demonstrated its usefulness and effectiveness. This was not only confirmed by developers with technical knowledge of the underlying monitoring system, but also by the biologists who successfully employed IRIS in their analysis of wildlife. Indeed, we firmly believe that a publicly available tool such as IRIS [7] is valuable and its user can gain significant benefits while realizing ubiquitous computing environments. Ultimately, IRIS can bring the monitoring and analysis of physical processes closer to the end user, enabling both the acquisition of new scientific knowledge as well as the optimization of widely applied processes.
Acknowledgments. This work has been partially supported by PLANET, Platform for the Deployment and Operation of Heterogeneous Networked Cooperating Objects, funded by the European Commission under FP7 with contract number FP7-2009-5-257649(www.planet-ict.eu) and by TENACE, Protecting National Critical Infrastructures From Cyber Threats, funded by the Italian Ministry of Education, University and Research, under the PRIN Framework with contract number 20103P34XC (http://www.dis.uniroma1.it/~tenace/)
References
[1] PLAtform for the deployment and operation of heteroge-neous NETworked cooperating objects (PLANET). URL www.planet-ict.eu.
[2] Do ˜nana Biological Reserve. URL http://www.ebd. csic.es.
[3] Figura, R., Jungen, S., Soleymani, R., Shih, C.y. and Marrón, P.J. (2012) Demo Abstract: IMAC, Enabling Flexible Configuration and Result Analysis for Diverse Wireless Sensor Network Experiments. InProceedings of the 9th European Conference on Wireless Sensor Networks (EWSN).
[4] JFreeChart. URLhttp://www.jfree.org/jfreechart/. [5] World Wind Java SDK. URL http://worldwind.arc.
nasa.gov.
[6] Figura, R., Shih, C.Y., Fu, S., Daidone, R., Jungen, S. andMarrón, P.J.(2013) IRIS: A Flexible and Extensible Experiment Management and Data Analysis Tool for Wireless Sensor Networks. In Proceedings of the 4th International Conference on Sensor Systems and Software (S-CUBE).
[7] Open Source Tools for Wireless Sensor Networks. URL http://wsntools.com.
[8] Handziski, V., Köpke, A., Willig, A. and Wolisz, A. (2006) TWIST: A Scalable and Reconfigurable Testbed
for Wireless Indoor Experiments with Sensor Networks.
In Proceedings of the 2nd International Workshop on
Multi-hop Ad Hoc Networks: From Theory to Reality
(REALMAN).
[9] Jiménez, A., Dios, J.M.d., Sánchez-Matamoros, J. and Ollero, A. (2010) Towards an open testbed for the cooperation of robots and wireless sensor networks. In Proceedings of the 10th Conference on Mobile Robots and
Competitions (ROBOTICA).
[10] Srinivasan, K., Kazandjieva, M., Jain, M., Kim, E. and Levis, P. (2008) Demo Abstract: SWAT: Enabling Wireless Network Measurements. In Proceedings of the 8th International Conference on Embedded Networked Sensor Systems (SenSys).
[11] Istomin, T., Marfievici, R., Murphy, A.L. and Picco, G.P.(2014) TRIDENT: In-field Connectivity Assessment for Wireless Sensor Networks. InProceedings of the 6th Extreme Conference on Communication and Computing (ExtremeCom).
[12] Baccour, N., Koubâa, A., Jamâa, M.B., do Rosário, D., Youssef, H., Alves, M. and Becker, L.B. (2011) RadiaLE: A Framework for Designing and Assessing Link Quality Estimators in Wireless Sensor Networks. Ad Hoc Networks9(7).
[13] Matlab. URLhttp://www.mathworks.com/. [14] Octave. URLwww.gnu.org/software/octave/.
[15] The R Project for Statistical Computing. URL www. r-project.org/.
[16] SPSS. URLwww.ibm.com/software/analytics/spss/. [17] SciDAVis. URLhttp://scidavis.sourceforge.net/. [18] LabPlot. URLhttp://labplot.sourceforge.net/. [19] QGIS. URLhttp://www.qgis.org/.
[20] GRASS GIS. URLhttp://grass.osgeo.org/. [21] ArcGIS. URLhttp://www.esri.de/.
[22] Simek, M., Mraz, L. andOguchi, K. (2013) SensMap: Web framework for complex visualization of indoor out-door sensing systems. InProceedings of the International Conference on Indoor Positioning and Indoor Navigation (IPIN).
[23] Ma, L.,Wang, L.,Shu, L.,Zhao, J.,Li, S.,Yuan, Z.and Ding, N. (2010) NetViewer: A Universal Visualization Tool for Wireless Sensor Networks. InProceedings of the
Global Telecommunications Conference (GLOBECOM).
[24] Turon, M. (2005) MOTE-VIEW: A Sensor Network Monitoring and Management Tool. InProceedings of the 2nd Workshop on Embedded Networked Sensors (EmNetS-II).
[25] Buschmann, C., Pfisterer, D., Fischer, S., Fekete, S.P. and Kröller, A. (2005) SpyGlass: A Wireless Sensor Network Visualizer.Special Interest Group on Embedded Systems (SIGBED)2(1).
[26] Dinh-Duc, A.V., Dang-Ha, T.H.andLam, N.A. (2012) Nviz - a general purpose visualization tool for Wire-less Sensor Networks. In Proceedings of the 9th Inter-national Conference on Electrical Engineering/Electronics, Computer, Telecommunications and Information
Technol-ogy (ECTI-CON).
[27] Keller, M.,Beutel, J.,Saukh, O.andThiele, L.(2012) Visualizing Large Sensor Network Data Sets in Space and Time with Vizzly. InProceedings of the 37th Conference on
Computer Networks Workshops (LCN Workshops).
[28] Cao, T.M., Bellata, B. and Oliver, M. (2014) Design of a generic management system for wireless sensor networks.Ad Hoc Networks20(0).
[29] Jurdak, R.,Ruzzelli, A.,Baribirato, A.andBoivineau, S. (2009) Octopus: Monitoring, Visualization, and Control of Sensor Networks.Wireless Communication and Mobile Computing11(8).
[30] TinyOS. URLhttp://www.tinyos.net/.
[31] Hui, J.W. and Culler, D. (2004) The Dynamic Behavior of a Data Dissemination Protocol for Network Programming at Scale. In Proceedings of the 2nd International Conference on Embedded Networked Sensor Systems (SenSys).
[32] Deshpande, A.,Guestrin, C.,Madden, S.,Hellerstein, J.andHong, W.(2004) Model-Driven Data Acquisition in Sensor Networks. InProceedings of the 30th Interna-tional Conference on Very Large Data Bases (VLDB). [33] Gnawali, O., Fonseca, R., Jamieson, K., Moss, D.and
Levis, P.(2009) Collection Tree Protocol. InProceedings of the 7th International Conference on Embedded Networked Sensor Systems (SenSys).
[34] Ramanathan, N., Chang, K., Kapur, R., Girod, L., Kohler, E. and Estrin, D. (2005) Sympathy for the Sensor Network Debugger. In Proceedings of the 3rd international conference on Embedded networked sensor systems (SenSys).
[35] Dini, G.andSavino, I.M.(2011) LARK: A Lightweight Authenticated ReKeying Scheme for Clustered Wireless
Sensor Networks. Transactions on Embedded Computing Systems10(4).
[36] Dini, G.andTiloca, M.(2013) HISS: A HIghly Scalable Scheme for Group Rekeying.The Computer Journal56(4). [37] Daidone, R.,Dini, G.andTiloca, M.(2013) STaR: Secu-rity Transparency and Reconfigurability for Wireless Sensor Networks programming. InProceedings of the 2nd International Conference on Sensor Networks (SENSOR-NETS).
[38] The Ramsar List of Wetlands of International
Importance. URL http://www.ramsar.org/cda/
en/ramsar-documents-list/main/ramsar/1-31-218_
4000_0__.
[39] World Heritage List. URLhttp://whc.unesco.org/en/ list/685.
[40] Singular Scientific and Technological Infrastructure (ICTS). URLhttp://icts.ebd.csic.es.
[41] Morrison, M., Marcot, B. and Mannan, W. (2006) Wildlife-Habitat Relationships: Concepts and Applications (Island Press).
[42] Nathan, R.andGetz, W. (2008) A movement ecology paradigm for unifying organismal movement research. National Academy of Science of the United States of America (PNAS).