© IJEDR 2018 | Volume 6, Issue 2 | ISSN: 2321-9939
IJEDR1802080
International Journal of Engineering Development and Research (www.ijedr.org)
460
Predicting Diabetes Mellitus using Data Mining
Techniques
Comparative analysis of Data Mining Classification Algorithms
1J. Steffi, 2Dr.R.Balasubramanian, 3Mr.K.Aravind Kumar, 1M. Phil Student, 2HOD, 3Assistant Professor,
Computer Science and Engineering, MS University, Tirunelveli, India
____________________________________________________________________________________________________
Abstract— Diabetes is a chronic disease caused due to the expanded level of sugar addiction in the blood. Various automated information systems were outlined utilizing various classifiers for anticipate and diagnose the diabetes. Data mining approach helps to diagnose patient’s diseases. Diabetes Mellitus is a chronic disease to affect various organs of the human body. Early prediction can save human life and can take control over the diseases. Selecting legitimate classifiers clearly expands the correctness and adeptness of the system. Due to its continuously increasing rate, more and more families are unfair by diabetes mellitus. Most diabetics know little about their risk factor they face prior to diagnosis. This paper explores the early prediction of diabetes using data mining techniques. The dataset has taken 768 instances from PIMA Indian Diabetes Dataset to determine the accuracy of the data mining techniques in prediction. Then we developed five predictive models using 9 input variables and one output variable from the Dataset information; we evaluated the five models in terms of their accuracy, precision, sensitivity, specificity and F1 Score measures. The purpose of this study is to compare the performance analysis of Naïve Bayes, Logistic Regression, Artificial neural networks (ANNs), C5.0 Decision Tree and Support Vector Machine (SVM) models for predicting diabetes using common risk factors. The decision tree model (C5.0) had given the best classification accuracy, followed by the logistic regression model, Naïve Bayes, ANN and the SVM gave the lowest accuracy
IndexTerms—Data mining, Prediction, Naïve Bayes, Logistic Regression, C5.0 Decision Tree, Artificial Neural Networks (ANN) and Support Vector Machine (SVM).
_____________________________________________________________________________________________________
I. INTRODUCTION
Diabetes is a dangerous disease with the potential to cause a worldwide Health Care crisis. According to International Diabetes confederation 382 million people are living with diabetes world wide. By 2035, this will be doubled as 592 million. Early prediction of diabetes is quite challenging task for medical practitioners due to complex interdependence on various factors. Diabetes affects human organs such as kidney, eye, heart, nerves, foot etc. Data mining is a process to extract useful information from large database. It is a multidisciplinary field of computer science which involves computational process, machine learning, statistical techniques, classification, clustering and discovering patterns.
Data Mining
Data Mining is the process of discovering interesting knowledge, such as patterns, associations, changes, anomalies and significant structures, from large amounts of data stored in databases, data warehouses, or other information repositories. Due to the wide availability of huge amounts of data in electronic forms, and the imminent need for turning such data into useful information and knowledge for broad applications including market analysis, business management, and decision support, data mining has attracted a great deal of attention in information industry in recent years.
Diabetes
Diabetes Mellitus (DM) is commonly referred as Diabetes; it is the condition in which the body does not properly process food for use as energy. The pancreas, an organ make a hormone called insulin to help glucose get into the cell of our bodies.
Types of Diabetes
Type 1 Diabetes is called insulin-dependent diabetes mellitus (IDDM) or juvenile-onset diabetes.Type1 mostly occurs in young people who are below 30 years. In Type 1 Diabetes, the beta cell of the pancreas, which are in charge for insulin production, are destroyed due to autoimmune system.
Type 2 Diabetes is called non-insulin-dependent diabetes mellitus (NIDDM) or adult-onset diabetes. In the type 2 diabetes, the pancreas usually produces some insulin the amount produced is not enough for the body's needs, or the body's cells are resistant to it.
Gestational Diabetes is the third major form and occur when pregnant women without a previous account of diabetes develop a high blood glucose level. The majority of gestational diabetes patients can control their diabetes with exercise and diet. Between 10% to 20% of them will need to take some kind of blood-glucose-controlling medications. In few cases this gestational diabetes may lead to type 2 diabetes in future. It affects on 4% of all pregnant women.
IJEDR1802080
International Journal of Engineering Development and Research (www.ijedr.org)
461
Medical data can be trained using data mining techniques to predict the diabetes. For this, dataset has to be preprocessed to remove noisy and fill the missing values. Pima Indian Diabetes Dataset is taken to evaluate data mining Classification. The dataset comprises 9 attributes and 768 instances.
II. LITERATUREREVIEW
Design of prediction models for diabetes diagnosis has been an active research area for the past decade. Most of the models found in literature are based on Classification Algorithms and artificial neural Networks (ANNs). Some of the research papers that reviewed for this research are given below:
AiswaryaIyer, et al. [1] have employed Decision tree (J48), Naïve Bayes algorithms for predicting diabetes. They used Pima Indian Diabetes dataset; it was implemented using WEKA tool. They found Naive Bayes algorithm gave 79.56% accuracy than another for predicting diabetes.
V.AnujaKumari, R.Chitra, [12] used SVM with Radial Basis Function Kernal for classification of diabetes disease. They used MATLAB, R2010a for implementation. They found the accuracy rate as 78%.
N. Sarma, et al. [2] used Bayesian net classifier and decision tree for Predicting Diabetes Type 2. They used PIMA indian diabetic dataset.They used WEKA tool for their implementation in that they found bayes net classifier gives the accuracy level of 71-74% depending upon the number of cross validation applied on the dataset when performing the test.and decision tree gives the accuracy level of 78-80% Which is the best accuracy without implementing any neural network structure.
P.Padmaja et al. [3] used clustering concepts for character evaluation of diabetes. They evaluated 5 different clusters by using 4 algorithms, namely 1) K-means, 2) Partitioning Around Medoids(PAM), 3) Minimum spanning tree (MST), 4) Nearest Neighbours used to identify good quality clusters. The result they found was, PAM provides cluster of good quality.
G.Parthiban, S.K.Srivatsa [4] used Naïve Bayes, SVM Techniques for Diagnosing Heart Disease for Diabetic Patients. They used WEKA tool and got the result as 94.6% of accuracy for SVM.
Dr. M. Renuka Devi andJ. Maria Shyla[8] explored various Data mining techniques such as Naïve Bayes, MLP, Bayesian Network, C4.5 , ANN, Modified J48, etc…They used MATLAB and WEKA tool. In that paper, Modified J48 classifier gave 99.87% of highest accuracy.
RupaBagdi et al. [5] compared ID3 and C4.5 decision tree algorithm results. Finally they found C4.5 was more precise than ID3.
Sadri sa’di et al.[6] used Naive Bayes, RBF Network and J48 datamining algorithms for diagnosing type II diabetes. They used WEKA tool. Finally they found Naive Bayes, having the accuracy rate of 76.96% than other algorithms.
Sankaranarayanan.S et al. [7] intended to discover the hidden knowledge from a particular dataset to improve the quality of health care for diabetic patients.
Satheeskumar.B, Gayathri.P, [9] used Data mining Classification Algorithms such as CART, J48, NBTree for Analysis of Adult - Onset Diabetes. They used WEKA tool for implementing these algorithms. They found the accuracy rate as 80% for J48 algorithm when compared to other algorithms.
Tahani Daghistani and RiyadAlshammari, [10] used MNGHA, saudhi Arabia dataset to predict diabetic patients using 18 risk factors. They found RandomForest achieved the best performance when compared to other data mining classifiers.
V. Kumar and L. Velide,[11] used Data mining Approach for Prediction and Treatment Of diabetes Disease. The techniques they used as Naïve Bayes, JRip, J48 (4.5), DT, NN .They used WEKA tool for implementation. They got 68.5% of accuracy level for J48 algorithm.
Ananthapadmanaban et al., [13] developed the SVM and Naïve Bayes classification algorithms for speculating diabetic retinopathy and found out that the Naive Bayes algorithm has got the accuracy rate of 84%.
Ferreira et al., [14] used different classification algorithms like SimpleCart, J48, Simple Logistics, SMO, NaiveBayes and BayesNet for diagnosing neonatal jaundice in type1 diabetes. Among all algorithms, it was found that Simple Logistics as the best algorithm.
The paper [15] approached the aim of diagnoses by using ANNs and demonstrated the need for preprocessing and replacing missing values in the dataset being considered. Through the Modified training set, a better accuracy was achieved with lesser time required for training the set
Mukesh kumari and Dr. Rajan Vohra [16] worked on the concept of data mining is to extract knowledge from information stored in dataset and generate clear and understandable description of patterns. The techniques are attributes selection, data normalization and then classifier is applied on data set to construct Bayesian model. Bayesian network classifier was proposed for the prediction of person whether diabetic or not.
Srideivanai Nagarajan and R.M. Chandrasekaran[17] proposed a method for improvement of iagnosis of gestational diabetes with data mining techniques. Also they Analyse the performance of ID3, Naïve Bayes, C4.5, and Random tree i.e. the algorithm for supervised Learning. They used the data set of Pregnant Womens. The results they found that Random tree served to be the best one with higher accuracy and least error rate.
K.Rajesh and V.Sangeetha[20] proposed that data mining relationship for efficient classification they applied data mining techniques to classify diabetes clinical data and predict the patient being affected with diabetes or not. They applied C4.5 Algorithm gave classification rate of 91%.
Dr. B .L. Shivkumar and S Thiyagarajan c et al (2016), In this work [19], an effective machine learning algorithm is proposed for the classification of type dm patients. This machine learning algorithm used for classification will find the optimal hyper-plane which divides the various classes.
IJEDR1802080
International Journal of Engineering Development and Research (www.ijedr.org)
462
delivered by intelligible SVM’s for the prediction of diabetes, with prediction accuracy of 94%, sensitivity of 93%, and specificity of 94%.III.METHODOLOGY
NAÏVE BAYES
The Naïve Bayes Algorithm is a probabilistic algorithm that is sequential in nature, following steps of execution, classification, estimation and prediction. For finding relations between the diseases, symptoms and medications, there are various data mining existing solution, but these algorithms have their own limitations; numerous iterations, binning of the continuous arguments, high computational time, etc. Naïve Bayes overcomes various limitations including omission of complex iterative estimations of the parameter and can be applied on a large dataset in real time. The Naïve Bayes formula shown in Fig 1
Fig 1. Naïve Bayes Formula DECISION TREES C5.0
Decision tree is a tree structure. It is in the form of a flowchart. It is used as a method for classification and prediction using nodes and internodes. The root and internal nodes are the test cases that are used to separate the instances with different features. Leaf nodes denote the class variable.
C5.0 Algorithm
C5.0 offer a number of improvement on C4.5. They are: • Speed - C5.0 is much quicker than C4.5
• Memory usage - C5.0 is added memory proficient than C4.5
• Smaller decision trees - C5.0 gets alike results to C4.5 with significantly smaller decision trees. • Support for boosting - Boosting improve the trees and give them further precision.
• Weighting - C5.0 allow you to weight diverse cases and misclassification types.
• Winnowing - a C5.0 option repeatedly winnows the attributes to eradicate those that may be unsupportive.
LOGISTIC REGRESSION
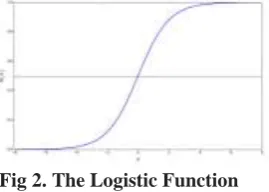
The logistic function is also called as the sigmoid function and it is developed by statisticians to describe the properties of population growth in ecology, that rising quickly and maxing out to the carrying capacity of the environment. It is an S-shaped curve that can obtain any real-valued number and mapped into the values between 0 and 1.
1 / (1 + e^-value)
where e denotes the base of the natural logarithms and the value is the actual numerical values that we want to transform. Below is the plot of the number between -5 and 5 that transformed between the range 0 and 1 using the logistic function.
Fig 2. The Logistic Function
Logistic regression which uses an equation that are very much similar to linear regression. Input value (x) is combine linearly using the weights or the coefficient values (referred as the Greek letter Beta) to predict the output value (y). It’s difference from linear regression is an output value is being modeled as a binary value (0 or 1) rather than the numeric values. Below is an example of logistic regression equation:
y = e^(b0 + b1*x) / (1 + e^(b0 + b1*x))
IJEDR1802080
International Journal of Engineering Development and Research (www.ijedr.org)
463
ARTIFICIAL NEURAL NETWORK (ANN)
Artificial Neural network is normally organized into layers. Layers are made of lots of interconnected ‘nodes’ that includes an ‘activation function’.
Fig 3. Artificial Neural Network
A neural network may include the following 3 layers:
• Input layer – The activities of the input unit is to represent the unrefined information that can given into the network. • Hidden layer – To decide the activity of each hidden unit. The activities of the hidden units and their weights on the connection that are lie between the input and the output units. There might be one or more hidden layers in a network. • Output layer – The activities of each output units are depends upon the activities of the hidden units and their weights
between the hidden and output units.
SUPPORT VECTOR MACHINE(SVM)
(a) Introduction
Support Vector Machine is based on the concept of hyperplanes that define the decision boundaries. A hyperplane is one that separates between the set of objects that having different class members. A schematic example is given in the illustration below. In this example, the objects are belong to either class GREEN or RED. The separating line defines the boundary on the right side of which all the objects are GREEN and to the left of which all the objects are RED.
Fig 4. Support Vector Machine
(b) Technical Notes
Support Vector Machine is a classifier method that perform classification task by constructing the decision planes in a multi-dimensional space that separates the case of diverse class labels. SVM supports regression and classification tasks, that can handle multiple continuous and the categorical variables. For the categorical variables, dummy variable is created with case values either 0 or 1. Thus, a categorical dependent variables consists of three levels, say (A, B, C), is represented as a set of three dummy variables:
A: {1 0 0}, B: {0 1 0}, C: {0 0 1}
To construct the optimal hyperplane, SVM employs an iterative training algorithm, which is used to minimize the error function. According to the form of error function, SVM models can be classified into four distinct groups:
▪ Classification SVM Type 1 (also known as C-SVM classification)
▪ Classification SVM Type 2 (also known as nu-SVM classification)
▪ Regression SVM Type 1 (also known as epsilon-SVM regression)
▪ Regression SVM Type 2 (also known as nu-SVM regression) (c) Classification SVM
CLASSIFICATION SVM TYPE 1
For this type of Classification SVM Type I, training phase involves the minimization of error function:
subjects to the constraint:
where C denotes the capacity constant, w denotes the vector coefficients, b denotes the constant, and represents the parameter for handling non separable data (inputs). The index i labels the N training cases. Note that represent the class labels and xi represent the independent variables. The kernel is used to transform the data from input (independent) to the feature space. It is ought to be noted that larger the C, the more error is penalize. Thus, C is ought to be chosen with care to avoid over fitting.
CLASSIFICATION SVM TYPE 2
In contrast to Classification SVM Type 1, the Classification SVM Type 2 model minimizes the error function:
IJEDR1802080
International Journal of Engineering Development and Research (www.ijedr.org)
464
In a regression SVM, you have to estimate the functional dependence of the dependent variable y on a set of independent variables x. It assumes, like other regression problems, that the correlation between independent and dependent variables is given by a deterministic function f plus the addition of some additive noise:
(d) Regression SVM REGRESSION SVM TYPE 1
For this type of Regression SVM Type1, the error function is given as :
which we minimize the subject to:
REGRESSION SVM TYPE 2
For this type of Regression SVM Type2, the error function is given by:
which we minimize the subject to:
There are number of kernels that can be used in Support Vector Machine models. These includes linear, polynomial, radial basis function (RBF) and sigmoid models.
(e) Kernel Functions
where that is, the kernel function, that represents the dot product of input data points that is mapped into the multidimensional space by transformation.
IV Performance Evaluation
1. PERFORMANCE METRICS
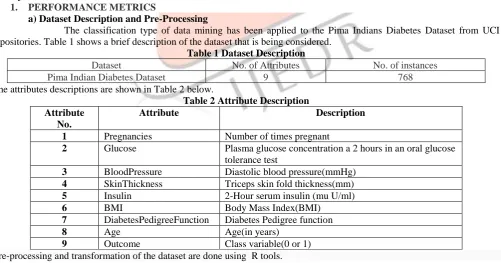
a) Dataset Description and Pre-Processing
The classification type of data mining has been applied to the Pima Indians Diabetes Dataset from UCI repositories. Table 1 shows a brief description of the dataset that is being considered.
Table 1 Dataset Description
Dataset No. of Attributes No. of instances
Pima Indian Diabetes Dataset 9 768
The attributes descriptions are shown in Table 2 below.
Table 2 Attribute Description Attribute
No.
Attribute Description
1 Pregnancies Number of times pregnant
2 Glucose Plasma glucose concentration a 2 hours in an oral glucose tolerance test
3 BloodPressure Diastolic blood pressure(mmHg)
4 SkinThickness Triceps skin fold thickness(mm)
5 Insulin 2-Hour serum insulin (mu U/ml)
6 BMI Body Mass Index(BMI)
7 DiabetesPedigreeFunction Diabetes Pedigree function
8 Age Age(in years)
9 Outcome Class variable(0 or 1)
Pre-processing and transformation of the dataset are done using R tools. Transformation steps include:
• Replacing missing values, and • Normalization of values.
IJEDR1802080
International Journal of Engineering Development and Research (www.ijedr.org)
465
Table 3 Descriptive Statistics of Transformed Dataset
Parameter Minimum Maximum Mean Std. Deviation
Glucose 0 1 0.608 0.161
BMI 0 1 0.477 0.117
DiabetesPedigreeFunction 0 1 0.168 0.141
Age 0 1 0.204 0.196
b) Evaluation of Classifiers Performance Metrics
This paper used confusion matrix to appraise the performance of the five models for incidence of diabetes and five evaluated indices for accuracy, sensitivity, specificity,Precision and F1 Score.
• Accuracy = (TP + TN)/(TP + FP + TN + FN) • Sensitivity = TP/(TP+FN)
• Specificity = TN/(FP+TN) • Precision = TP/(TP+FP)
• F1 Score = (2*Precision*Recall)/(Precision+Recall)
where TP, TN, FP and FN denote true positives, true negatives, false positives and false negatives, respectively. The model with highest the sensitivity, specificity, and accuracy is the best predictive model.
c) Time Calculation
The execution time for each classifier algorithms are calcuted by using the following R Tool command:
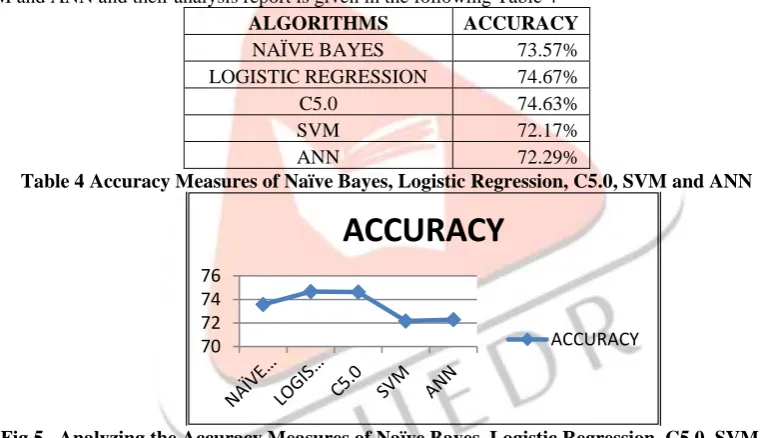
Sys.time( ) 2. PERFORMANCE ANALYSIS OF THE CLASSIFIER a) Accuracy Measures:
The Accuaracy measures of Data mining Classification Algorithms, i.e., Naïve Bayes, Logistic Regression, Decision Tree C5.0, SVM and ANN and their analysis report is given in the following Table 4
ALGORITHMS ACCURACY
NAÏVE BAYES 73.57%
LOGISTIC REGRESSION 74.67%
C5.0 74.63%
SVM 72.17%
ANN 72.29%
Table 4 Accuracy Measures of Naïve Bayes, Logistic Regression, C5.0, SVM and ANN
Fig 5. Analyzing the Accuracy Measures of Naïve Bayes, Logistic Regression, C5.0, SVM and ANN IV.Time Analysis:
The time taken by all the five Data mining Classification Algorithms, i.e., Naïve Bayes, Logistic Regression, C5.0, SVM and ANN are calculated and it is analyzed in the following Table 5
Table 5 Time Taken by Naïve Bayes, Logistic Regression, C5.0, SVM and ANN
70 72 74 76
ACCURACY
ACCURACY
ALGORITHMS TIME ANALAYSIS (in mins)
Naïve Bayes 2.51
Logistic Regression 2.23
C5.0 1.67
SVM 1.89
IJEDR1802080
International Journal of Engineering Development and Research (www.ijedr.org)
466
Fig 6. Analyzing the Time taken by Naïve Bayes, Logistic Regression, C5.0, SVM and ANN V.Other Metric Measures:
The other Metric Measures say Precision, Sensitivity, Specificty and F1 Score measures are also calculated and it is shown in the following Table 6
ALGORITHMS PRECISION SENSITIVITY SPECIFICITY F1 SCORE
NAÏVE BAYES 61.84% 60.2% 80.5% 61.04%
LOGISTIC REGRESSION 69.12% 55.95% 85.52% 61.84%
C5.0 65.3% 65.31% 80% 65.3%
SVM 64.81% 43.75% 87.33% 52.24%
ANN 64.62% 50.6% 84.46% 56.76%
Table 6 Precision, Sensitivity, Specificity and F1 measures of Naïve Bayes, Logistic Regression, C5.0, SVM and ANN
Fig 7 Analyzing the Precision, Sensitivity, Specificity, F1 Score Measures of Naïve Bayes, Logistic Regression, C5.0, SVM and ANN
4 Overall Performance Analysis
The overall performance analysis of Naïve Bayes, Logistic Regression, C5.0, SVM and ANN algorithms are shown in the following Table 7
METRIC MEASURES NAÏVE BAYES LOGISTIC REGRESSION C5.0 ANN SVM
ACCURACY 73.57 74.67 74.63 72.29 72.17
PRECISION 61.84 69.12 65.3 64.62 64.81
SENSITIVITY 60.2 55.95 65.31 50.6 43.75
SPECIFICITY 80.5 85.52 80 84.46 87.33
FI SCORE 61.04 61.84 65.3 56.76 52.24
Table 7. Overall Performance Analysis of Naïve Bayes, Logistic Regression, C5.0, SVM and ANN
Fig 8. Overall Performance analysis of Naïve Bayes, Logistic Regression C5.0, SVM and ANN
V CONCLUSION AND FUTURE ENHANCEMENT 0
2 4 6
TIME ANALYSIS(in mins)
TIME
ANALYSIS(in mins)
0 20 40 60 80 100
PRECISION
SENSITIVITY
SPECIFICITY
F1 SCORE
0 50 100 150 200 250 300 350 400
FI SCORE
SPECIFICITY
SENSITIVITY
PRECISION
IJEDR1802080
International Journal of Engineering Development and Research (www.ijedr.org)
467
1. CONCLUSION
The automatic diagnosis of diabetes is an important real-world medical problem. Detection of diabetes in its early stages is the key for treatment. This paper shows how the Data mining classification algorithms say Naïve Bayes, Logistic Regression, C5.0, SVM and ANN are used to model actual Prediction of Diabetes Mellitus and a comparative analysis are made between them by making use of their Metric Measures say Accuracy, Precision, Sensitivity, Specificity and F1 Score.
As a results of the research work, the C5.0 and Logistic Regression are equally good based on their Accuracy measures, the Naïve Bayes algorithm has the Second highest accuracy, followed by ANN and the most lowest accuracy is predicted in the SVM algorithms.
2. FUTURE ENHANCEMENT
In future it is planned that the work can be extended and improves for the automation of diabetes analysis. In future the diabetes can be prevented using gene analysis from the previous history of the diabetes. Future work will focuses on collecting real time dataset and discover the new potential prognostic elements that are to be incorporated. The Fuzzy Logic can be included in future to diagnoise the diabetes types automatically.
REFERENCES:
[1] Aiswarya Iyer, S. Jeyalatha, Ronak Sumbaly, “Diagnosis of diabetes using classification mining techniques ”, (IJDKP), Vol.5, No.1, January 2015, pp. 1-14.
[2] N. Sarma, S. Kumar, and A. Kr. Saini, “A Comparative Study On Decision Tree And Bayes Net Classifier For Predicting Deabetes Type 2,” IJSRET, 2014.
[3] P. Padmaja, S. Viikkurty, N. I. Siddiqui, P. Dasari, B. Ambica, V. B. V. . VenkataRao, M.ValiShaik, and V. J. P. R. Rudraraju, “Characteristic evaluation of Diabetes data using Clustering Techniques,” IJCSNS, vol. 8, no. 11, Nov. 2008. [4] G. Parthiban and S. K. Srivatsa, “Applying Machine Learning Methods in Diagnosing Heart Disease for Diabetic Patients,” IJAIS, vol. 3, no. 7, 2012.
[5] R. Bagdi and P. P. Patil, “Diagnosis of Diabetes using OLAP and Data mining Integration,” IJCSCN, vol. 2, no. 3. [6] S. sa’di, A. Maleki, R. Hashemi, Z. Panbechi, and K. Chalabi, “Comparison of Datamining Algorithms in the Diagnosis of Type II Diabetes,” IJCSA, vol. 5, no. 5, Oct. 2015.
[7] Sankaranarayanan.S and DrPramanandaPerumal.T, “Predictive Approach for Diabetes Mellitus Disease through Data Mining Technologies”, World Congress on Computing and Communication Technologies, 2014,
[8] Dr. M. RenukaDevi,J. Maria Shyla,”Analysis of Various Data Mining Techniques to Predict Diabetes Mellitus”, International Journal of Applied Engineering Research ISSN 0973-4562 Volume 11, Number 1 (2016)
[9] S. Kumar B and G. P, “Analysis of Adult-Onset Diabetes using Data mining Classification Algorithms,” IJMCS, vol. 2, no. 3, Jun. 2014.
[10] T. Daghistani and R. Alshamimar, “Diagnosis of Diabetes by Applying Data Mining Classification Techniques,” IJACSA, vol. 7, no. 7, 2016.
[11] V. Kumar and L. Velide, “A Data mining Approach for Prediction and Treatment Ofdiabetes Disease,” IJSIT, 2014. [12] V. A. Kumari and R. Chitra, “Classification of Diabetes Disease using Support Vector Machine,” IJERA, Apr. 2013. [13] Ananthapadmanaban KR, Parthiban G. Prediction of chances - diabetic retinopathy using data mining classification techniques. Indian Journal of Science and Technology. 2014 Oct; 7(10):1498–503.
[14] Ferreira D, Oliveira A, Freitas A. Applying data mining techniques to improve diagnoses in neonatal jaundice. BMC Med InformatDecis Making. 2012; 12:143. DOI: 10.1186/1472-6947-12-143.
[15] T.Jayalakshmi and Dr.A.Santhakumaran, “A Novel Approach for Diagnosis of Diabetes Mellitus Using Artificial Neural Networks”, International Conference on Data Storage and Data Engineering, 2010, pp. 159-163.
[16]. Mukesh kumari and Dr. Rajan Vohra,“Prediction of DiabetesUsing Bayesian Network,”in proceeding of International Journal of Computer Science and Information Technologies, vol. 5 , 2014
[17]. S. Nagarajan and R.M.Chandrasekaran, ”Data Mining Techniques for Performance Evaluation of Diagnosis in Gestational Diabetes” in proceedings of International Journal of Current Research and academic Review, vol. 2,No. 10,pp. 91-98.
[18]. J.Tuomilehto, “Prevention of type 2 diabetes mellitus by changes in lifestyle among subjects with impared glucose tolerance”, in proceedings of International Journal of Medical Research, vol. 344,no. 18,pp. 1343-1350, 2001.
[19] Kessler, R. C., et al. "Testing a machine-learning algorithm to predict the persistence and severity of major depressive disorder from baseline self-reports." Molecular psychiatry (2016).