www.orientjchem.org
An International Open Free Access, Peer Reviewed Research Journal
2016, Vol. 32, No. (1): Pg. 601-607
A Stability-Indicating High Performance Liquid
Chromatographic Method For the Determination
of
Nelarabine
S. VIDYADHARA, R. L. C SASIDHAR*, B. VENKATESWARA RAO,
T. SAI BABU and D. LAKSHMI HARIKA
Chebrolu Hanumaiah Institute of Pharmaceutical Sciences, Chandramoulipuram, Chowdavaram, Guntur-522019, India.
*Corresponding author E-mail: [email protected] http://dx.doi.org/10.13005/ojc/320168
(Received: July 16, 2015; Accepted: December 04, 2015)
ABSTRACT
The present study describes the development and validation of stability indicating RP - HPLC method for the estimation of nelarabine, a chemotherapy drug. Nelarabine was subjected to stress studies under different conditions as per ICH guidelines. The separations were carried out using C18 Reverse Phase Column (Cosmicsil Adge 150 x 4.6 mm, 5µm) employing 0.01 % trifluoroacetic acid and acetonitrile (85:15 v/v) as mobile phase at a flow rate of 1.0 mL/min. The wavelength detection was at 266 nm. It was found that nelarabine degrades in alkaline and oxidative conditions, while negligible degradation was observed in acidic, photolytic and thermal conditions. Analytical validation parameters such as specificity, linearity, accuracy, precision were calculated and the relative standard deviation for all the parameters was less than 2%.
Key words: Nelarabine, RP – HPLC, stress studies, ICH guidelines, Analytical validation.
INTRODUCTION
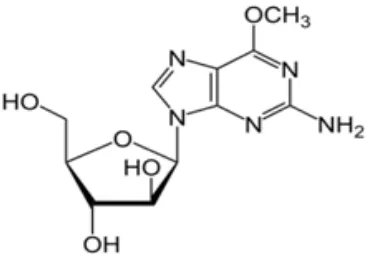
Chemically nelarabine is 2-amino-9-â-D arabinofuranosyl-6-methoxy-9H-purine. It has the molecular formula C11H15N5O5 and a molecular
weight of 297.27. It is slightly soluble in water and melts with decomposition between 209° and 217°
C1. Nelarabine is marketed as ARRANON Injection,
chemotherapy drug used in T-cell acute lymphoblastic leukaemia. It was previously known as 506U78. Nelarabine is a purine nucleoside analog converted to its corresponding arabinosylguanine nucleotide triphosphate (araGTP), resulting in inhibition of DNA synthesis and cytotoxicity2. In October 2005, it was
approved by the FDA for T-cell acute lymphoblastic leukaemia. It was later approved in the European Union in the October of 2005. Complete responses have been achieved with this medication. It is marketed in the US as Arranon and as Atriancein the EU by Glaxo smithkine. International conference on harmonization (ICH) has made mandatory the need of developing stability indicating assay methods for every drug candidates. There stability indicating assay methods helps in establishing the inherent stability of the drug which provides assurance on detection changes in identity, purity and potency of the product on exposure to various conditions. In
the present study nelarabine is exposed to a variety of stress like acidic, caustic, thermal, photolytic and oxidative stress conditions3,4. According to ICH
guidelines the stress testing of the drug substances helps in identifying the likely degradation products, which in turn can help in establishing the degradation pathways and the intrinsic stability of the molecule. The aim of the present work was to develop stability indicating method for determination of nelarabine in presence of its degradation products.
MATERIALS AND METHODS
Nelarabine was received as a gift sample from Aurobindo Pharma limited, Hyderabad. Trifluoroacetic acid, sodium hydroxide, hydrogen peroxide of analytical grades was procured from S.D Fine Chemi. Ltd. HPLC grade methanol acetonitrile and water were purchased from Merck specialities private limited, Mumbai, India. Nelarabine marketed formulation Arranon was procured from Local Pharmacy.
Chromatographic conditions
Agilent HPLC System (1180 series) integrated with variable wavelength programmable UV detector and a Rheodyne injector equipped with 20µL fixed loop was used in the study. The seprations were carried out on a C18 reverse phase column (Cosmicsil Adge 150 x 4.6 mm, 5µm). The column was operated at ambient temperature. The flow rate was 1mL/min. The mobile phase was prepared by mixing buffer (trifluoroacetic acid) and acetonitrile in
Fig. 1: Chemical Structure of nelarabine
the ratio of 85:15 v/v. The mobile phase was filtered using 0.45 µm filter and degassed by ultrasonic vibrations prior to use. An accurately weighed sample (10mg) of nelarabine was transferred to 10ml volumetric flask and dissolved in mobile phase to obtain primary stock solution of strength 1000µg/ mL. 1mL of this solution was transferred to 100mL volumetric flask and made up to the mark with mobile phase to obtain concentration of 10µg/mL. From the standard solutions of nelarabine, appropriate dilutions were made. The standard chromatogram of nelarabine was shown in the figure 2.
The HPLC method was optimized for determining nelarabine in i.v infusion. Different mobile phases were tried but acceptable retention times, theoretical plates and good resolution were observed with 0.01% trifluoroacetic acid and Acetonitrile (85:15 v/v,) with pH 3.0 using Cosmicsil Adge ssC18 column.
Method Validation
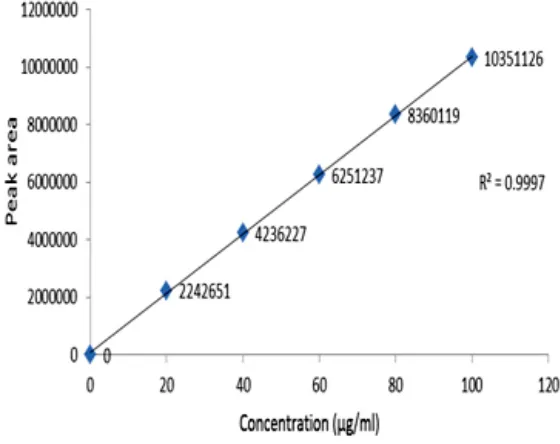
The linearity of the prepared method was studied by injecting different concentrations of the nelarabine prepared in the mobile phase in the range of 20-100µg/mL and the sample solutions were injected into HPLC system and peak areas were recorded. Precision of the method was demonstrated by interday sand intraday variation studies. In the
intraday studies analysis of 100% concentration (100µg of nelarabine) of six replicate injections were done in a day. In the interday variations studies the analysis of the drug was repeated on three consecutive days. Accuracy of the method was determined by recovery experiments. As known quantity of pure drug was added to the preanalysed sample and the contents were reanalysed by the proposed method and percent recovery was reported.
The limit of detection and limit of quantitation were calculated from the slope of calibration curve. There were calculated using the formula involving standard deviation of response and slope of calibration curve. Robustness of the method was determined by carrying out the analysis by altering the conditions of mobile phase composition and flow rate and the effect on the area of peak of intercept and retention times was noted.(5,6)
Fig. 3: Calibration plot of Nelarabine
Table 1: Results From System Suitability Study
Parameters Nelerabine
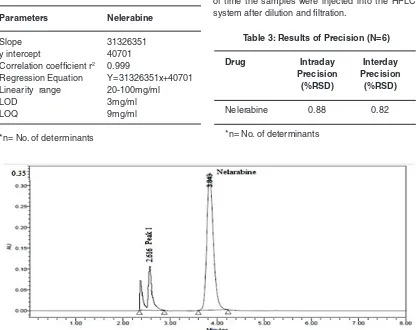
Fig. 4: Chromatogram of alkali degradation Table 2: Results For Linearity(n=6)
Parameters Nelerabine
Slope 31326351
y intercept 40701
Correlation coefficient r2 0.999
Regression Equation Y=31326351x+40701 Linearity range 20-100mg/ml
LOD 3mg/ml
LOQ 9mg/ml
*n= No. of determinants
Table 3: Results of Precision (N=6)
Drug Intraday Interday
Precision Precision
(%RSD) (%RSD)
Nelerabine 0.88 0.82
*n= No. of determinants
Assay of marketed formulation
2µL of sample solution was transferred into 50mL volumetric flask. About 20ml of diluents was added and sonicate for 15 min with occasional shaking, cool to room temperature and dilute to 20mL with diluent. Then 1mL of above solution was transferred into 10mL volumetric flask. The solution was injected three times into the column. The amount present in each vial was calculated by comparing the areas of standards with the test samples.
Stress Degradation by Hydrolysis under Acidic Conditions
For stability studies 2mL of sample was taken from the nelarabine injection solution (250mg/50mL) into a 100mL volumetric flask and diluted up to the mark using mobile phase7,8.
Acid hydrolysis of the drug was carried out in presence of 1.5N HCl. The drug solution was refluxed with 1.5 N HCl for 2hrs. After exposure for the required duration of time the samples were diluted to a concentration of 100µgm/mL with mobile phase and then injected into the HPLC system after filtration.
Stress Degradation by Hydrolysis under Alkaline Conditions
The alkali hydrolysis of the drug was carried out in 0.1N NaOH and refluxing the solution for 8hrs. After exposure the samples were suitably diluted with mobile phase and then injected into HPLC system.
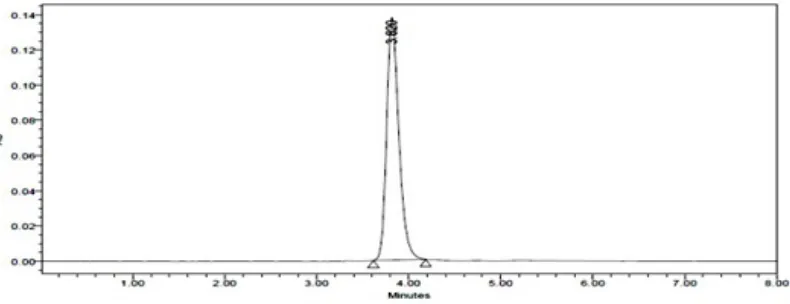
Oxidative Stress
The drug solution was prepared by dissolving 5mL of nelarabine solution in 10mL of 30% hydrogen peroxide and refluxing the solution at 400C for 24hrs. After exposure for required duration
Table 4: Results For Accuracy
Nelarabine
Recovery Amount Added Amount Found % Recovery level (µg/ml) (µg/ml)
Std Test
50% 12 18 30.10 100.54
100% 25 18 59.97 100.15
150% 50 18 88.67 98.72
Mean recovery 98.2-100.54s%w/w
Thermal degradation
Nelarabine sample solution was taken in a volumetric flask and kept in an oven maintained at 700C temperature for 24hrs. Then the sample
solution was dissolved and diluted in mobile phase. From this appropriate dilution was made mobile phase and injected in chromatographic system.
Photo degradation
Same drug molecules undergo degradation upon exposure to light, which need a special storage conditions and protection from light. 5mL of nelarabine sample solution was exposed to ultraviolet lamp in photostability chamber for 2hrs. After exposure the nelarabine sample solution was suitable diluted with mobile phase and injected into stabilized chromatographic condition.
RESULTS AND DISCUSSION
The present study was aimed to develop a validated stability indicating RP- HPLC method for the estimation of nelarabine. After several trails with different mobile phase compositions, the composition of 0.01% trifluoroacetic acid and acetonitrile at 85:15 v/v ratio was optimised as mobile phase for the estimation of nelarabine.
The data obtained from the calibration experiments when subjected to linear – regression analysis showed a linear relationship in peak areas and concentration in the range of 20- 100µg/mL for drug. The equation of the regression line is y = 31326351X+ 40701 with r2 value of 0.999.
The developed method was found to be precise as the %RSD values for intra-day
and inter-day precision studies were found to be less than 2%. The recovery studies obtained at each added concentration, indicating that the method was accurate. Commonly used injectable formulation excipients were subjected to chromatographic analysis and it was observed that there was no interesting peak at the retention times of nelarabine.
The limit of detection of nelarabine was found to be 3µg/mL and limit of quantification was 9 µg/mL respectively thus indicating the sensitivity of the method. While evaluating the robustness, the peak areas of nelarabine were found to vary in + 0.009%, where as the retention was found to vary in the range of 3 to 5 min. The method was roubst as the peak areas and retention time were not significantly affected after varying the parameters like mobile phase composition and flow rate. The values of validation parameters were given in table 1-5.
Nelarabine was found to degrade under alkali. Chromatogram of nelarabine degraded in alkali and oxidative conditions is shown in figure 4 and 5. In alkali conditions the drug peak area decreased sufficiently. No new peaks were seen in the chromatogram of acidic degrade samples of the drug (figure 6) as compared to standard.
Fig .6: Chromatogram of oxidative degradation
CONCLUSION
The HPLC method developed and validated allows a simple and fast quantitative determination of nelarabine from its formulation. All the validation parameters were found to be within the limits
according to the ICH guidelines. The proposed method was found to be specific for the drugs of interest irrespective of the excipients present and the method was found to be simple, accurate, precise, rugged, and robust and can be involved in the routine analysis of the marketed formulation.
Table 5: System Suitability Data For Robustness Studies
Parameters (n=3) Nelerabine
Changing mobile phase ratio 5% 1.02 more organic solvent
Changing mobile phase ratio 5% 0.99 less organic solvent
Flow rate 0.9ml/min 0.98
Flow rate 1.1ml/min 0.86
Table 6: Results for Assay
Drug Label claim Amount % Amount
(mg/tab) recovered found in drug
Nelerabine 250 232 99.9%w/w
Thus the study shows that nelarabine undergoes degradation in alkaline and slight degradation in oxidative conditions where as it is relatively stable when exposed to acidic, dry heat and photolytic conditions. The developed RP-HPLC method was found to be simple, rapid, sensitive, accurate, precise and specific for the estimation of nelarabine in bulk and pharmaceutical dosage forms. This method may be used to assay of the product in stability studies.
REFERENCES
1. Nelarabine injection drug profile and pharmacokinetic information, from website http://www.druginformation.com/RxDrugs/N/ Nelarabine Injection.htm accessed on 08/01/2013.
2. Katzung BG. Cancer chemotherapy. In: Basic and clinical pharmacology,. New York: McGraw Hill Medical; 2004. 9. 909-10. 3. ICH, Stability testing of new drug substances
and products. Geneva: Inter national Conference on Harmonization. IFPMA,
2003.
4. ICH, Q1A, Stability Testing of New Drug Substances and Products. In: Proceedings of the Inter national Conference on Harmonisation, Geneva, October, 1993.
5. ICH, Q2A, Hamonised Tripartite Guideline, Test On Validation of Analytical Procedures,
IFPMA. In: Proceedings of the International Conference on Harmonization, Geneva, March, 1994. 23.
6. ICH, Q2B, Hamonised Tripartite Guideline, Validation of Analytical Procedure: Methodology, IFPMA, In: Proceedings of the International Conference on Harmonization, Geneva, March, 1996.
7. Mallikarjunarao B, Arpita C, Srinivasu MK, Lalithadevi M, Rajenderkumar P, Chandrasekhar KB, Srinivasan AK, Prasad AS and Ramanatham J, A stability indicating HPLC assay method for docetaxel. J Pharm and Biomed Anal. 2006; 41: 676-681. 8. Stokvis E, Rosing H, Beijen JH. Liquid
chromatography-mass spectrometry for the quantitative analysis of anticancer drugs.