http://www.sciencepublishinggroup.com/j/ajetm doi: 10.11648/j.ajetm.20200504.12
ISSN: 2575-1948 (Print); ISSN: 2575-1441 (Online)
Performance Evaluation of Housing Construction Project,
Using Earned Value Analysis; the Case of 20/80
Condominium Addis Ababa Bole Arabsa Site
Medhanit Gerawork Jembere
1, *, Bahiru Bewket Mitikie
2, Eyerusalem Kelemework Yigzaw
11Construction Technology and Management Department, Debre Berhan University, Debre Birhan, Ethiopia 2Department of Civil Engineering, Adama Science Technology University, Adama, Ethiopia
Email address:
*
Corresponding author
To cite this article:
Medhanit Gerawork Jembere, Bahiru Bewket Mitikie, Eyerusalem Kelemework Yigzaw. Performance Evaluation of Housing Construction Project, Using Earned Value Analysis; the Case of 20/80 Condominium Addis Ababa Bole Arabsa Site. American Journal of Engineering and Technology Management. Vol. 5, No. 4, 2020, pp. 69-75. doi: 10.11648/j.ajetm.20200504.12
Received: February 5, 2020; Accepted: July 23, 2020; Published: August 17, 2020
Abstract:
Construction is a dynamic process, and no two or more projects are ever alike. Even if having years of experience, every job presents a new set of circumstances and challenges, no matter how to do good during pre-construction stages project monitoring and controlling are necessary to meet project objectives. The objective of this paper is to measures the performance of governmental housing construction projects using earned value analysis. The research is a case study type and mainly conducted at the BOLE ARABSA site. From the case study, the finding indicates that almost all sample blocks from bole arabsa site suffering delays and few cost variations. Material shortage, unit rate change, and work variation were the main reason for the negative cost and schedule variations. The stakeholders shall practice project controlling by continuous monitoring and evaluation using project management tools such as earned value analysis for all aspects of the job that have an impact on cost, time, and quality to improve their performance. The concerned body shall develop and provide a clear guideline and instruction (including the activities to be done to practice earned value analysis) for the stakeholders so that they can train their staff, and use it for day to day reference on their project site.Keywords:
Condominium, Cost, Schedule, Earned Value Analysis, Performance Measurement1. Introduction
1.1. Background
The Integrated Housing Development Programme (IHDP) is a government-led and financed housing provision program for low-and middle-income households in Ethiopia. The program launched in 2004 (1996 in the Ethiopian calendar) by State Minister Oqubay Arkebe, the Mayor of Addis Ababa [13].
Since 2005 Ethiopia has been implementing an ambitious government-led low and middle-income housing program: The Integrated Housing Development Programme (IHDP). The initial goal of this program was to construct 400,000 condominium units, create 200,000 jobs, promote the development of 10,000 micro and small enterprises, enhance the capacity of the construction sector, regenerate inner-city slum areas, and promote
homeownership for low-income households [13].
Earned Value Analysis examines actual accomplishment and gives managers greater insight into potential risk areas. With a clearer picture, managers can create risk mitigation plans based on actual cost, schedule, and technical progress of the work. It is an early warning program/project management tool that enables managers to identify and control problems before they become impossible [4].
Using earned value metrics, we can identify situations like when goal realization is behind schedule, or when the goal is under- or over resourced. Understanding the reasons for such a situation is provided by risk monitoring [9].
1.2. Statement of the Problem
and middle-income groups to make them owners of their House in the year 2025.
Bole Arabsa construction site officially started in 2015 time needed 540 days for G+4 And 720 working days for G+7. Until the end of February 2019G.c. This project not completed [6].
The government housing (condominium) construction projects must deliver on time and with the budget to fulfill users' or citizens' interests, but the governmental housing development projects not delivered adequately as per the schedule. More than 800,000 people have registered and still waiting for condominium housing in Ethiopia. Within twelve years in eleven rounds of the lottery, Addis Ababa housing project office could not have delivered more than 175,000 houses to the registered residents. Hence if the performance of the condominium housing project is not assessed and takes remedial measures for the challenges by the concerning it may take 55 years to provide only for those registered house seekers [7].
Project control requires continuous monitoring and evaluation project performance using a project controlling tool called earned value analysis for all aspects of the job that have an impact on cost, time, and quality. The Earned Value method (EVM) is a project control method that provides a quantitative measure of work performance. It is considered the most advance method for the integration of schedule and cost [1].
Earned Value Analysis examines actual accomplishment and gives managers greater insight into potential risk areas. With a clearer picture, managers can create risk mitigation plans based on actual cost, schedule, and technical progress of the work. It is an early warning program/project management tool that enables managers to identify and control problems before they become impossible [4].
2. Methodology
2.1. Description of the Study Area
This study conducted on governmental housing (20/ 80 condominium) construction projects in Addis Ababa Bole Arabsa site. At this site, there are six project offices Lideta, Yeka, Bole, Project 13, Project 15 & Kirkos sub-city project office. This paper mainly focuses on the bole and Yeka sub-city project office among six project offices on governmental housing (20/80 condominium) construction projects lead at the Bole Arabsa project site.
2.2. Population and Sampling
This paper mainly focuses only on Bole and Yeka sub-city project office among six project offices on governmental housing (20/80 condominium) construction projects lead at the Bole Arabsa project site. The two project offices have a Greater number of ongoing blocks as compared to other project offices under the Bole Arabsa project site.
At the BOLE sub-city project site, there are a total number of 80 blocks or 5004 number of house units, and at the YEKA project office, there are 85 blocks or 5,207 residential house units and 181 shops.
Under the two project office, those contractors whose grade level greater and equal to 3 leads more than three blocks in number and eight-story (G+7) typology. For those contractors whose grade level less than three undertake maximum one blocks and most of the G+4 typology. For those contractors whose grade level 5, 6 and 4 contractors also undertake one G+7 typology.
For case study projects undertaken by Contractors whose grade level 3, 2, and 1 have taken from the Bole sub-city project office. And projects undertaken by contractors whose grade level 4, 5, and 6 have been taken from the YEKA project office to compare the performance of different grade contractors. Judgmental (purposive) method of sampling used to select samples.
2.3. Case Study
The Case Study mainly conducted at YEKA and BOLE sub-city project office from the BOLE ARABSA construction site. The two project offices officially started the project since 2007, E.c. (2015 G.c.). The planned time to complete the project for G+4,540 days and G+7,720 days. While the elapsed time up to the end of February 2011 E.c. was 1535 days for G+4 and G+7. It means G+4 used extra time 995 days, and G+7 used Extra time of 815 days. The number implies the project already delayed as compared to the planned completion time.
For the case study to measure project performance 2011 E.c. plan (revised schedule) used. Under the newly revised schedule, they planned to finish all blocks at the end of June 2011, E.c. (2019 G.c.). The following useful information has taken from the actual project, total project cost, work executed to date, work planned to date, and the actual cost incurred.
The main objective of the study is to measure condominium project performance using earned value analysis at the end of February 2011E.C (2019 G.c.). Up to the End of February YEKA sub-city project office planned to finish 83% of the work for each block, and the BOLE sub-city project office planned to finish 89.68% of the work for each block.
3. EVA Concept
EVM compares how much we have spent on what we planned to Spend to do the work we have done. To determine time performance compares the amount of work done to the amount of work scheduled. To make these comparisons, EVM calculates cost and schedule variances, along with performance indices for project performance management. Based on these results, it forecasts the date and cost of the project at completion and highlights the possible need for corrective action [3].
The main EVMS variables (indicators) are BCWS (Budgeted Cost of Work Scheduled) or PV (Planned Value), BCWP (Budgeted Cost of Work Performed) or EV (Earned Value) and ACWP (Actual Cost of Work Performed) or AC (Actual Cost) [8].
approved budget expressed as a percentage) [10].
% complete = (EV / BAC) * 100
Earned Value (EV) is the percent of the total budget completed at a point in time. Also known as the budgeted cost of work performed (BCWP). EV calculated by multiplying the budget for an activity by the percent progress for that activity [7].
EV = % complete x budget
4. Result and Discussion
4.1. A Case Study at YEKA Project Office
Condominium projects under the Yeka project officially
started in 2007E.C. Up to the end of February, they planned to finish 83% of the work for each block, and at the end of June 2011, E.c. planned to finish the whole construction work and deliver to residents. The percentage executed, total budgeted cost, and the actual cost incurred to date data collected from the yeka sub-city project office.
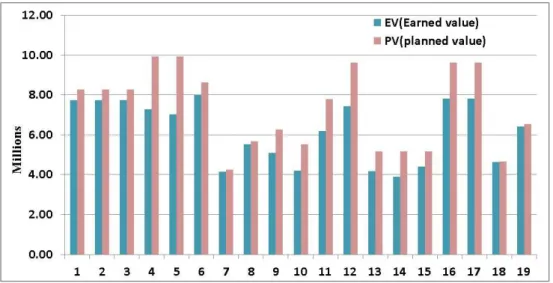
The comparison of Earned value and the planned value indicates the schedule performance index. From the Schedule performance index graph for the Yeka sub-city project office, the result implies almost all sample blocks facing negative schedule variation. At this project office, they planned to reach 83% of each block up to the End of February 2019, G.c. Among the sample blocks, almost all performed below 83% which indicates almost all sample blocks facing negative schedule variation.
Figure 1. Comparison of Earned value and planned value for sample blocks from YEKA sub city project office.
The comparison of earned value cost and actual cost indicates the cost performance of a project. Earned value cost and actual cost comparison graph for the Yeka sub-city project office, all sample blocks Earned value result Greater
than the Actual cost Result. Or If actual cost result subtracted from the earned value results in positive cost performance. Therefore from the graph concluded that all sample blocks from the Yeka sub-city have Good cost performance.
SPI (Schedule Performed Index) result shows how efficiently the project team is using its time and CPI (Cost Performed Index) result shows how efficiently the team is using its resources [11]. The cost performance index graph for the yeka sub-city project office indicates greater than one value. The result shows the cost of spending up to February 28 for both G+4 and G+7 sample blocks less than the planned budget. The schedule performance index graph for those sample blocks from the yeka sub-city project office indicates less than one value. The result Indicates that the Yeka sub-city project office performed less than the planned schedule.
Figure 3. Cost Performance Index and Schedule Performance Index for G+7 sample blocks from YEKA sub city project office.
Figure 4. Cost performance index and Schedule performance index for G+4 sample blocks from YEKA sub city project office.
Using the formula for EAC generate a rough estimate of when the project will be complete, EAC = (AC (Actual cost) + (BAC (budget at completion) – EV (earned value))) / (SPI (schedule performance index)*CPI (cost performance index)). The result indicates if current trends continue, compared to when it was originally supposed to be complete.
For G+4 and G+7, the graph indicates almost all sample blocks estimate at completion value less from budget at completion value indicates project likely to cost less than the budget at completion if it proceeds like before.
Figure 5. Comparison of Budget at completion and Estimate at completion for G+7 sample blocks from YEKA sub city project office.
Figure 6. Comparison of Budget at completion and Estimate at completion for G+4 sample blocks from YEKA sub city project office.
4.2. A Case Study at Bole Project Office
Condominium projects under the Bole project officially started in 2007E.c. up to the end of February 2011 E.c. Bole sub-city project office, planned to finish 89.68% of the work for each block and deliver for residents at the end of June 2011 E.c. The percentage executed, total budgeted cost, and the actual cost incurred to date data collected from the project office. Their project performance up to February 2011 (2019) calculated and presented below.
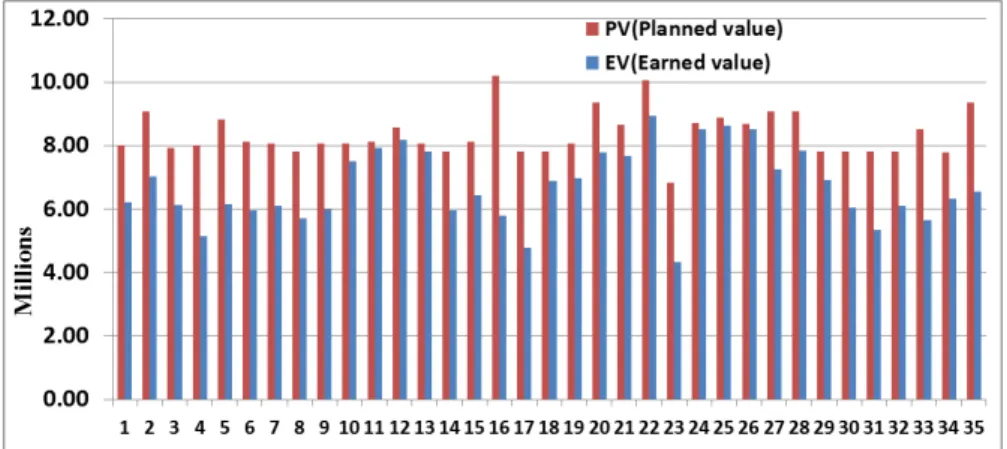
The comparison of Earned value and the planned value result indicates the schedule performance for those sample blocks from the bole sub-city project office. The schedule performance index graph under this project office Indicates almost all sample blocks facing negative schedule variation. This project office planned to finish 89.7% of project work for each block up to the end of February 2019. but among those sample blocks, almost all performed below 89.7%. It indicates the project team for each sample block is behind the schedule work.
The comparison of earned value cost and actual cost
indicates the cost performance of a project. Earned value cost and actual cost comparison graph for BOLE sub-city project office, All sample block Indicates that earned value cost Greater than the Actual Cost. Or if Actual Cost subtracted from the Earned value Cost results in positive cost performance. From the Above Cost Performance Index graph concluded that most of the sample blocks from the BOLE sub-city have Good cost performance. Also, for number 29 and 33 samples blocks Actual cost Greater than the earned value cost indicates cost overrun (the two blocks the project team has overspent for the work done up to the end of February).
Figure 8. Comparison of Earned value and Actual cost for sample blocks from BOLE sub city project office.
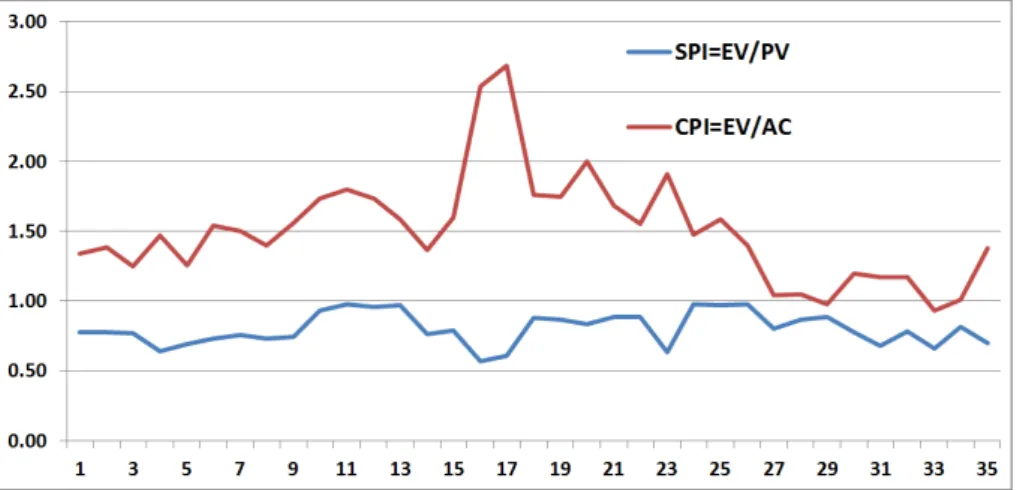
SPI (Schedule Performed Index) indicates how efficiently the project team is using its time and CPI (Cost Performed Index), indicates how efficiently the team is using its resources [11]. Under the cost and schedule performance index, the cost performance index result indicates that Almost all of the sample blocks have greater than one value. It means those sample blocks spending less than planned
budget. For sample block Numbers, 29 and 33 have less than one cost performance index value. The result Indicates the cost performance index for those sample block spending more than planned budget. The schedule performance index graph Indicates almost all sample blocks from the BOLE sub-city project office performing less than the planned schedule.
Figure 9. Cost performance index and Schedule performance index for sample blocks from BOLE sub city project office.
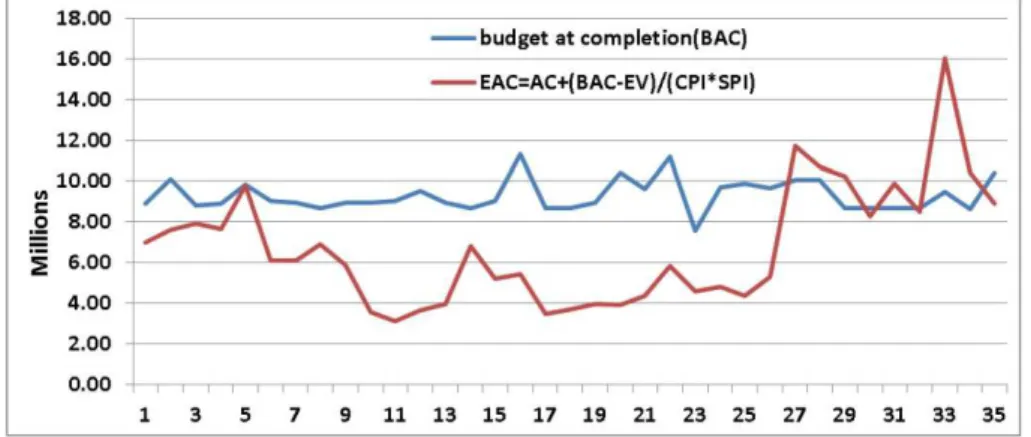
Using the formula for EAC generate a rough estimate of when the project will be complete, EAC = (AC (Actual cost) +
The result indicates if current trends continue, compared to when it was originally supposed to be complete. Under EAC (estimation at completion) and budget at completion graph, most of the sample blocks indicate estimate at completion Results less than from budget at completion results therefore
for those sample blocks the project likely to cost less than budget at completion, for sample block number 27, 29, 31, 33 Estimate at Completion result Greater than budget completion result. The result indicates the project Likely to cost more than the Budget at Completion (BAC).
Figure 10. Comparison of Budget at completion and Estimate at completion for Sample blocks from BOLE sub city project office.
Most of the sample blocks from BOLE and YEKA sub-city project office facing less than one schedule performance index value but for the comparisons of the two sub-city their schedule project performance index the following scale 0 < x ≤ 0.5, 0.5 < x ≤0.7, 0.7 < x ≤ 0.8 and 0.8 < x ≤ 1 used. The comparisons for schedule performance index shows categorizing each sample project SPI value under the above scale.
At BOLE sub-city project office from a total of 36 sample blocks, none of them attain SPI with a range of 0 < x ≤ 0.5. Eight (8) sample blocks Attain SPI value with a Range of 0.5 < x ≤ 0.7, in percentage it's about 22.2%, 12 sample blocks attain SPI value with a range of 0.7 < x ≤ 0.8 Or 33.2% of the total sample blocks and 16 sample blocks Attain SPI result with a Range of 8 < x ≤ 1, in percentage it's about 44.4%.
From the YEKA sub-city project office from a total of 19 sample blocks, none of them attain SPI with a range of 0 < x ≤ 0.5. One sample block Attains SPI value with a Range of 0.5 < x ≤0.7, the percentage of 5.2%. Six (6) sample blocks Attain SPI value with a range of 0.7 < x ≤ 0.8, Or 31.6%, and 12 sample blocks Attain SPI value with a Range of 0.8 < x ≤ 1 in percentage about 63.16%.
From the YEKA sub-city project office, all sample blocks were undertaken by contractors whose grade levels 4, 5, and 6. From the BOLE sub-city project office, all sample blocks were Undertaken by a contractor whose grade level 1, 2, and 3. The schedule performance index comparisons for the two project offices indicate sample blocks from YEKA sub-city percentage of sample blocks with a range of 0.8 < x ≤ 1 is 63.16% but for BOLE sub city 44.4%.
5. Conclusions and Recommendations
5.1. Conclusions
From Bole Arabsa construction site under bole and Yeka project office almost all Sample block schedule performance implies delay mainly due to the following factors
a) Material shortage (the consultant prepared a wrong
quantity of material)
b) Materials did not deliver as per the schedule,
c) Water shortage (There is no tab water even if the water delivered through tracks on the construction site not enough to construct those blocks)
d) Electric power problem,
e) The slow decision-making process and
f) Design modification.
Under these two project offices, there are also few cost variations mainly due to
a) Unit rate change and
b) Work variation.
5.2. Recommendations
1.This study recommends for the housing development project office to practice earned value management at each work level to measure their performance, investigate the major risk area, and improve housing project performance. 2.The stakeholders shall document the challenges or risks
they face for each period during project execution to identify and manage risks for another similar project
3.The government shall cooperate with real estate
developers to increase the competition and improve construction performance.
4.The stakeholders shall focus on proper planning and good scheduling. It Enables the timely procurement of necessary resources, reduces material waiting time, and
reduced schedule and cost variation on the
condominium construction site.
References
[2] Addis Zemen, n. (2017). Complain about delays in construction condominium housing in its newspaper. Addis Abeba: Addis zemen.
[3] Anbari, F. T. (2011). Advances in earned schedule & earned value management. Paper presented at PMI Global Congress 2011-North America, Dallas, TX. Newtown Square, PA: Project Management Institute.
[4] Bhosekar, S. K., & Vyas, G. (2012, April). Cost Controlling Using Earned Value Analysis in Construction Industries. International Journal of Engineering and Innovative Technology (IJEIT), 1 (4).
[5] EEP, E. a. (2009). Earned Value Management Guidelines. Washington: Washington State Department of Transportation. [6] HDP, H. D. (2018). Integrated Housing Development Program
is the result of a successful policy. Addis Abeba: Communication Affairs Supportive Work Process.
[7] Lukas, J. A. (2008). Earned Value Analysis – Why it Doesn't Work. AACE International Transactions.
[8] Mahadik, S. G., & Bhangale, P. (2013, September). Study & analysis of construction project management with an earned value management system. International Journal of Innovative Technology and Exploring Engineering (IJITEE), 3 (4), 40. [9] Mandic, V., & Basili, V. (2018). Organizational Earned Value
Analysis. Research Gate.
[10] Mosaic white paper. (n.d.). Retrieved May 20, 2019, from https://mosaicprojects.com.au/PMKI-SCH.ph:
www.mosaicprojects.com.au
[11] PMI. (2005). Practice standard for earned value management. Newtown Square, Pennsylvania 19073-3299 USA.: project management institute, inc.
[12] Sursh, S., & Ramasamy, G. N. (2015, April). Analysis of project performance using earned value analysis. International Journal of Science, engineering, and technology Research (IJESTR), 4 (4).
[13] UN-HABITAT. (2011). Condominium Housing in Ethiopia. Nairobi: United Nations Human Settlements Programme. [14] Amanuel Girma, Y., & Muluken Getachew, A. (2018).
Improving Project cost Management Practice and profitability of domestic contractors in Vadodara. Journal of Emerging Technologies and Innovative Research (JETIR).
[15] Mishakova, A., Vakhrushkina, A., Murgul, V., & Sazonova, T. (2016). Project Control based on a mutual application of Pert and earned value Management Methods. 15th International Scientific Conference "Underground Urbanization as a Prerequisite for Sustainable Development" (pp. 1812-1817). Saint -Petersburg: Elsevier Ltd.