Sharif University of Technology
Scientia IranicaTransactions A: Civil Engineering www.scientiairanica.com
Stability analysis of dry sandy slopes adjacent to
dynamic compaction process
E. Ghanbari Alamooti and A. Hamidi
School of Engineering, Kharazmi University, Tehran, Iran.
Received 28 March 2015; received in revised form 3 September 2015; accepted 18 October 2015
KEYWORDS Dynamic compaction; Slope stability; Safe distance; Particle velocity; Crater depth.
Abstract. Dynamic compaction is a useful economic method for improving dierent soil types, especially loose sandy lls. However, the method has been rarely used in the vicinity of slopes due to stability concerns. In this research, dynamic compaction method adjacent to slope edge was numerically simulated using 2D plain-strain nite element models. Stability of slope models under dierent compaction energies and slope geometries at the same initial static Factor of Safety (FS) was investigated considering dierent stability criteria. These criteria include Peak Particle Velocity (PPV) or Peak Particle Displacement (PPD) on the slope, rate of change in plastic volumetric strains, yield stress ratio on the induced slip surface, and the ratio of crater depths in at and sloped models. Safe compaction distances from slope heel were calculated for dierent criteria, and it was concluded that PPV criterion yields the most conservative distances, but PPD criterion almost shows the smallest safe distances. Based on comparison of dierent criteria, it was concluded that combination of yield stress ratio and rate of plastic volumetric strain achieves the most acceptable safe compaction distance values for consideration in slope stability analyses.
© 2017 Sharif University of Technology. All rights reserved.
1. Introduction
Slope stability problems have been studied under static and seismic loads by a number of researchers [1-5]. However, less attention has been paid to the stability of slopes and trenches under impact loads induced by dynamic compaction process. Jafarzadeh [6] used at models to simulate dynamic compaction process in laboratory and measured acceleration and velocity variations at depth due to the application of dierent tamping energy levels. Zhou et al. [7] investigated dynamic response of a loessial slope under dynamic compaction load and concluded that the amplitude of response increases with increase of the slope angle. Vahidipour et al. [8] experimentally investigated sta-*. Corresponding author. Tel: +98 21 88830891
E-mail address: [email protected] (A. Hamidi)
bility parameters of a sandy slope model adjacent to dynamic compaction process. They investigated the eects of slope geometry and tamping energy on the crater depth and examined the stability of slope during dynamic compaction process.
Generally, there are two main approaches in slope stability problems: Limit Equilibrium Method (LEM) and Finite Element Method (FEM). Although LEM is being widely used due to the simplicity, FEM is implemented more accurately due to the consideration of constitutive behavior and no necessity for assump-tion of a slip surface. The main problem with FEM is denition of stable and unstable states for slope. These states have been dened in dierent manners by previous researchers.
Zienkiewicz and Taylor [9] expressed that insta-bility of slope occurs as numerical solution becomes non-convergent. Griths and Lane [10] dened the
non-convergence solution as a sudden increase in lateral displacements of slope. This criterion may lead to low safety factors comparing to LEM. Formation of a surface with plastic strains from toe to the top of the slope, the same as the critical slip curve in LEM, has also been considered as a proper benchmark by other researchers [11,12]. Xu et al. [13] accounted for the rapid increase in mesh nodal displacements on the slope as the onset of failure.
Most of the FEM slope stability analyses use Strength Reduction Method (SRM) or Gravity-Induced Method (GIM) for determining the minimum factor of safety [14,15]. In these methods, shear strength parameters are reduced or the load level increases gradually until triggering of slope failure. Although the method is simple and applicable, precise distribution of stresses and strains within soil body at working load levels is not clear in the analysis. However, these methods are not applicable in modeling of real dynamic loading conditions like blast or impact loads. To dene slope instability due to the application of dynamic loads, an exact and straightforward crite-rion which is relevant to the load type is required. A criterion of PPV for blast induced slope failure was proposed by previous researchers [16,17]. Allowable PPD of soil slopes is another proper limit to investigate soil instability, which has been given in a number of transportation and pavement codes [18,19].
Due to the generation of high-intensity waves spreading during dynamic compaction operation, max-imum lateral displacement and peak particle velocity of the soil particles must be limited around tamping area, especially in urban areas [20]. Also, the controlling of these parameters is essential when compaction point is near to the slope. In the present study, safe compaction distance was numerically investigated using dierent parameters such as peak particle displacement or peak particle velocity on the slope, rate of change in plastic volumetric strain, and crater depth or yield stress ratio as stability criteria. These parameters were compared with each other to present reasonable values of safe compaction distance adjacent to the slopes.
2. Numerical modeling
The nite element code \ABAQUS" is a general useful program in modeling of small or large deformation boundary condition problems with dierent geometries and constitutive laws. It has been eectively utilized by previous researchers for the modeling of dynamic compaction operation [21-24] or seismic slope stability problems [11,12,25,26]. In this paper, dynamic implicit time integration scheme is used via ABAQUS 6.10 [27] to investigate slope stability adjacent to dynamic compaction process, and it is explained in the following sections.
2.1. Constitutive model
Since cap plasticity model can eectively consider both soil hardening due to compaction and shear failure, it has been successfully implemented for dynamic compaction simulation by many researchers [24,28-30]. Ghassemi et al. [31] applied cap plasticity model for numerical simulation of dynamic compaction in nite element code PISA.
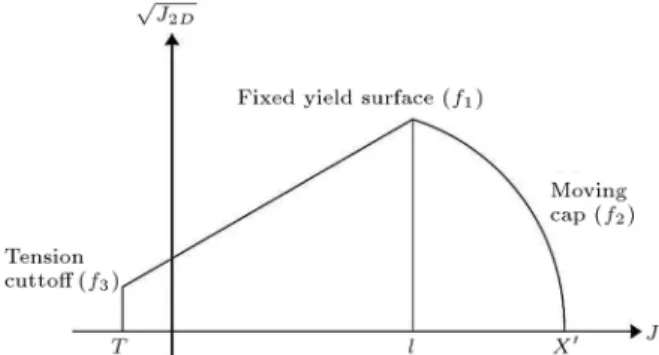
Cap plasticity model has two yield surfaces: The rst one is a xed yield surface of Drucker-Prager model which shows shear failure and the second one is moving caps dening hardening during change in volumetric strains. The two-yield surfaces in stress space are shown in Figure 1. Eqs. (1) and (2) represent xed and moving yield surfaces of the constitutive model, respectively:
f1=
p
J2D j1 = 0; (1)
f2= (J1 l)2+ R2J2D ( X l)2= 0: (2)
Here, and are the Drucker-Prager model constants, J1 is the rst invariant of stress tensor, pJ2D is the
second invariant of deviatoric stress tensor, l is the coordinate of cap-xed yield surface intersection on J1
axis, R is the radius of cap surface in stress space, and
X is the hardening parameter of soil which depends on plastic volumetric strain ("p
v) and initial mean eective
stress (X0) as below:
X = D1 ln
1 "pv W
+ X0; (3)
W and D are cap hardening parameters which depend on soil compressibility. In order to verify the implemen-tation of cap plasticity model in numerical modeling, relative density variations for the tests of Oshima and Takada [32,33] were evaluated in the present study by numerical modeling. Oshima and Takada [32] ex-perimentally simulated dynamic compaction operation in a centrifuge apparatus. A two-dimensional plain strain model was selected, 50 m in length and 20 m in height. ABAQUS software has the ability of dening
Figure 1. Yield surface of cap-plasticity model in stress space.
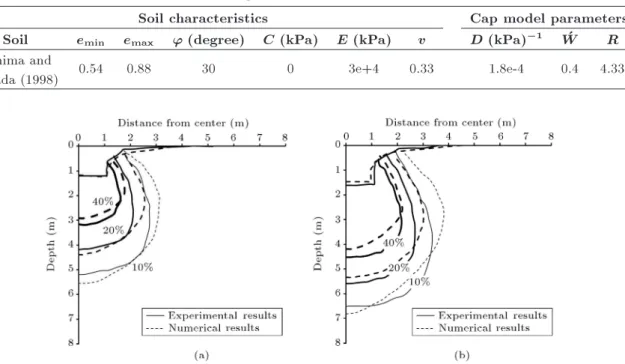
Table 1. Soil parameters in numerical models.
Soil characteristics Cap model parameters
Soil emin emax ' (degree) C (kPa) E (kPa) v D (kPa) 1 W R
Oshima and
Takada (1998) 0.54 0.88 30 0 3e+4 0.33 1.8e-4 0.4 4.33
Figure 2. Comparison of relative density change contours for the present numerical analysis and the experimental study of Oshima and Takada (1998): (a) 5th blow count and (b) 10th blow count.
a specied thickness for plane strain models which improves predictions in 2D numerical modeling process. The model thickness was determined as 5 m by trial and error based on adjusting crater depth values between numerical model and experimental data of Oshima and Takada [32]. Tamper thickness was also determined in the same manner considering a constant tamper area of 4 m2.
Table 1 shows cap model and other soil parame-ters in numerical modeling. It should be noted that cap model parameters for the soil used by Oshima and Takada [32] have been previously calculated using curve tting with oedometer test results by Lee and Gu [34]. Contours of the increase in relative density after 5th and 10th blows for 400 ton.m tamping energy (4000 kN.m) in centrifuge tests are compared with numerical results of the present study in Fig-ure 2(a) and (b), respectively. As it can be seen, there is good agreement between 2D plain strain numerical model and experimental results of Oshima and Takada [32,33] in prediction of relative density contours. The numerical model also predicted im-provement depth accurately; however, it approximately overestimated improvement radius, especially at higher relative densities.
2.2. Geometry of models
Numerical models of earth slopes with dierent geome-tries and dimensions were considered in the present study, as shown in Table 2 and Figure 3. Slope height (H), slope angle (), and soil depth under
Table 2. Combination of geometry parameters. h(m) H(m) Z(m) (degree)
6.00 4.00 15 45, 60, 75, 90 6.00 6.00 20 45, 60, 75, 90 8.00 8.00 25 45, 60, 75, 90
Figure 3. Geometrical variables used in numerical analysis.
the slope (h) were considered as geometry variables. The soil depth under the slope inuences the shape of failure surface and Factor of Safety (FS). In the present study, it has been determined in a way that the eect of wave reection is minimized due to tamping in vertical direction. As a result, the soil depth has been considered as 6 m for energy levels of 300 and 400 ton.m and 8 m for 500 ton.m level of tamping energy. Moreover, side boundaries are located at 150 m from slope heel and toe to ignore the eect of wave reection in a horizontal direction.
Tamper weight (W ) is considered as 20 ton for all models, but dropping height (Z) is assumed as a
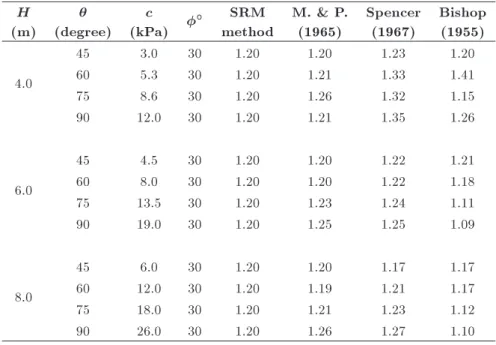
Table 3. Comparison of static FS calculated from SRM and LEM methods. H
(m) (degree)
c (kPa)
SRM method
M. & P. (1965)
Spencer (1967)
Bishop (1955)
4.0
45 3.0 30 1.20 1.20 1.23 1.20
60 5.3 30 1.20 1.21 1.33 1.41
75 8.6 30 1.20 1.26 1.32 1.15
90 12.0 30 1.20 1.21 1.35 1.26
6.0
45 4.5 30 1.20 1.20 1.22 1.21
60 8.0 30 1.20 1.20 1.22 1.18
75 13.5 30 1.20 1.23 1.24 1.11
90 19.0 30 1.20 1.25 1.25 1.09
8.0
45 6.0 30 1.20 1.20 1.17 1.17
60 12.0 30 1.20 1.19 1.21 1.17
75 18.0 30 1.20 1.21 1.23 1.12
90 26.0 30 1.20 1.26 1.27 1.10
variable to present three compaction energy levels of 300, 400, and 500 ton.m in numerical analysis and to investigate the eect of applied energy on slope stability.
In order to apply similar initial conditions in nu-merical models with dierent geometries, static FS was kept constant for all models. For this purpose, friction angle of the soil was kept as 30 and soil cohesion
was obtained for each slope height and inclination by trial and error using SRM for a constant static FS = 1.2, as shown in Table 3. These values were also compared with LEM results by Morgenstern and Price [35], Spencer [36], and Bishop [37] methods using Slope/w software [38].
According to the results, the simplied Bishop [37] Method underestimated FS in many cases. It may be due to ignoring inter-slice shear forces and satisfaction of only moment equilibrium. In some cases, the Spencer method overestimated FS comparing to SRM, but Morgenstern and Price [35] method was generally better in prediction of FS. Comparing to the simplied Bishop [37] method, Spencer [36] or Morgenstern and Price [35] methods satisfy moment equilibrium, besides force equilibrium, in a horizontal direction. However, Spencer [36] method considers a constant relation between inter-slice shear and nor-mal forces contrary to Morgenstern and Price [35] method which allows variable inter-slice force ra-tios.
2.3. Discretization and damping parameters Two-dimensional plain strain models were adopted, and numerical modeling was performed using ABAQUS software. The tamper was considered as square in
shape with 3 m2 area. Quadrilateral 4-noded plain
strain elements were used in the model to obtain better convergence compared to 3-noded triangular elements. Also, maximum element size was selected as 10 nodes standing per wavelength [21]. Assuming frequency of 10 Hz and wavelength of 8.2 m, maximum mesh size should be less than 0.82 m. Finer discretization was applied around the impact point as 0.2 m; however, for other regions far from impact point, it was set from 0.2 m to 0.8 m. Based on element size and shear wave velocity, time step of 10 8 sec was considered
for dynamic analysis. Model thickness and tamper area were considered as 5 m and 4 m2, respectively,
the same as those which have been previously used in verication process by experimental data of Oshima and Takada [32,33].
In order to consider material damping in models, Rayleigh damping was utilized in the analysis according to Eq. (4). Here, and are Rayleigh damping constants where was assumed as zero to neglect the eect of lower modes of vibration on damping, and was assigned as 0.01 according to Ghassemi et al. [31] and Ghanbari and Hamidi [24]. Also, C, M, and K are damping, mass, and stiness matrixes, respectively:
[C] = [M] + [K]: (4)
Simulation of impact loads is performed by modeling free falling of a rigid tamper on the soil. This method is more realistic than other models based on introducing an initial velocity to tamping nodes or use of force time history by Ghassemi et al. [31] and Pan and Selby [21], respectively. The interface between tamper
and soil was dened according to the penalty method in ABAQUS software using a friction coecient of 0.5.
2.4. Calculation of PPV
According to FHWA [20], PPV should be limited to prevent structural damage by dynamic compaction in urban areas. Siskind et al. [39] introduced PPV threshold to prevent cracks in old and new buildings as 13 and 19 mm/sec, respectively. Moreover, structural damage was proposed to occur when PPV becomes more than 50 mm/sec. Wong and Pang [16] assessed the stability of slopes due to blast loading through LEM analysis. Bureau of Indian Standards (IS 6922, [17]) also considered the allowable PPV as 50 mm/sec for slopes subjected to blast vibrations.
To estimate PPV values during dynamic com-paction, previous researchers have made some equa-tions which consider tamping energy and distance from tamping point. Mayne et al. [40] presented the following correlation based on data gathered from 120 dierent at sites at which PPV values were measured during dynamic compaction:
PPVmms = 70 p
W:Z x
!1:4
; (5)
where, W and Z are tamper weight and dropping height, respectively. Also, Mayne [41] modied Eq. (5) to predict the upper limit for PPV as follows:
PPVmms = 92 p
W:Z x
!1:7
: (6)
Mostafa [22] used numerical modeling to investigate PPV during dynamic compaction process for dierent soils and various energy levels; he presented the lower and upper limits for the at ground according to the following equations, respectively:
PPVmms = 180 p
W:Z x
!1:9
; (7)
PPVmms = 400 p
W:Z x
!2:2
: (8)
Estimated PPV values should be limited to the al-lowable PPV based on the type of structure and serviceability levels.
2.5. PPD criterion
Bobrowsky and Highland [42] classied hazard risk of slopes based on displacements during dynamic load-ings. In his classication, PPD values of more than
15 cm and less than 30 cm were considered as medium risk; PPD values of more than 5 cm and less than 15 cm were associated with low risk of collapse; and PPD values of less than 5 cm were considered as very low risk. Another criterion for natural slopes was established by the State of Alaska's Geotechnical Evaluation Criteria Committee (quoted in [43]), where the amount of permanent lateral displacement for moderate ground displacement was set as 30 cm. PPD criterion must be selected based on the environmental situation of soil slope and type of risk induced by slope instability.
2.6. Calculation of yield stress factor
SIMULIA [44] introduced yield stress factor (DP) at a point as ratio of the induced deviatoric stress to the maximum shear strength that can be mobilized. According to this denition, yield occurs at a specied point when DP factor reaches 1.0. When deviatoric stress at a point reaches zero (at points near the free surface), DP yield factor becomes zero too. Using DP factor at points near the slope region, the proximity of slope instability can be evaluated.
2.7. Dynamic factor of safety
It was mentioned in previous sections that the static factor of safety for all slope models was set at 1.2 to generate similar initial conditions. Safety factor under pseudo-static load in a seismic analysis of slopes has been calculated by Nadi et al. [45] based on the pseudo-static coecient recommended by many researchers and design codes [46-49]. The calculated FS value is greater than 1.0 for pseudo-static design of slopes in which the acceptable displacement might be as little as 5 to 30 cm [45]. In this paper, due to the application of dynamic load directly to the slopes, dynamic Factor of Safety (FSdyn) greater than 1.0 is more reasonable.
As a result, FSdyn > 1:05 has been considered in
analysis.
3. Numerical results
As stated before, 12 slopes with dierent geometries and a constant initial static FS of 1.2 were numerically modeled. For each model, distance between the impact point and slope heel (X) was varied between 1 to 33 m at 4 m intervals. A at model with the same soil and shear strength properties was also modeled, associated with each sloped model for the sake of comparison. As a result, 120 numerical models were adopted in the present research, where dierent pa-rameters like Peak Particle Velocity (PPV) and Peak Particle Displacement (PPD) on the slope, crater depth in at and sloped models, changes in plastic volumetric strains, and shear stresses on the induced slip surface were determined to investigate ve dierent criteria for
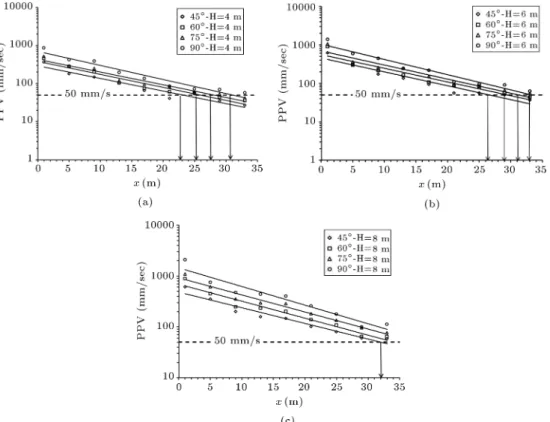
Figure 4. Results of PPV with compaction distance from slope heel: (a) H = 4 m, (b) H = 6 m, and (c) H = 8 m.
slope stability under impact loading during dynamic compaction process.
3.1. Assessment of slope stability based on PPV
Figure 4 shows variation of PPV on slope surface with distance between compaction point and slope heel (X). As it can be seen, PPV values decrease with increase in tamping distance from the slope. Also, PPV values are greater for steeper slopes in a constant tamping energy and static FS. Clearly, in higher energies, increase in PPV values can be observed.
As expressed in Section 2.4, PPV threshold of 50 mm/sec is selected in the present study to calculate the safe distances. It has been shown in Figure 4 and the results are depicted in Table 4. An empirical equation for PPV based on slope geometry, tamping energy, and distance from slope heel (X) is derived as follows by regression of data in Figure 5:
PPVmms = 4:15 p
W:Z
x :g:H: sin !0:8
: (9)
Here, g is the gravity acceleration, (pW:Z
x :g:H: sin )
is the velocity parameter, (W:Z) is in the free fall tamping energy in ton.m, H and X are in meter, and the velocity parameter is held in mm/sec. Table 5 compares safe distances based on PPV criterion for at and sloped models. For at ground, Eqs. (5) and (6)
Figure 5. Variation of PPV with velocity parameter.
are applied using free fall energies of 300, 400, and 500 t.m for slope heights of 4, 6, and 8 m, respectively, to calculate safe distances based on PPV threshold of 50 mm/s. Safe distances are higher for sloped models than at ones. It is evident that the presence of a slope increases the safe distance compared to the level ground.
3.2. Assessment of slope stability based on PPD
Figure 6 indicates variation of PPD with tamper distance from the slope heel (X). It can be seen that PPD values decrease sharply in large distances. Also, increase in slope height or inclination increases
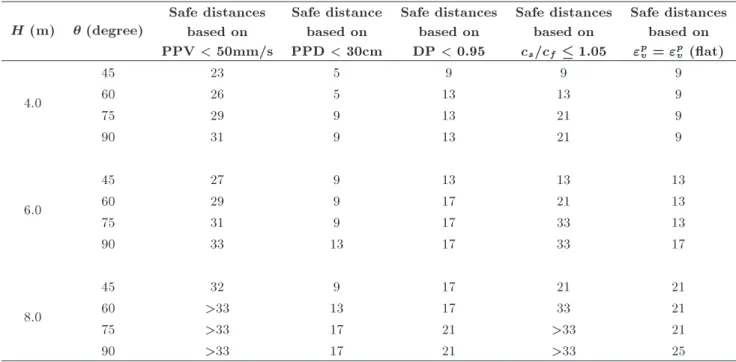
Table 4. Safe distances based on dierent criteria. H (m) (degree)
Safe distances based on PPV < 50mm/s
Safe distance based on PPD < 30cm
Safe distances based on DP < 0.95
Safe distances based on cs=cf 1:05
Safe distances based on "p
v = "pv (at)
4.0
45 23 5 9 9 9
60 26 5 13 13 9
75 29 9 13 21 9
90 31 9 13 21 9
6.0
45 27 9 13 13 13
60 29 9 17 21 13
75 31 9 17 33 13
90 33 13 17 33 17
8.0
45 32 9 17 21 21
60 >33 13 17 33 21
75 >33 17 21 >33 21
90 >33 17 21 >33 25
Table 5. Safe distances based on PPV threshold for at and slope models. H (m) (degree)
Safe distances based on PPV < 50 mm/s
Safe distances using Eq. (5)
Safe distances using Eq. (6)
4.0
45 23 22 24
60 26 22 24
75 29 22 24
90 31 22 24
6.0
45 27 25 28
60 29 25 28
75 31 25 28
90 33 25 28
8.0
45 32 28 32
60 >33 28 32
75 >33 28 32
90 >33 28 32
PPD values, with more dierences in smaller tamping distances. Hence, the geometrical eects become negligible for impact loads away from the slope heel. It is evident, however, that PPD values are larger for higher compaction energies. Bobrowsky's PPD criterion is drawn as horizontal dashed lines in Figure 6. Considering the upper limit of allowable PPD as 30 cm in this research, safe tamping distance from the slope heel was calculated based on Figure 6 and is depicted in Table 4. According to this table, safe distance values are much lower than those from PPV criterion. On the other hand, PPV criterion yields more conservative values of safe tamping distance compared to PPD one.
Figure 7 shows variation of PPD normalized to the slope height with Depth of Improvement (DI) and normalized to the distance between tamping point and slope heel (X) for the considered range of slope angles:
PPD
H = 37:6 ln p
W:Z x : sin
!
+ 25:8: (10)
Figure 7. Variation of PPD normalized to slope height with dimensionless distance parameter.
3.3. Assessment of slope stability based on yield stress factor
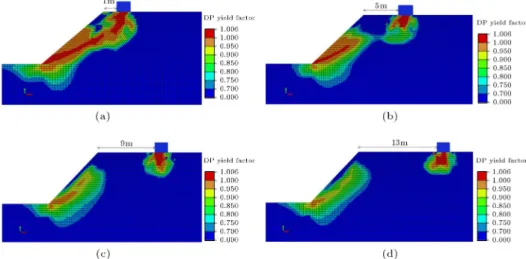
The DP ratio, dened in Section 2.6, is also used for assessment of the proximity of instability of slopes in ABAQUS software. Figure 8 shows calculated yield stress factors for slope of 8 m high with 45inclination
at dierent tamping distances. It is clear that when tamping is performed at near distance of 1 m from the slope heel, a region of high DP yield factors (close to 1.0) is extended from slope toe towards the compaction point. Increase in tamping distance decreases the zone of high DP yield stress factors. At compaction distance of 9 m, the zone of DP> 0:95 becomes a small portion which is not extended towards the slope toe. It can be shown that DP is less than 0.95 in this zone which can be assumed as the safe distance based on this criterion. The calculated values for dierent slope geometries and tamping energies are listed in Table 4.
It should be noted that the reverse of yield stress factor can be considered as the dynamic factor of safety (FSdyn); consequently, the assumption of the safe
distance based on DP< 0:95 ensures FSdyn > 1:05 at
each point against driving shear stresses.
3.4. Evaluation of the safe distances based on the ratio of crater depths in at and sloped models
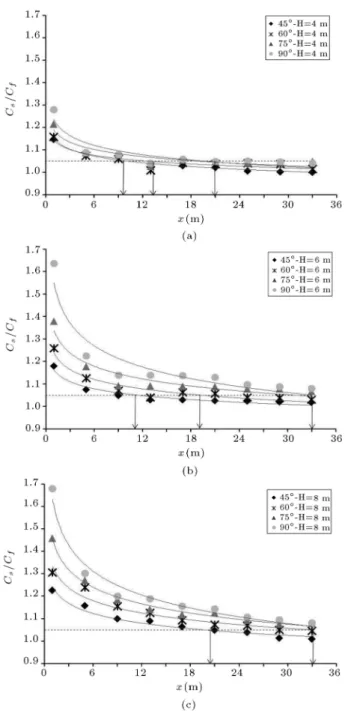
Figure 9 shows the ratio of crater depths for the sloped and relevant at model with the same soil properties (cs=cf). As it can be seen, crater depth ratio varies
between 1.67 (for x = 1 m) and 1.0 (for x = 33 m) in all models. Also, it was observed that the rate of reduction in crater depth ratio is more at small tamping distances. The safe distance, with respect to the ratio of crater depth, is dened where the crater depth after tamping in slope model is equal to the value in corresponding at model to insure that the eect of slope is removed. In the present study, the
Figure 8. Contours of the yield stress factor for sloped model, = 45and H = 8 m, at dierent tamping distances: (a)
Figure 9. Variation of crater depth ratio with distance from slope heel: (a) H = 4 m, (b) H = 6 m, and (c) H = 8 m.
safe distance was calculated based on the crater depth ratio less than 1.05. Indeed, 5% dierence between the sloped and at models is accepted to obtain more reasonable safe distance values. This ratio is indicated with a horizontal line in Figure 9. Calculated values based on this criterion are listed in Table 4. It is evident that the safe distance increases by decrease in height and inclination of the slope according to this criterion.
3.5. Assessment of the slope stability based on plastic volumetric strains
The main objective of dynamic compaction process is
the desired improvement up to a specic depth; con-sequently, the change in relative density is an impor-tant parameter during dynamic compaction operations. Plastic volumetric strain at depth is directly related to the change in relative density [23]. Hence, another denition of safe distance can be proposed based on variations of plastic volumetric strains. Indeed, the ef-fects of slope on dynamic compaction performance can be eliminated when induced plastic volumetric strains at depth (i.e., the trend of change in relative density) become equal to associated values in at models.
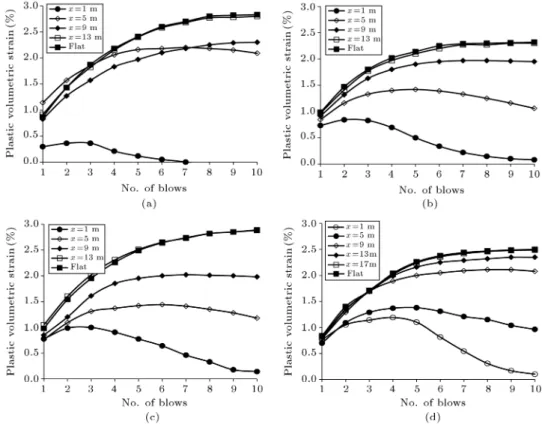
In order to assess the rate of change in plastic volumetric strain, it was determined at 2 m depth and 2 m distance from the tamper edge towards the slope and was compared with relevant values in at models according to Figure 10. For small tamping distance, i.e. x = 1 m, the plastic volumetric strain decreased with increase in blow count which means the increase in relative density. Volume change became constant with further blows; afterwards, it increased until soil returned to its initial volumetric state. At last, a further and sudden increase in volume resulted in failure of the slope. This is schematically shown in Figure 11. Indeed, when compaction is performed near the slope, few blow counts are eective in soil compaction, and further blows result in large lateral displacements, that is, little compaction around the tamping point. It results in lower eciency of dynamic compaction process adjacent to the slopes compared to the level grounds and failure of the slope. According to Figure 10, the trend of changes in plastic volumetric strains is dierent when tamping is performed at larger distances from the slope. Plastic volumetric strains continuously decreased up to a constant value in higher blow counts. The trend of volume change became equal to the associated at model in large tamping distances. It is considered as the safe distance based on this criterion and is listed for all slope geometries in Table 4. 4. Discussion
In order to assess the risk of slope failure during dy-namic compaction process, the range of PPD values for tamping at the safe distance is presented in Table 6 for all criteria. The risk of failure based on classication of Bobrowsky [42] is also given in this table. As mentioned earlier, greater safe distance based on PPV criterion results in very low to low risk. Indeed, PPV is a very conservative criterion which may be used in urban areas or for important facilities like buried structures under slopes where displacements must be limited.
The range of PPD based on crater depth criterion also resulted in low risk of failure. Comparing to PPD values based on plastic volumetric strain criterion in Table 6, and considering the main objective of dynamic compaction adjacent to the slope, that is, obtaining the
Figure 10. Variation of plastic volumetric strains with blow cunts for dierent tamping distances (H = 6 m): (a) = 45,
(b) = 60, (c) = 75, and (d) = 90.
Figure 11. Schematic curve of changes in plastic volumetric strain at failure.
appropriate relative density equal to at ground at all depths, it can be concluded that crater depth ratio less than 1.05 leads to the desired compaction.
Table 6 indicates that plastic volumetric strain
and yield stress factor criteria present similar PPD values (12-22 cm) and low to medium risk of failure. It can be understood that the yield stress factor, DP< 0:95, is associated with changes in relative density similar to at ground. The range of PPD values indicates low to medium risk of failure for both criteria. It can be concluded that desired compaction at depth can be obtained based on both plastic volumetric strain and DP yield factor criteria. To ensure them, safe distances can be selected as the maximum value obtained from both criteria as given in Table 7. Also, associated PPD and PPV values and crater depth ratio at the safe distance are presented in Table 7. According to this table, in order to preserve slope stability during dynamic compaction, PPV values on the slope should be limited to 220 mm/s, crater depth ratio less than 1.12, and PPD values up to 18 cm. The obtained value of PPV is too much more than recommended value by IS 6922 code [9] (i.e., 50 mm/s). As a result, based on the newly recommended values of PPV or PPD and the geometry of slope, maximum compaction energy can be approximated using Eqs. (9) and (10).
Table 6. Range of PPD and risk of failure based on dierent criteria. Type of
criteria
Criterion based on Cs=Cf 1:05
Criterion based on PPV < 50 mm/sec
Criterion based on DP < 0.95
Criterion based on "p
v = "pv (at)
Range of PPD 5-15 cm 3-9 cm 12-21 cm 12-22 cm
Table 7. Final safe distances and associated values based on other criteria. H
(m) (degree)
The nal safe distance
(m)
Associated PPD on slope
(mm)
Associated PPV on slope
(mm/s)
Associated crater depth ratio
(cs=cf)
4.0
45 9 135 130 1.05
60 13 117 140 1.05
75 13 122 160 1.07
90 13 165 220 1.08
6.0
45 13 142 160 1.04
60 17 140 140 1.06
75 17 142 160 1.10
90 17 169 220 1.12
8.0
45 21 122 120 1.05
60 21 150 155 1.08
75 21 180 180 1.11
90 25 161 170 1.11
5. Conclusion
In the present study, two-dimensional plain strain nite element models were simulated using ABAQUS to investigate the eects of dynamic compaction on stability of dry sandy slopes. Using SRM method, the static safety factors of all sloped models were considered as 1.2. After the 10th blow count in dierent distances from slope heel, the following results have been obtained comparing to the level ground models:
1. Safety factors calculated by nite element analysis using SRM are in good agreement with Morgenstern and Price [26] method;
2. PPV and PPD values on the slope surface decrease by increase in tamping distance from slope heel, although these are true more for steeper slopes. Also, increase in tamping energy and slope height increases PPV and PPD values. Calculation of PPV values based on a threshold of 50 mm/s seems to yield conservative safe tamping distances;
3. Crater depth ratios of the sloped and at models were compared with each other. The ratio varies between 1.67 for a tamping distance of 1 m to 1.0 for a tamping distance of 33 m. In the present study, the safe distances are calculated for a crater depth ratio less than 1.05;
4. Investigation of plastic volumetric strain contours reveals that at near tamping distances, compressive volumetric strains occur in rst blows, and after that, the soil expands with more blow counts. As a result, when compaction is performed near the slope, few blow counts are eective in soil
compaction, and further blows result in large lateral displacements which increase the volume and sud-den collapse of the slope. Comparing the results of plastic volumetric strains in at and sloped models, the safe distance can be dened where the plastic volumetric strains become similar in both cases;
5. By comparing dierent criteria and calculating PPD values on the slope at relevant safe distances, it is observed that the safe distances based on yield stress factor and plastic volumetric strain criteria are almost the same, and the range of PPD values is quite similar for both of them. As a result, the safe tamping distance can be selected from the maximum values for these two criteria. Comparison to the other mentioned criteria, it can be concluded that the nal safe distances are compatible with PPD values less than 18 cm, PPV values up to 220 mm/s, and crater depth ratio lower than 1.12. Nomenclature
Abbreviations
FS Factor of Safety PPV Peak Particle Velocity PPD Peak Particle Displacement LEM Limit Equilibrium Method FEM Finite Element Method SRM Strength Reduction Method GIM Gravity-Induced Method DP Yield stress factor
cs Crater depths for the sloped model
cf Crater depths for the at model
cs=cf Crater depth ratio
Notations
emin Minimum void ratio
emax Maximum void ratio
' Angle of friction
C Cohesion
E Elasticity modulus v Poisson's ratio
Drucker-Prager constant Drucker-Prager constant J1 First invariant of stress tensor
p
J2D Second invariant of deviatoric stress
tensor
l Coordinate of cap-xed yield surface intersection on J1 axis
R Radius of cap surface in stress space
X Hardening parameter of soil "p
v Plastic volumetric strain
X0 Initial mean eective stress
W Cap hardening parameters D Cap hardening parameters
H Slope height
Slope angle
h Soil depth under the slope
W Tamper weight
Z Drop height
X Distance between compaction point and slope heel
g Gravity acceleration Rayleigh damping constant Rayleigh damping constant [C] Damping matrix
[M] Mass matrix [K] Stiness matrix References
1. Johari, A., Mousavi, S. and Hooshmand nejad, A. \A seismic slope stability probabilistic model based on Bishop's method using analytical approach", Scientia Iranica, Transaction on Civil Engineering, 22(3), pp. 728-741 (2015).
2. Erzin, Y. and Cetin, T. \The use of neural networks for the prediction of the critical factor of safety of an articial slope subjected to earthquake forces", Scientia Iranica, 19(2), pp. 188-194 (2012).
3. Shinoda, M. \Seismic stability and displacement anal-yses of earth slopes using non-circular slip surface", Soils and Foundations, 55(2), pp. 227-241 (2015). 4. Lu, L., Wang, Z.J., Song, M.L. and Arai, K.
\Sta-bility analysis of slopes with ground water during earthquakes", Engineering Geology, 193, pp. 288-296 (2015).
5. Bandini, V., Biondi, G., Cascone, E. and Rampello, S. \A GLE-based model for seismic displacement analysis of slopes including strength degradation and geometry rearrangement", Soil Dynamics and Earthquake Engi-neering, 71, pp. 128-142 (2015).
6. Jafarzadeh, F. \Dynamic compaction method in physi-cal model tests", Scientia Iranica, Transaction on Civil Engineering, 13(2), pp. 187-192 (2006).
7. Zhou, Z., Chao, WL. and Liu, BC. \Model test study on dynamic responses of step-shapedloess slope with dynamic compaction", Proceedings of the 2010 GeoShanghai International Conference, Shang-hai, China (2010).
8. Vahidipour, A., Ghanbari, A. and Hamidi, A. \Ex-perimental study of dynamic compaction adjacent to a slope", Proceedings of the Institution of Civil Engineers: Ground Improvement, 169(2), pp. 79-89 (2016).
9. Zienkiewicz, O.C. and Taylor, R.L., The Finite Ele-ment Method. Basic Formulations and Linear Prob-lems, McGraw-Hill, London, UK (1989).
10. Grith, D.V. and Lane, P.A. \Slope stability analysis by nite elements", Geotechnique, 49(3), pp. 387-403 (1999).
11. Zheng, H., Liu, D.F. and Li, C.G. \Slope stability anal-ysis based on elasto-plastic nite element method", International Journal for Numerical Methods in En-gineering, 64, pp. 1871-1888 (2005).
12. Khosravi, M., Leshchinsky, D., Meehan, C.L. and Khosravi, A. \Stability analysis of seismically loaded slopes using nite element techniques", Geo Congress, ASCE (2013).
13. Xu, Q., Yin, H., Cao, X. and Li, Z. \Temperature-driven strength reduction method for slope stability analysis", Mechanics Research Communications, 36, pp. 224-231 (2009).
14. Zienkiewicz, O.C., Humpheson, C. and Lewis, R.W. \Associated and non-associated visco-plasticity in soil mechanics", Geotechnique, 25(4), pp. 671-689 (1975). 15. Swan, C.C. and Seo, Y.K. \Limit state analysis
of earthen slopes using dual continuum/FEM ap-proaches", International Journal for Numerical and Analytical Methods in Geomechanics, 23(12), pp. 1359-1371 (1999).
16. Wong, H.N. and Pang, P.L.R. \Assessment of stability of slopes subjected to blasting vibration", Geo-Report No. 15, Geotechnical Engineering Oce, Civil Engi-neering Department, Hong Kong (1992).
17. IS 6922 \Criteria for safety and design of structures subjected to underground blast", Bureau of Indian Standards, New Delhi, India (1973).
18. Anderson, D.G., Martin, G.R., Lam, I. and Wang, J.N.J. \Seismic analysis and design of retaining walls, buried structures, slopes, and embankments", NCHRP Report 611, Transportation Research Board, Washing-ton, D.C. (2008).
19. Kavazanjian, E., Wang, J.N.J., Martin, C.R. et al., RFD Seismic Analysis and Design of Transporta-tion Geotechnical Features and Structural FoundaTransporta-tions, NHI Course No. 130094. Publication No. FHWA-NHI-11-032, New York, NY 10119 (2011).
20. Lukas, R.G., Geotechnical Engineering Circular No. 1-Dynamic Compaction, Publication No. FHWA-SA-95-037, Washington, D.C. (1995).
21. Pan, J.L. and Selby, A.R. \Simulation of dynamic compaction of loose granular soils", Advances in Engi-neering Software, 33, pp. 631-640 (2002).
22. Mostafa, K. \Numerical modeling of dynamic com-paction in cohesive soils", Ph.D. Thesis, University of Akron, Ohio, United States (2010).
23. Pourjenabi, M., Ghanbari, E. and Hamidi, E. \Numeri-cal modelling of dynamic compaction by sand using dif-ferent constitutive models", 4th ECCOMAS Thematic Conference on Computational Methods in Structural Dynamics and Earthquake Engineering, COMPDYN 2013, Kos Island, Greece (2013).
24. Ghanbari, E. and Hamidi, A. \Numerical modelling of rapid impact compaction in loose sands", Geomechan-ics and Engineering, 6(5), pp. 487-502 (2014). 25. Wanstreet, P. \Finite element analysis of slope
sta-bility", M.Sc. Thesis, University of West Virginia, Morgantown, West Virginia, United States (2007). 26. Khosravi, M. and Khabbazian, M. \Presentation of
critical failure surface of slopes based on the nite element technique", Proceeding of GeoCongress: State of the Art and Practice in Geotechnical Engineering, pp. 536-545 (2012).
27. Dassault Systemes Simulia Corp, ABAQUS/CAE User's Manual, Providence, RI, USA, (2010).
28. Thilakasiri, H.S., Gunaratne, M., Mullins, G., et al. \Implementation aid for dynamic replacement of organic soils with sand", Journal of Geotechnical and Geoinvironmental Engineering, 127(1), pp. 25-35 (2001).
29. Gu, Q. and Lee, F.H. \Ground response to dynamic compaction", Geotechnique, 52(7), pp. 481-93 (2002). 30. Pak, A., Shahir, H. and Ghassemi, A. \Behavior of dry and saturated soils under impact load during dynamic compaction", In: Proc. 16th ICSMGE, Osaka, pp. 1245-1248 (2005).
31. Ghassemi, A., Pak, A. and Shahir, H \Numerical study of coupled hydro-mechanical eects in dynamic compaction of saturated granular soils", Computers and Geotechnics, 37, pp. 10-24 (2010).
32. Oshima, A. and Takada, N. \Relation between com-pacted area and ram momentum by heavy tamping", Proc. 14th ICSMFE, 3, pp. 1641-1644 (1997). 33. Oshima, A. and Takada, N. \Evaluation of compacted
area of heavy tamping by cone point resistance", Proceeding of International Conference of Centrifuge, 98, pp. 813-818 (1998).
34. Lee, F.H. and Gu, Q. \Method for estimating dynamic compaction eect on sand", Journal of Geotechnical and Geoenvironmental Engineering, 130(2), pp. 139-152 (2004).
35. Morgenstern, N.R. and Price, V.E. \The analysis of the stability of general slip surfaces", Geotechnique, 15, pp. 79-93 (1965).
36. Spencer, E. \A method of analysis of embankments as-suming parallel interslice forces", Geotechnique, 17(1), pp. 11-26 (1967).
37. Bishop, A.W. \The use of the slip circle in the stability analysis of slopes", Geotechnique, Great Britain, 5(1), pp. 7-17 (1955).
38. GEO-SLOPE International Ltd, Stability Modeling with SLOPE/W 2007 Version, Calgary, Alberta, Canada (2008).
39. Siskind, D.E., Stagg, M.S., Kopp, J.W. et al. \Struc-ture response and damage produced by ground vibra-tion from surface mine blasting", US Bureau of Mines, Report of Investigation 8507, United States (1980). 40. Mayne, P.W., Jones, J.S. and Dumas, J.C. \Ground
response to dynamic compaction", Journal of Geotech-nical Engineering, ASCE, 110(6), pp. 757-774 (1984). 41. Mayne, P.W. \Ground vibration during dynamic com-paction", In: Gazetasg, Selig ET, Vibration Problems in Geotechnical Engineering, Special Publication of ASCE, pp. 247-265 (1985).
42. Bobrowsky, P. and Highland, L. \The landslide hand-book - a guide to understanding landslides, a land-mark publication for landslide education and prepared-ness", Landslides: Global Risk Preparedness, pp. 75-84 (2013). DOI: 10.1007/978-3-642-22087-6
43. Idriss, I.M. \Evaluating of seismic risk in engineer-ingpractice", Proc. 11th International Conference on Soil Mechanics and Foundation Engineering, San Fran-cisco, 1, pp. 255-320 (1985).
44. SIMULIA, \Analysis of Reinforced and un-reinforced Soil Slopes using Abaqus", Abaqus Technology Brief, TB-06-SLOPE-1 (2007).
45. Nadi, B., Askari, F. and Farzaneh, O. \Seismic perfor-mance of slopes in pseudo-static designs with dierent safety factors", International Journal of Science and Technology, 38(2), pp. 465-483 (2014).
46. Terzaghi, K., Mechanism of Landslides. Application of Geology to Engineering Practice, Geological Society of America (GSA), Berkey Volume, pp. 83-123 (1950).
47. Marcuson, W.F. and Franklin, A.G. \Seismic design analysis and remedial measures to improve the sta-bility of existing earth dams", Corps of Engineers Approach, in Seismic Design of Embankments and Caverns, Howard, T.R. Ed., New York, USA (1983). 48. Hynes-Grin, M.E. and Franklin, A.G. \Rationalizing
the seismic coecient method", U.S. Army Corps of Engineers Waterways Experiment Station, Vicksburg, Mississippi, miscellaneous paper GL-84-13 (1984). 49. Road and Railway Bridges Seismic Resistant Design
Code No: 463, Ministry of Roads and Transportation, Deputy of Training; Research and Information Tech-nology, Iran (2008).
Biographies
Elham Ghanbari Alamooti is a graduate stu-dent of MSc degree of Geotechnical Engineering from Kharazmi University of Tehran. She has also obtained her BSc degree in Civil Engineering from Shahid Madani Azarbayejan University of Tabriz. She has been working on numerical modelling of rapid impact
compaction in loose sands and dynamic compaction adjacent to sandy slopes during her MSc studies since 2012. Currently, she is working as a supervisor engi-neer at bridgework projects at central Municipality of Karaj.
Amir Hamidi is an Associate Professor in the School of Engineering in Kharazmi University of Tehran. He has obtained his BSc and MSc degrees from Civil Engineering Department of Sharif University of Technology in 1997 and 1999, respectively. He has also received his PhD degree in Geotechnical Engineering from Department of Civil Engineering, Sharif University of Technology in 2005 working on experimental behavior and constitutive modeling of cemented gravely sands. His research interests include experimental soil mechanics, plasticity concepts and constitutive modeling, and ground improvement. Dr. Hamidi has been professionally working in a variety of ground improvement projects, especially dynamic compaction and land reclamation.